



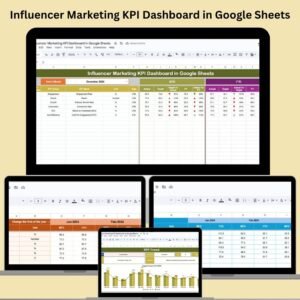
nfluencer marketing is powerful—but only if you can measure it. The Influencer Marketing KPI Dashboard in Google Sheets is a ready-to-use, fully customizable dashboard that helps you track, analyze, and optimize influencer campaigns in real-time. Whether you’re managing micro-influencers or large partnerships, this dashboard provides a complete performance snapshot—all in one place.

📊 Key Features of the Influencer Marketing KPI Dashboard
📋 Dashboard Sheet Tab
Get a powerful summary of your influencer marketing results:
📆 MTD (Month-to-Date) and YTD (Year-to-Date) Actuals
🎯 Target vs. Actual – Instantly see how campaigns are performing against your goals
📉 PY vs. Actual – Compare this year’s performance with the previous year using conditional formatting and arrows
📍 Month Selector – Pick any month from a dropdown and watch the dashboard update automatically
📈 KPI Trend Sheet Tab
Track individual KPI trends over time:
Choose any KPI using a dropdown
View KPI Group, Unit, Type (UTB or LTB), Formula, and Description
Spot trends early and act fast
🧮 Data Input Tabs
Actual Numbers Sheet – Enter MTD and YTD actuals by KPI
Target Sheet – Set your performance goals for both MTD and YTD
Previous Year Sheet – Log historical performance for year-over-year comparison
📘 KPI Definition Sheet Tab
A complete reference for all KPIs used in the dashboard
Fields include: KPI Name, Group, Unit, Formula, and Definition
📦 What’s Inside the Dashboard?
You’ll receive six interconnected sheets, all fully editable and dynamic:
Dashboard Sheet – Interactive summary of campaign performance
KPI Trend Sheet – Visualize metric trends over time
Actual Numbers Sheet – Enter current campaign data
Target Sheet – Input your monthly and yearly performance goals
Previous Year Sheet – Store and compare last year’s campaign data
KPI Definitions Sheet – Quick reference to understand what each metric means
The entire dashboard updates automatically as you input data—no formulas or technical skills required.
🚀 How to Use the Influencer Marketing KPI Dashboard
1️⃣ Set KPIs – Define your goals in the Target Sheet
2️⃣ Log Performance – Enter MTD and YTD numbers into the Actual Sheet
3️⃣ Select Month – Choose a reporting month and see metrics update instantly
4️⃣ Analyze Performance – View results against goals and previous year’s benchmarks
5️⃣ Optimize Campaigns – Use the KPI Trend tab to make data-driven improvements
This dashboard turns raw metrics into meaningful insights you can act on.
👥 Who Can Benefit from This Dashboard?
📱 Social Media Managers – Track influencer ROI and engagement rates
🏢 Marketing Teams – Evaluate campaign effectiveness and optimize targeting
🤝 Agencies – Present clean reports to clients
📊 Freelance Consultants – Show clear campaign impact with real-time dashboards
📈 Startup Founders & Ecommerce Brands – Understand what’s working and scale smarter
Whether you’re working with 3 influencers or 300—this dashboard keeps you in control.
💡 Why You’ll Love This Google Sheets Template
✅ Easy-to-use, no setup required
✅ Auto-updating performance indicators
✅ Clear visuals and color-coded trends
✅ Fully editable to match your campaign needs
✅ Ideal for team collaboration or client reporting
✅ 100% Google Sheets—accessible anywhere
Streamline your influencer tracking process today.
🔁 Click here to read the Detailed blog post
Click here to read the Detailed blog post
Watch the step-by-step video Demo:
🎥 Visit our YouTube channel to learn step-by-step video tutorials
Youtube.com/@NeotechNavigators
Compatibility and Requirements
- Works in Google Sheets. You need a free Google account and a web browser.
- You pick the month and the KPI from dropdowns on the Dashboard and KPI Trend sheets. Google explains dropdowns in Create an in-cell dropdown list.
Frequently Asked Questions
Which sheets are included?
Six sheets: Dashboard, KPI Trend, Actual Numbers, Target, Previous Year and KPI Definition.
How do I update the dashboard?
Enter your MTD and YTD actuals in the Actual Numbers sheet and your goals in the Target sheet. Then choose a month on the Dashboard sheet and it updates.
Can I compare this year with last year?
Yes. Log last year’s figures in the Previous Year sheet. The Dashboard compares them with your actuals using conditional formatting and arrows.
How do I see the trend for a single KPI?
Open the KPI Trend sheet and choose the KPI from the dropdown. It also shows the KPI group, unit, type (UTB or LTB), formula and description.
Is there an Excel or Power BI version?
Yes. See the Influencer Marketing KPI Dashboard in Excel and the Influencer Marketing KPI Dashboard in Power BI.
Related Influencer and Marketing Templates
- Influencer Marketing KPI Dashboard in Excel: the same KPIs in Excel
- Influencer Marketing KPI Dashboard in Power BI: the Power BI edition
- Influencer Marketing Campaign Performance Dashboard in Google Sheets: a campaign-level view
- Social Media Influencer Tracking Dashboard in Google Sheets: track influencers across social channels
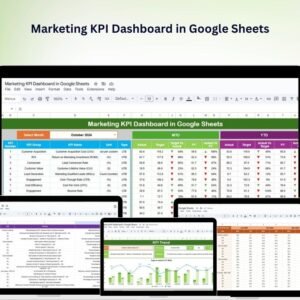
- Marketing KPI Dashboard in Google Sheets: KPIs for your wider marketing
Browse all Google Sheets KPI dashboards and Google Sheets sales and marketing templates.



Reviews
There are no reviews yet.