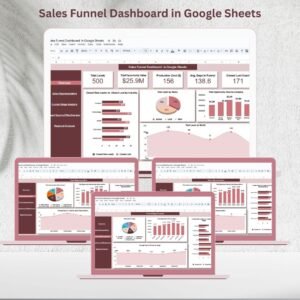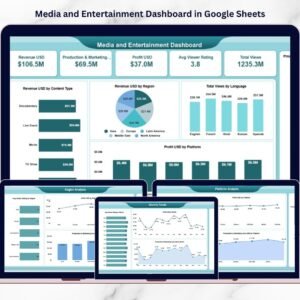
Sales performance is the backbone of business growth 📈. Targets, actual sales, variance, and achievement status must be tracked continuously to ensure teams stay aligned with business goals. However, when organizations rely on manual reports or disconnected spreadsheets, sales visibility drops, insights arrive late, and decision-making slows down. That is exactly where a Sales Performance Management Dashboard in Google Sheets becomes a game-changer.
The Sales Performance Management Dashboard in Google Sheets is a ready-to-use, interactive reporting solution designed to track sales targets, actual performance, and achievement status in one centralized place. Instead of reviewing multiple sales reports, managers and leadership teams gain a single, visual dashboard that highlights performance gaps, top performers, and growth opportunities clearly 📊.
Because the dashboard is built in Google Sheets, it combines automation, flexibility, and real-time collaboration, making it ideal for modern sales teams. As a result, organizations move from reactive sales tracking to proactive sales performance management.
✅ Key Features of Sales Performance Management Dashboard in Google Sheets
The Sales Performance Management Dashboard in Google Sheets is designed to deliver instant clarity into sales performance 🔍.
It uses KPI cards, charts, performance flags, and interactive slicers to present sales insights in a structured and actionable way.
Key highlights include:
-
Target vs Actual sales tracking
-
Achieved vs Not Achieved target analysis
-
Variance calculation and performance flags
-
Product, Region, and Sales Rep-wise analysis
-
Monthly and yearly performance trends
Because all KPIs and visuals update automatically, sales teams save time and focus on execution rather than manual reporting.
📦 What’s Inside the Sales Performance Management Dashboard in Google Sheets
This product includes multiple well-structured analysis pages, each focused on a different sales performance perspective:
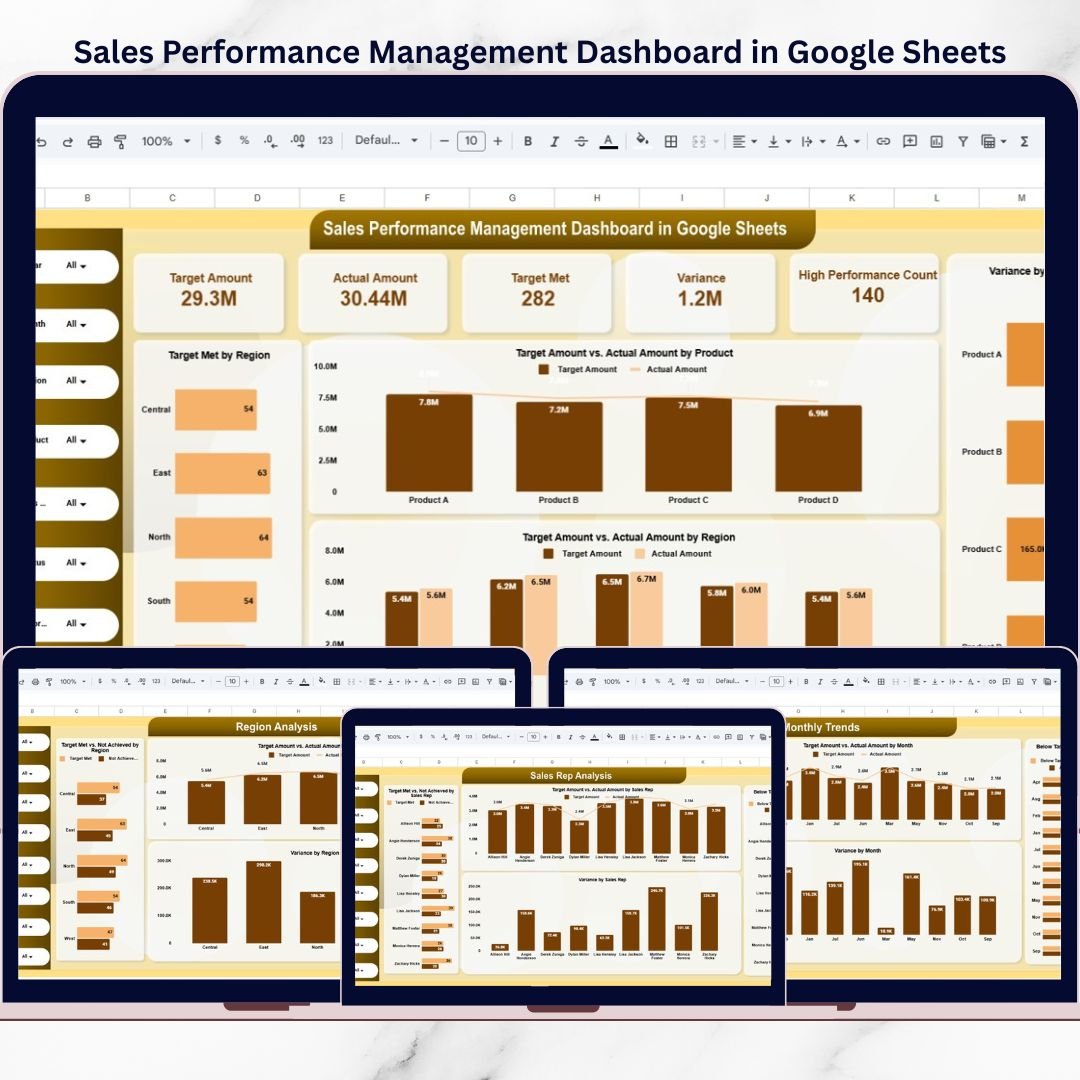
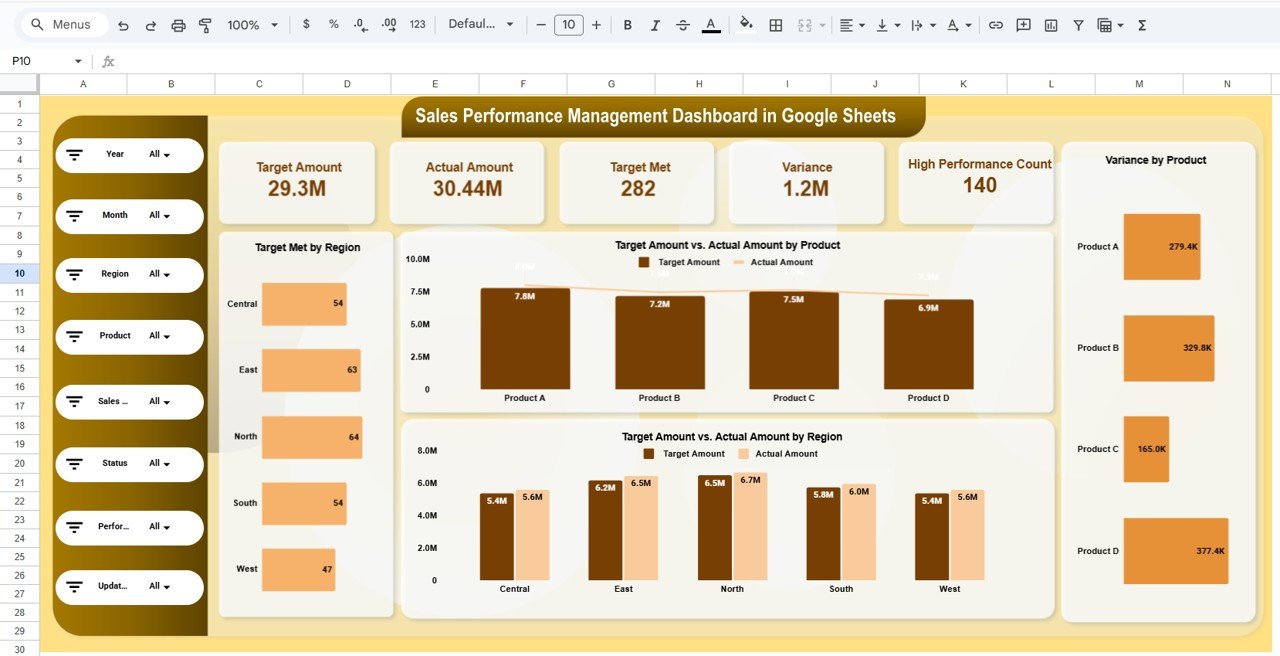
1️⃣ Sales Performance Overview Page
This is the main landing page 🧭.
Top KPI cards display:
-
Target Amount
-
Actual Amount
-
Target Met Count
-
Variance
-
High Performance Count
Key visuals include:
-
Target Met by Region
-
Target vs Actual Sales by Product
-
Target vs Actual Sales by Region
-
Variance by Product
Interactive slicers allow filtering by:
Year, Month, Region, Product, Sales Rep, Status, and Performance Flag.
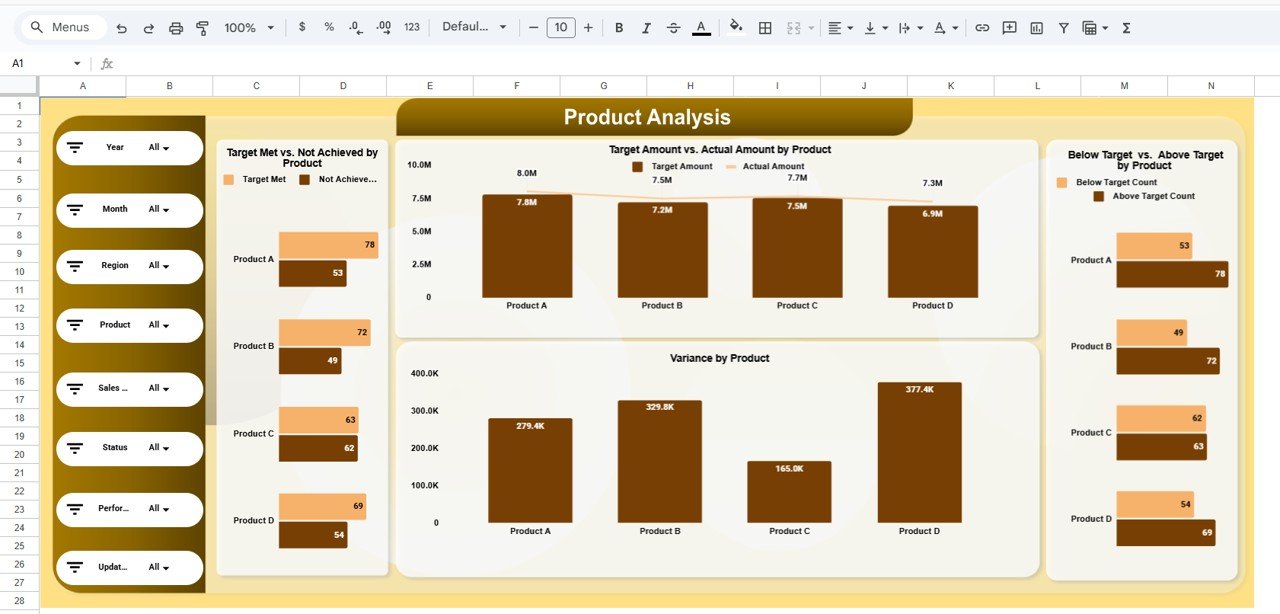
2️⃣ Product Analysis Page
The Product Analysis Page focuses on product-wise sales performance 📦.
Insights include:
-
Target Met vs Not Achieved by Product
-
Target vs Actual Sales by Product
-
Variance by Product
-
Below Target vs Above Target Count
This page helps teams identify best-selling products and products missing targets.
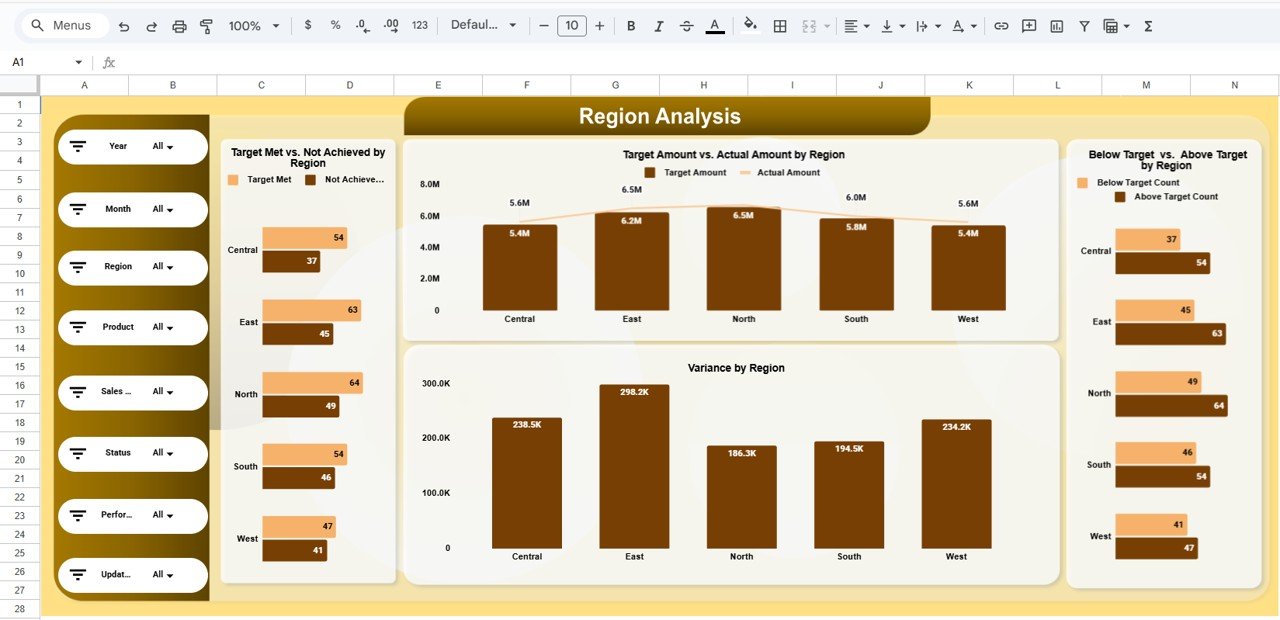
3️⃣ Region Analysis Page
The Region Analysis Page provides geographical insights 🌍.
It shows:
-
Target Met vs Not Achieved by Region
-
Target vs Actual Sales by Region
-
Variance by Region
-
Below Target vs Above Target Count by Region
Management can quickly identify high-performing and underperforming regions.
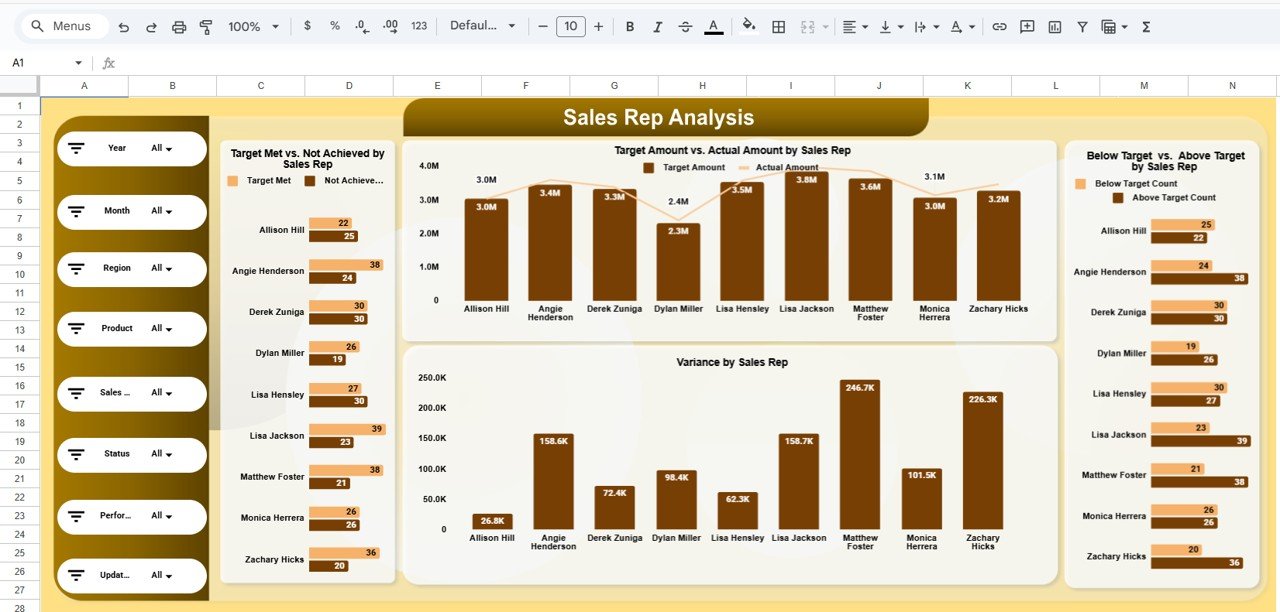
4️⃣ Sales Rep Analysis Page
This page tracks individual salesperson performance 👤.
Insights include:
-
Target Met vs Not Achieved by Sales Rep
-
Target vs Actual Sales by Sales Rep
-
Variance by Sales Rep
-
Below Target vs Above Target Count
This transparency supports incentive planning, coaching, and performance reviews.
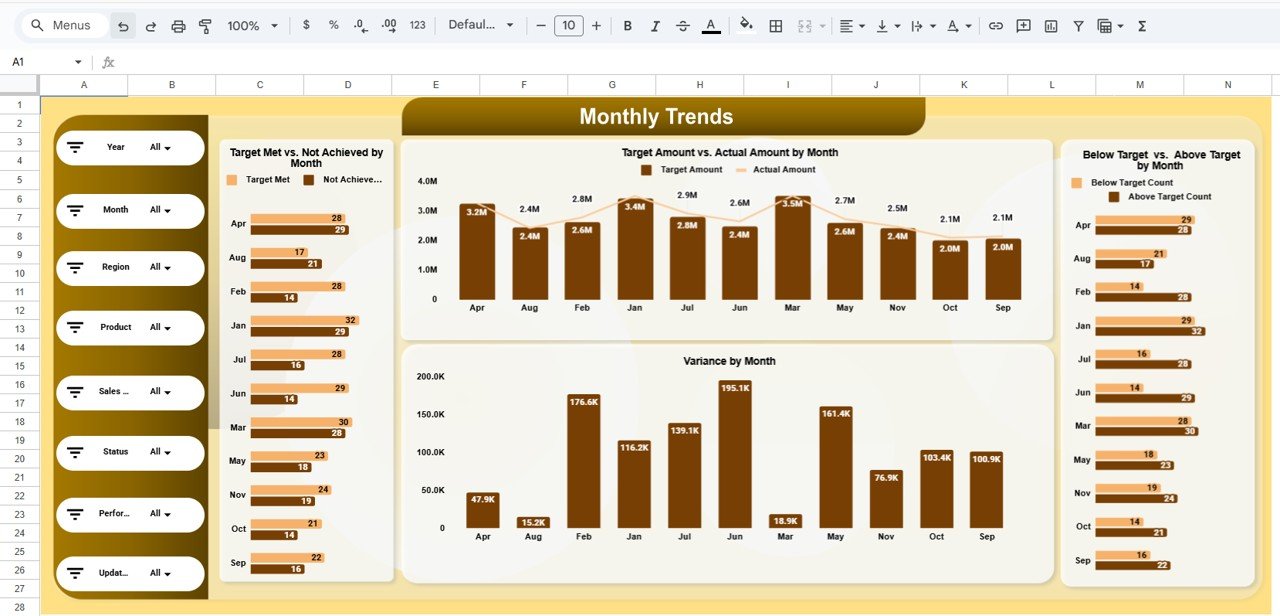
5️⃣ Monthly Trends Page
The Monthly Trends Page focuses on time-based sales behavior 📆.
Metrics tracked:
-
Target Met vs Not Achieved by Month
-
Target vs Actual Sales by Month
-
Variance by Month
-
Below Target vs Above Target Count
This page helps detect seasonality and performance improvements over time.
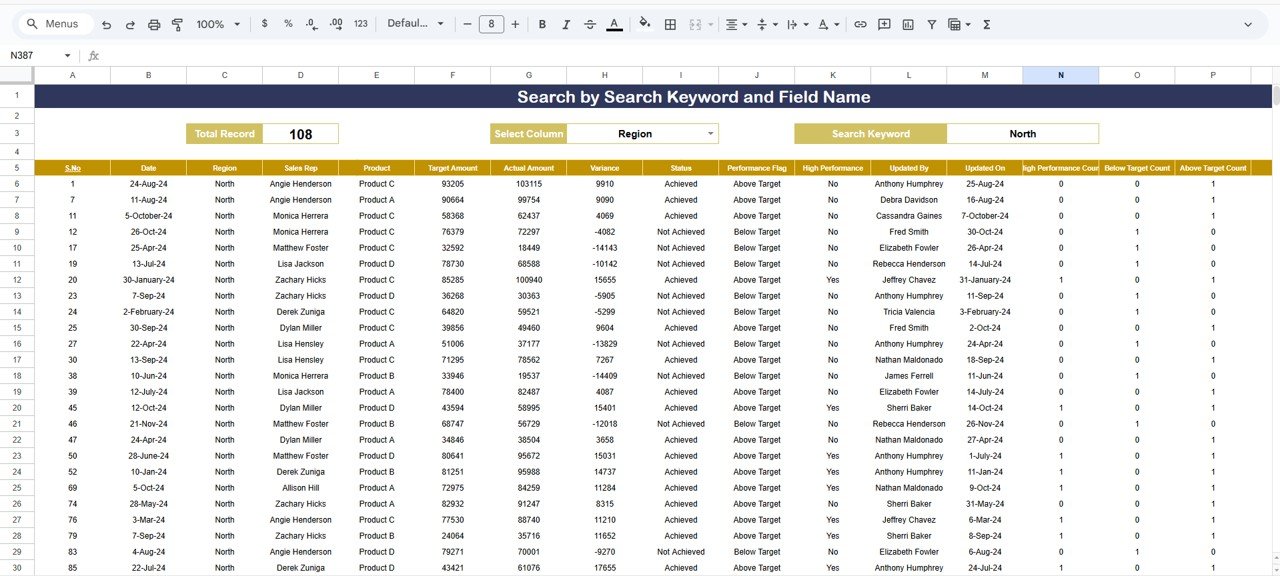
6️⃣ Search & Detailed Records Page
This page supports deep-dive analysis 🔎.
Features include:
-
Search by selected column
-
Keyword-based filtering
-
Detailed transaction-level sales records
-
Performance flag and status visibility
It is ideal for audits, validations, and detailed sales reviews.
🛠️ How to Use the Sales Performance Management Dashboard in Google Sheets
Using the dashboard is simple and intuitive 👍.
First, enter sales targets and actual sales data in the backend sheet.
Next, review KPIs and charts on the Overview Page.
Then, use slicers to filter by product, region, or sales rep.
Finally, analyze trends and detailed records to drive decisions.
Because all calculations are automated, insights update instantly without manual work.
👥 Who Can Benefit from This Sales Performance Management Dashboard
This dashboard is ideal for:
-
Sales Managers
-
Sales Operations Teams
-
Business Leaders
-
Revenue Analysts
-
Strategy and Planning Teams
It works perfectly for organizations aiming to improve sales accountability and revenue performance.
🔗 Click here to read the Detailed blog post
Watch the step-by-step video tutorial: