

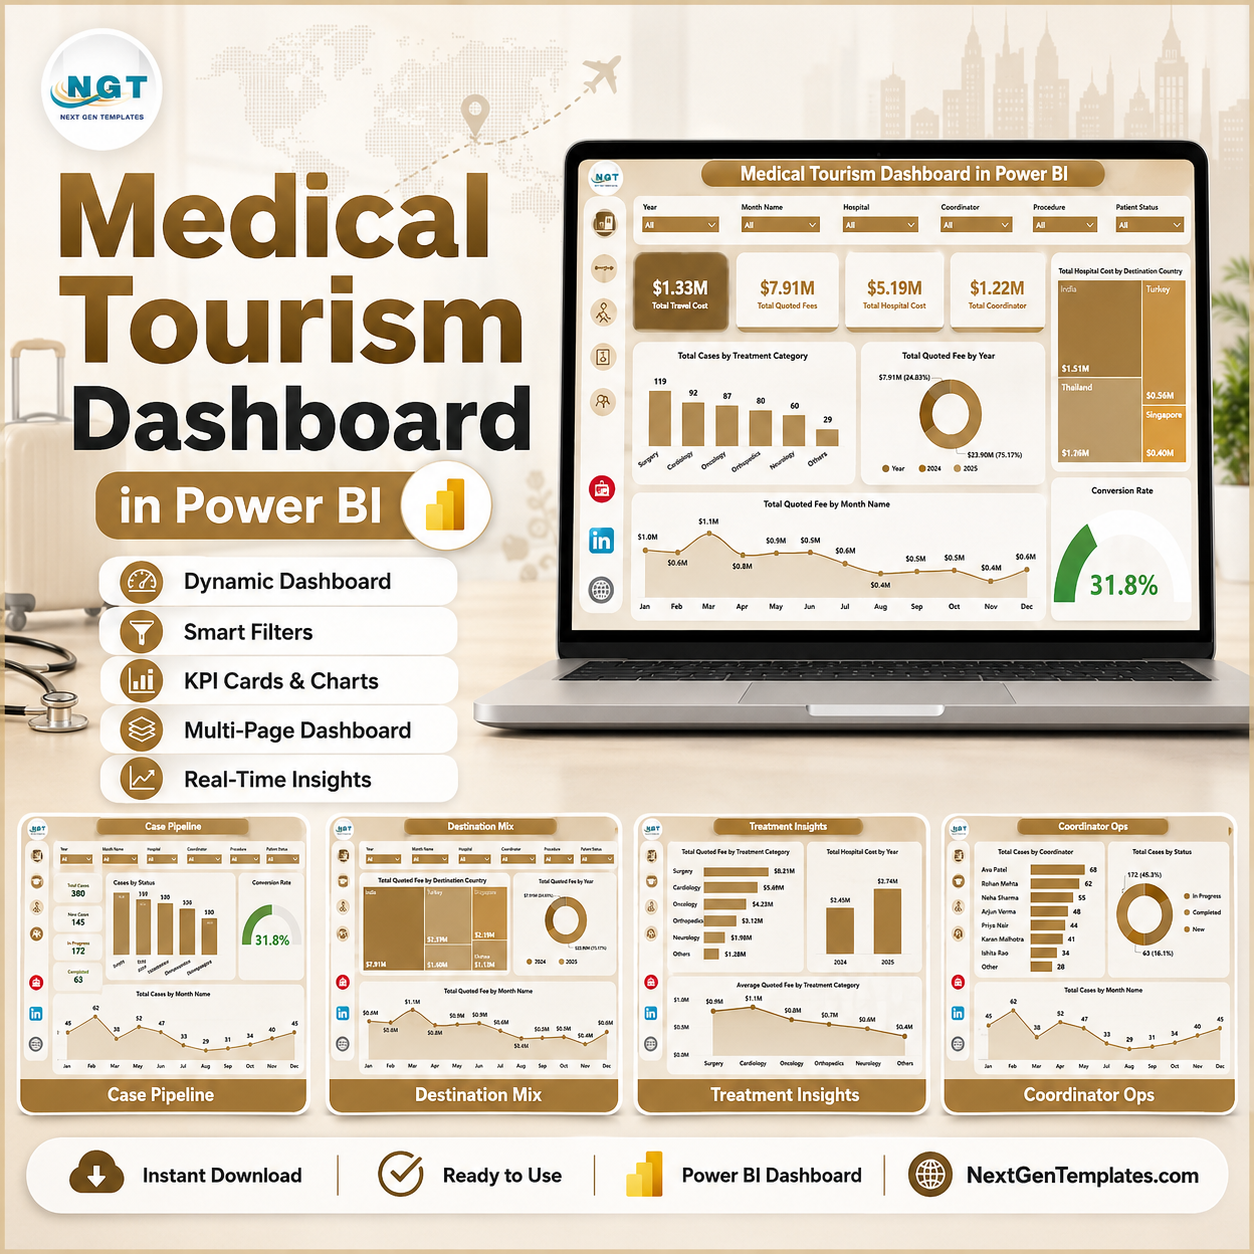

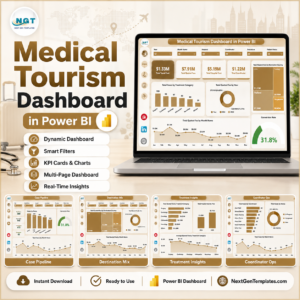
Medical Tourism Dashboard in Power BI helps medical tourism agencies, hospital international patient teams, destination partners, and healthcare consultants review case volume, quoted fees, hospital cost, travel cost, completion rate, satisfaction, coordinator workload, and net contribution in one editable PBIX report. The template includes 5 report pages, 4 executive KPI cards, 17 focused visuals, and slicers for quick filtering. Built by PK, a Microsoft Certified Professional with 15+ years of Excel and Power BI experience and 300K+ YouTube subscribers across channels, this dashboard gives you a practical risk reversal: one-time download, no monthly SaaS fee, and a report you can adapt in Power BI Desktop.
Key Features of Medical Tourism Dashboard in Power BI
- 5 Power BI pages: Overview Page, Case Pipeline, Destination Mix, Treatment Insights, and Coordinator Ops.
- 4 high-level KPI cards: Total Travel Cost, Total Quoted Fee, Total Hospital Cost, and Net Contribution.
- 17 analysis visuals: Review destination country cost, treatment category demand, quoted fee trends, completion rate, referral channels, case status, package type, hospitals, patient country, coordinators, travel status, and contribution margin.
- Interactive slicers: Apply filters quickly during pipeline reviews, destination planning, and coordinator meetings.
- Power BI-ready PBIX file: Open in Power BI Desktop, replace or connect your prepared data, refresh the model, and customize pages as needed.
What’s Inside the Medical Tourism Dashboard in Power BI
1 – Overview Page
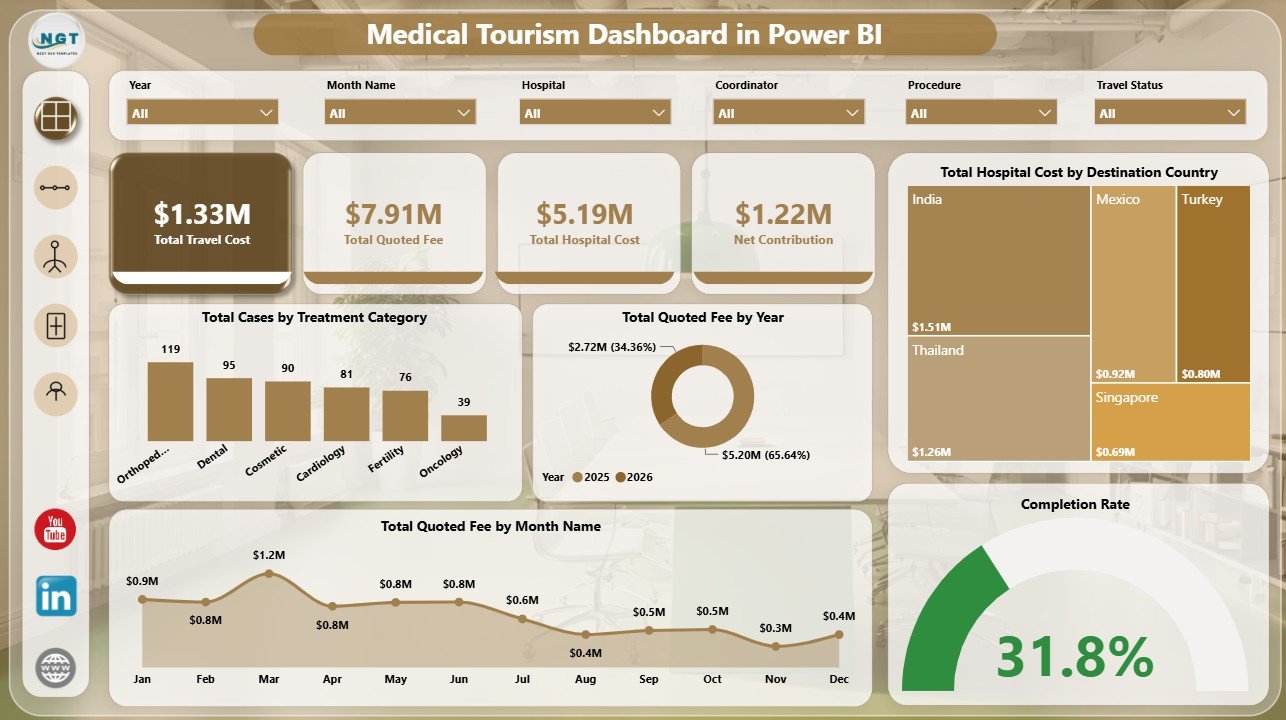
The Overview Page gives leaders a high-level view of the medical tourism business. The KPI cards show Total Travel Cost, Total Quoted Fee, Total Hospital Cost, and Total Hospital Cost so teams can compare revenue opportunity with the cost base behind international patient care.
Total Hospital Cost by Destination Country: This visual compares provider cost across destination countries. It helps identify markets where treatment delivery is more expensive and where hospital partner negotiations may improve margin.
Total Cases by Treatment Category: This chart shows case volume by treatment category. It helps sales and care teams understand which treatments generate the most demand.
Total Quoted Fee by Year: This visual tracks quoted fee by year. It helps managers see whether the medical tourism pipeline is expanding, flat, or declining over time.
Total Quoted Fee by Month Name: This monthly chart highlights seasonality and campaign impact. It helps teams plan follow-up, marketing, and coordinator capacity around stronger months.
Completion Rate: This visual summarizes how effectively cases move to completion. It helps leadership monitor delivery reliability and identify follow-up gaps.
2 – Case Pipeline
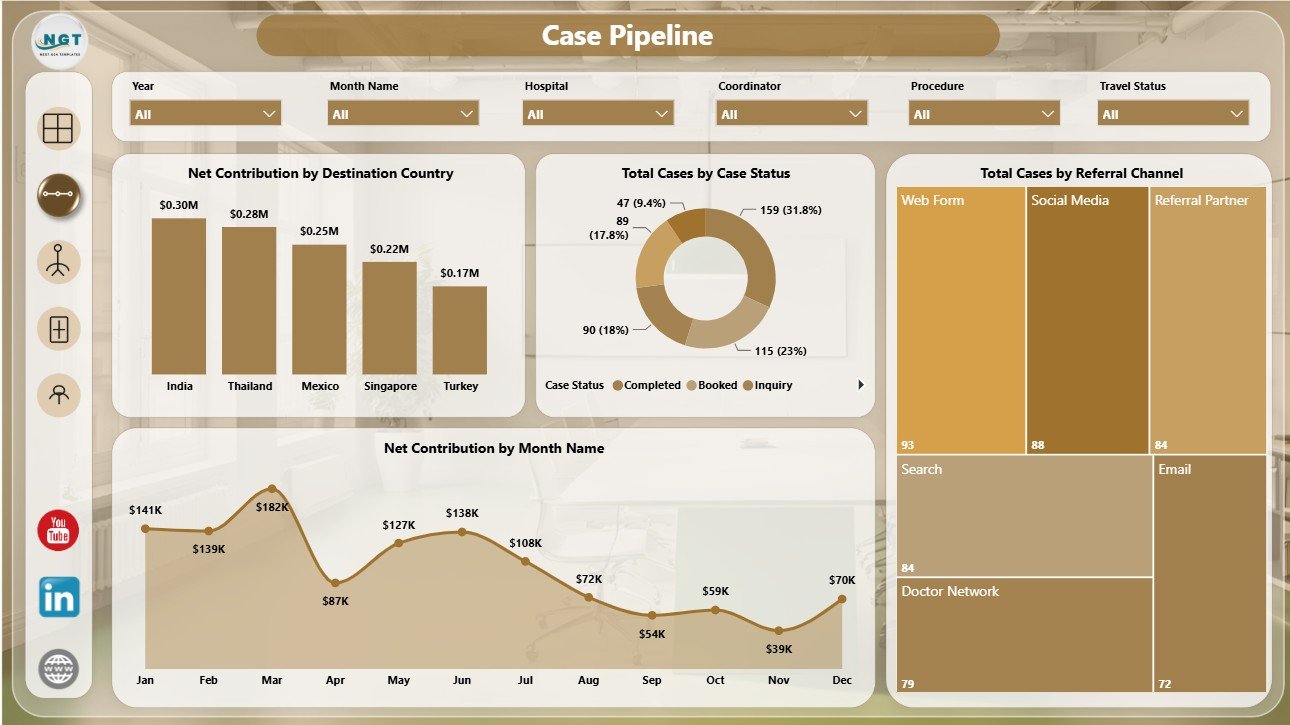
The Case Pipeline page focuses on case movement, source quality, destination profitability, and monthly contribution. It is useful for weekly pipeline reviews and conversion discussions.
Net Contribution by Destination Country: This chart compares financial contribution after cost by destination. It helps leaders identify countries that generate stronger commercial outcomes.
Total Cases by Case Status: This visual shows the distribution of cases across pipeline stages. It helps teams spot follow-up bottlenecks, pending cases, cancellations, and completed work.
Total Cases by Referral Channel: This chart compares case volume by referral source. It helps marketing and partnership teams understand which channels bring the most patient opportunities.
Net Contribution by Month Name: This monthly visual shows how contribution changes over time. It supports finance reviews and helps explain profitable or weak months.
3 – Destination Mix
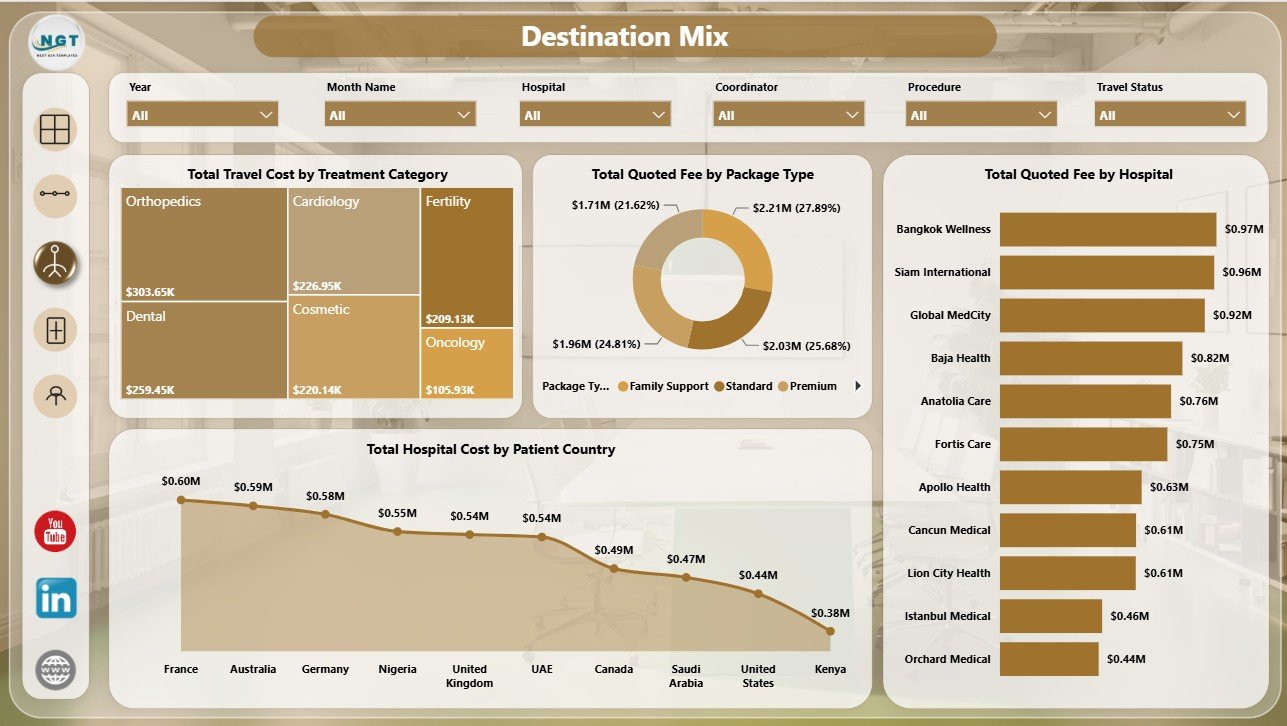
The Destination Mix page explains how travel cost, package type, hospital partner, and patient country affect the business. It supports destination planning, package review, and hospital partner analysis.
Total Travel Cost by Treatment Category: This chart compares travel cost by treatment type. It helps teams see which services require higher travel support and budget planning.
Total Quoted Fee by Package Type: This visual compares quoted fee across package structures. It helps evaluate standard, premium, bundled, and other package offerings.
Total Quoted Fee by Hospital: This chart shows which hospital partners are associated with the highest quoted fee. It helps business teams prioritize partner reviews and sales efforts.
Total Hospital Cost by Patient Country: This visual compares hospital cost by source market. It helps analysts review whether patients from certain countries show different cost patterns.
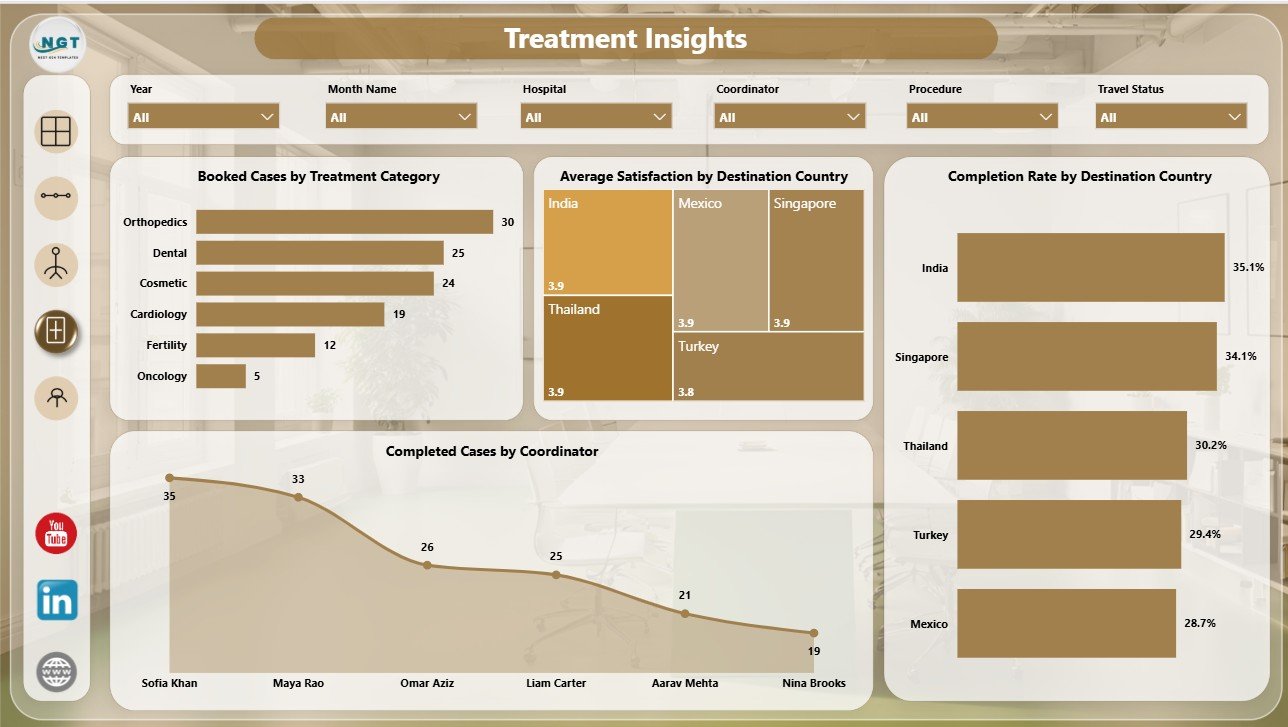
4 – Treatment Insights
The Treatment Insights page connects treatment demand, satisfaction, completion rate, and coordinator output. It is helpful for improving patient experience and reviewing treatment category performance.
Booked Cases by Treatment Category: This chart compares booked demand across treatment categories. It helps teams identify the procedures and services most likely to convert.
Average Satisfaction by Destination Country: This visual compares patient satisfaction across destinations. It helps managers monitor experience quality and destination partner performance.
Completion Rate by Destination Country: This chart shows how completion reliability differs by destination. It helps reveal where coordination, patient readiness, or provider workflow may need attention.
Completed Cases by Coordinator: This visual compares completed case volume by coordinator. It helps leaders review workload, follow-through, and operational ownership.
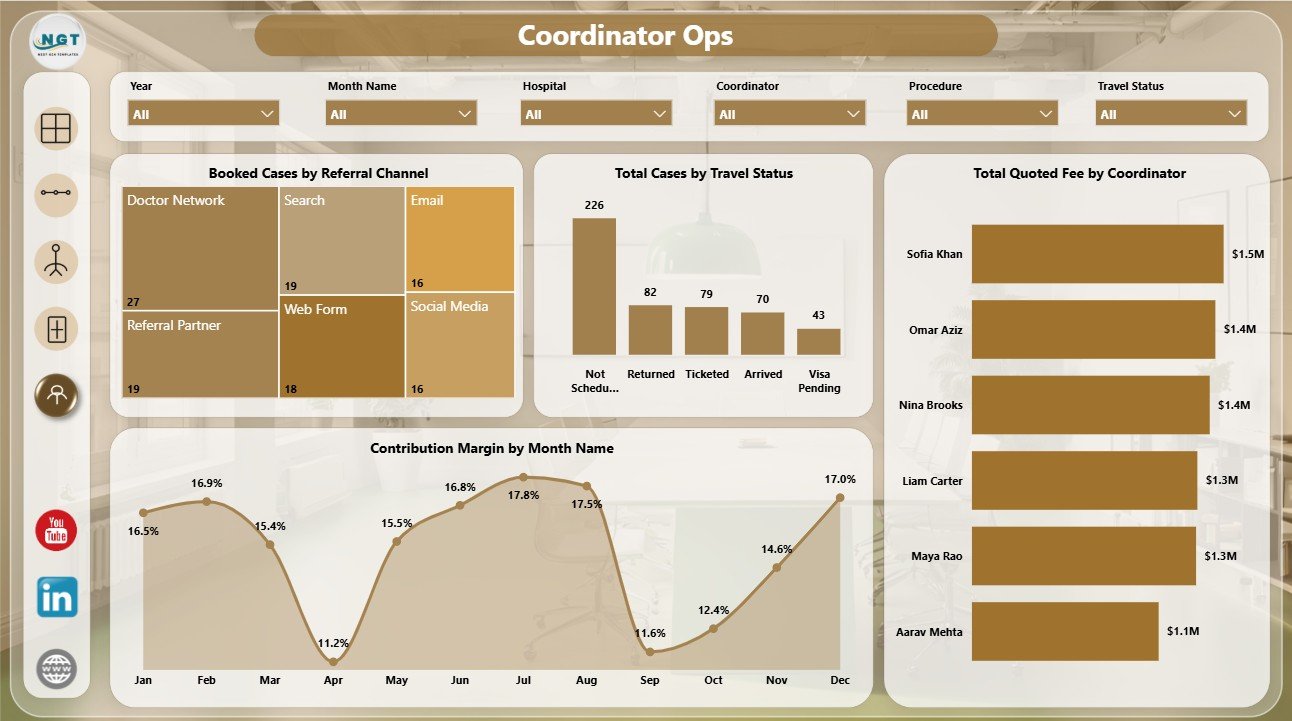
5 – Coordinator Ops
The Coordinator Ops page brings referral quality, travel status, coordinator fee value, and margin movement together. It is useful for operating reviews and monthly coordinator performance discussions.
Booked Cases by Referral Channel: This chart compares booked cases by source. It helps teams see which referral channels produce patients who move beyond inquiry.
Total Cases by Travel Status: This visual shows where patients are in the travel process. It helps coordinators track pre-travel, in-travel, completed, delayed, or cancelled stages.
Total Quoted Fee by Coordinator: This chart compares quoted fee managed by each coordinator. It helps leadership understand commercial workload and account ownership.
Contribution Margin by Month Name: This visual tracks margin movement month by month. It helps finance teams identify whether profitability is improving or weakening.
Medical Tourism Dashboard in Power BI vs. Tableau vs. Paid CRM/SaaS – Where This Fits
| Feature | This Power BI dashboard | Tableau or Qlik alternative | Paid healthcare CRM/SaaS |
|---|---|---|---|
| Cost | $17.99 sale price, one-time | License plus report build time | Recurring subscription |
| Platform | Power BI Desktop / Power BI Service | Tableau, Qlik, or another BI tool | Vendor-hosted platform |
| Setup time | Open PBIX, replace or connect data, refresh | Build or adapt report pages | Implementation and onboarding |
| Customizable fields | Editable model, visuals, measures, and pages | Editable with BI skills | Depends on vendor permissions |
| Year-1 cost at 5 users | $17.99 plus any Microsoft licensing | License and build cost dependent | Often hundreds or thousands |
| Medical tourism analysis | Case pipeline, destination mix, treatments, coordinators, costs, contribution, and satisfaction | Must be designed | Depends on module and export access |
Who This Template Is For – and Who It’s Not For
This template is for medical tourism agencies, international patient departments, healthcare travel coordinators, destination management companies, referral teams, finance analysts, and consultants who need repeatable Power BI reporting for patient travel, hospital cost, quoted fee, case status, satisfaction, and margin.
It is not a CRM, booking engine, patient portal, billing platform, clinical record system, payment processor, or hospital information system. Use it as an analytics layer after your medical tourism data is available in a structured source.
How to Use the Medical Tourism Dashboard in Power BI
- Download and unzip the template package.
- Open the PBIX file in Power BI Desktop.
- Review the sample pages, KPI cards, charts, slicers, and model fields.
- Replace the sample data or connect your prepared medical tourism dataset.
- Refresh the report and validate quoted fees, travel cost, hospital cost, cases, completion rate, satisfaction, coordinator, status, and date fields.
- Customize visuals, measures, colors, page names, or model relationships as needed.
Real-World Use Cases
Aarav, medical tourism agency owner: reviews quoted fees, hospital cost, travel cost, and net contribution before choosing which destination countries deserve more sales focus.
Maria, international patient coordinator: uses the Case Pipeline and Coordinator Ops pages to track case status, referral channel quality, travel status, and coordinator workload.
Dr. Khan, healthcare consultant: compares treatment demand, satisfaction, completion rate, hospitals, packages, and destination mix before advising a hospital partnership team.
Frequently Asked Questions
What does this dashboard track?
It tracks quoted fees, hospital costs, travel costs, net contribution, cases, booked cases, completed cases, satisfaction, completion rate, destination country, patient country, treatment category, package type, hospital, referral channel, case status, travel status, coordinator, and month.
What software do I need?
You need Power BI Desktop to open, edit, refresh, and customize the PBIX file.
Can I use my own medical tourism data?
Yes. Replace the sample dataset or connect your prepared data source, then refresh the report in Power BI Desktop.
Can I customize the report pages?
Yes. You can edit visuals, measures, fields, slicers, page names, colors, and model relationships as needed.
Does it include a live hospital system connector?
No direct hospital system connector is included. Export, prepare, or connect your own structured source in Power BI.
Is this suitable for patient-level reporting?
It can be adapted for structured operational reporting, but sensitive patient data should only be used according to your privacy, consent, and security rules.
About the Author
Built by PK – Microsoft Certified Professional with 15+ years of Excel, Google Sheets, and Power BI experience. Founder of NextGenTemplates, reaching 300K+ subscribers across YouTube channels. Every template is hand-built and tested before release.
Explore Related Templates
- Medical Tourism Dashboard in Excel – Excel version for medical tourism reporting.
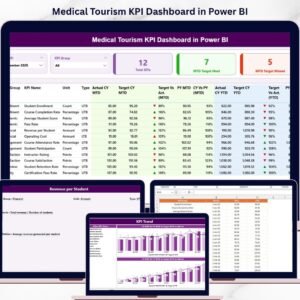
- Medical Tourism KPI Dashboard in Power BI – KPI-focused Power BI template.
- Home Healthcare KPI Dashboard in Power BI – Healthcare operations KPI dashboard.
- Browse Power BI templates.
- Browse Power BI dashboard templates.
Download the Medical Tourism Dashboard in Power BI and start reviewing destination mix, case pipeline, treatment insights, coordinator operations, cost, contribution, and satisfaction in one editable PBIX report.
Last updated: July 8, 2026.
Watch the step-by-step video tutorial:
Compatibility and Requirements
- Works in Power BI Desktop, which is free. Microsoft explains the download in Get Power BI Desktop.
- You open the PBIX file, replace or connect your own prepared data, and refresh the report.






















Reviews
There are no reviews yet.