



The Medical Equipment Manufacturing Dashboard industry operates under zero-tolerance standards for defects, delays, and compliance gaps. Every production unit, machine hour, and downtime incident directly impacts patient safety, regulatory approval, and profitability. However, many manufacturers still rely on disconnected reports from ERP systems, maintenance logs, and spreadsheets. As a result, decision-making becomes slow, reactive, and risky.
That is exactly where the Medical Equipment Manufacturing Dashboard in Power BI delivers transformational value 🚀.
This ready-to-use Power BI dashboard converts complex manufacturing data into clear, interactive, and actionable insights. Instead of waiting for manual reports, production managers and executives can track production cost, output, downtime, defects, and manufacturing time in real time—across plants, equipment categories, products, and months.
Built for scalability, clarity, and speed, this dashboard empowers organizations to improve efficiency, reduce waste, strengthen compliance, and make confident data-driven decisions.
🔑 Key Features of Medical Equipment Manufacturing Dashboard in Power BI
📊 Centralized Manufacturing Intelligence
🏭 Plant-Wise & Equipment-Wise Performance Analysis
⚙️ Downtime & Defect Cost Visibility
📦 Product-Level Production Insights
📈 Monthly Trend & Capacity Analysis
🎯 Cost Optimization & Efficiency Tracking
🔍 Interactive Slicers & Drill-Down Analysis
⚡ Real-Time Decision Support
This dashboard transforms manufacturing operations from reactive reporting to proactive performance management.
📂 Dashboard Pages & Business Insights
📊 Overview Page – Executive Manufacturing Snapshot

Medical Equipment Manufacturing Dashboard
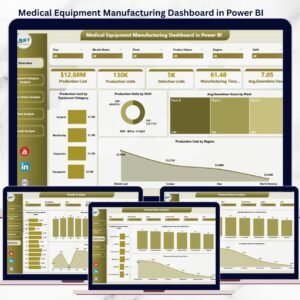
The Overview Page acts as the executive control panel, delivering instant visibility into overall manufacturing health.
Key KPIs & Visuals:
Production Cost by Equipment Category – Identify cost-intensive machinery
Production Units by Shift – Compare productivity across shifts
Average Downtime Hours by Plant – Detect operational bottlenecks
Production Cost by Region – Analyze geographic cost efficiency
With dynamic slicers, leadership can instantly filter by plant, equipment, product, or month.
⚙️ Equipment Category Analysis – Machine-Level Performance
This page highlights how different equipment categories impact efficiency, quality, and cost.
Key Insights:
Cost of Defective Units by Equipment Category
Average Downtime Hours by Equipment Category
Production Units by Equipment Category
👉 Supports preventive maintenance planning, asset optimization, and CAPEX decisions.
📦 Product Name Analysis – Product-Wise Manufacturing Efficiency
Different medical devices require different production complexity.
Key Insights:
Production Cost by Product Name
Average Downtime Hours by Product
Production Units by Product Name
👉 Helps manufacturers optimize product mix, pricing strategies, and production planning.
🏭 Plant Analysis – Multi-Plant Performance Comparison
For organizations operating multiple facilities, this page delivers plant-level transparency.
Key Metrics:
Production Cost by Plant
Manufacturing Time (Hours) by Plant
Production Units by Plant
👉 Enables benchmarking, best-practice standardization, and resource allocation.
📆 Month Analysis – Trend & Forecasting Insights
Time-based insights help organizations plan ahead.
Key Trends:
Production Cost by Month
Manufacturing Time (Hours) by Month
Production Units by Month
👉 Supports capacity planning, budgeting, and seasonal demand forecasting.
🛠️ How the Dashboard Works
✅ Connects to structured manufacturing data
✅ Applies Power BI modeling & DAX measures
✅ Uses slicers for instant filtering
✅ Updates automatically on data refresh
✅ Delivers real-time insights without coding
👥 Who Should Use This Dashboard?
🏭 Medical Equipment Manufacturers
📊 Production & Operations Managers
⚙️ Maintenance & Engineering Teams
🧪 Quality & Compliance Teams
📈 Supply Chain & Cost Control Teams
🏢 Senior Leadership & Executives
Suitable for single-plant and multi-plant manufacturing environments.
▶️ Visit our YouTube channel to learn step-by-step video tutorials
https://youtube.com/@PKAnExcelExpert
🔗 Click here to read the Detailed blog post
Watch the step-by-step video tutorial:
Compatibility and Requirements
- Open the .pbix file in Power BI Desktop, which is free. Microsoft explains how to install it in Get Power BI Desktop.
- The dashboard connects to structured manufacturing data and updates when you refresh it.
Frequently Asked Questions
Which pages are in the Medical Equipment Manufacturing Dashboard?
Overview, Equipment Category Analysis, Product Name Analysis, Plant Analysis and Month Analysis.
What does the Overview page show?
Production cost by equipment category, production units by shift, average downtime hours by plant and production cost by region.
Can I filter the report?
Yes. Slicers filter the pages by plant, equipment, product or month.
Does it work for more than one plant?
Yes. It suits single-plant and multi-plant operations, and the Plant Analysis page compares cost, manufacturing time and units by plant.
Is there an Excel or Google Sheets version?
Yes. See the Medical Equipment Manufacturing Dashboard in Excel and the Medical Equipment Manufacturing Dashboard in Google Sheets.
Related Medical Equipment Templates
- Medical Equipment Manufacturing KPI Dashboard in Power BI: a KPI view of the same operation
- Medical Device KPI Dashboard in Power BI: KPIs for medical device companies
- Medical Equipment Calibration Calendar in Excel: plan equipment calibration dates
- Medical Equipment Manufacturing Dashboard in Excel: the same dashboard in Excel
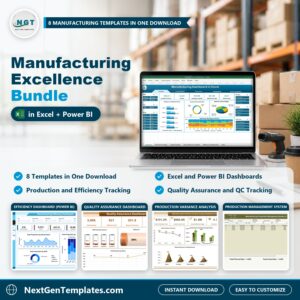
- Manufacturing Excellence Bundle: 8 manufacturing templates in Excel and Power BI
Browse all Power BI dashboard templates or the manufacturing templates.














Reviews
There are no reviews yet.