

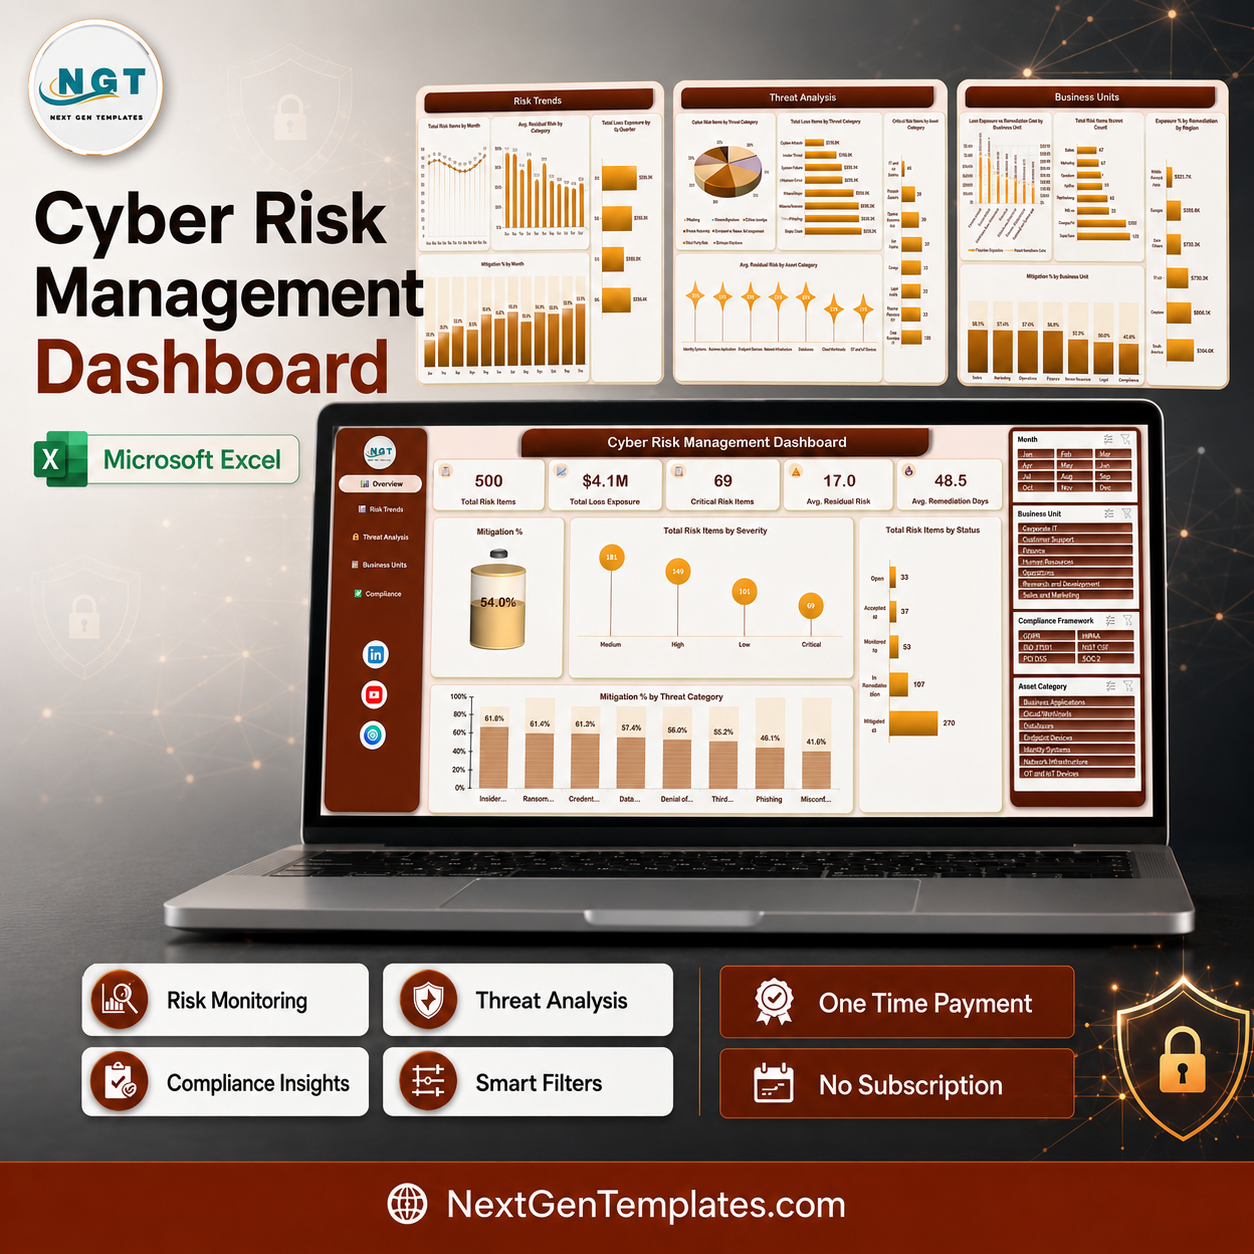
The Cyber Risk Management Dashboard in Excel turns a flat risk register into a five-page reporting pack that a CISO can take into a board meeting. It ships loaded with 500 sample risk records across 7 business units, 7 asset categories, 8 threat categories and 6 compliance frameworks (GDPR, HIPAA, ISO 27001, NIST CSF, PCI DSS, SOC 2), so every chart is populated the second you open it. It is part of the NextGenTemplates catalogue used by 300K+ subscribers across our YouTube channels. One-time payment of $17.99, no subscription, no add-ins and no macros – and if the file will not open in your copy of Excel, email us and we will fix it or refund you.
Key Features of the Cyber Risk Management Dashboard in Excel
- Five linked report pages – Overview, Risk Trends, Threat Analysis, Business Units and Compliance, each reachable from the sidebar navigation.
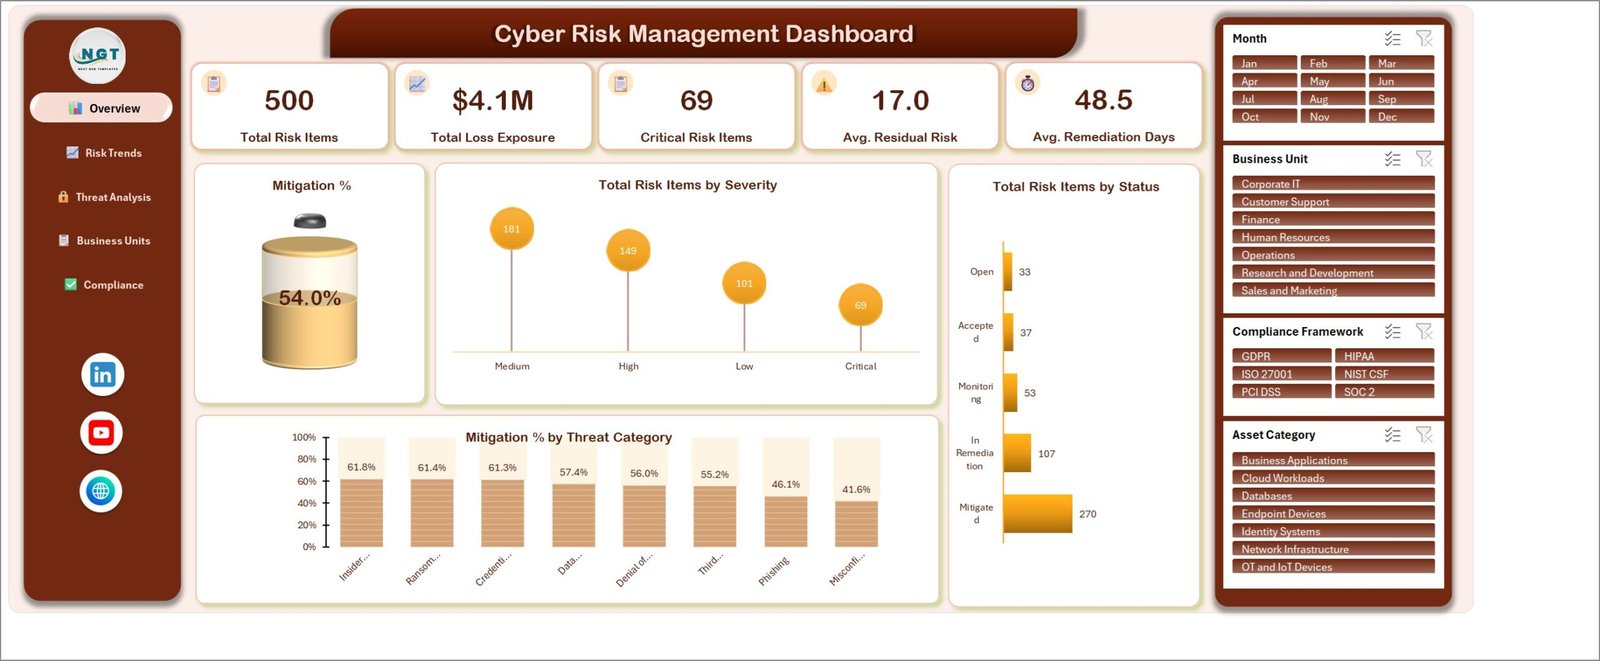
- Five headline KPI cards on the Overview page: Total Risk Items, Total Loss Exposure, Critical Risk Items, Avg. Residual Risk and Avg. Remediation Days.
- Four slicers on every page – Month, Business Unit, Compliance Framework and Asset Category – so one click re-cuts the whole pack.
- A mitigation gauge that reads the closed-versus-open position as a single percentage (54.0% in the sample data).
- Sixteen charts built on PivotTables, including Total Risk Items by Severity, Total Risk Items by Status, Mitigation % by Threat Category and Exposure Net of Remediation by Region.
- A 24-column risk register holding Risk ID, Assessment Date, Business Unit, Region, Asset Category, Threat Category, Compliance Framework, Severity, Status, Likelihood and Impact Scores, Inherent and Residual Risk Scores, Loss Exposure, Remediation Cost, Controls Tested and Passed, Vulnerabilities Found and Closed, Days to Remediate, Assurance Rating, and Month, Quarter and Year helpers.
- No macros and no add-ins. A plain .xlsx workbook that opens in Excel 2016 and later, Microsoft 365 and Excel for Mac.
- Refresh and go. Paste your own register over the Data sheet, press Refresh All, and all five pages redraw.
What Is Inside the Cyber Risk Management Dashboard in Excel
Overview is the executive page. Five KPI cards, the mitigation gauge, Total Risk Items by Severity (Medium 181, High 149, Low 101, Critical 69 in the sample), Total Risk Items by Status across Open, Accepted, Monitoring, In Remediation and Mitigated, and Mitigation % by Threat Category ranked from Insider Threat down to Misconfiguration.
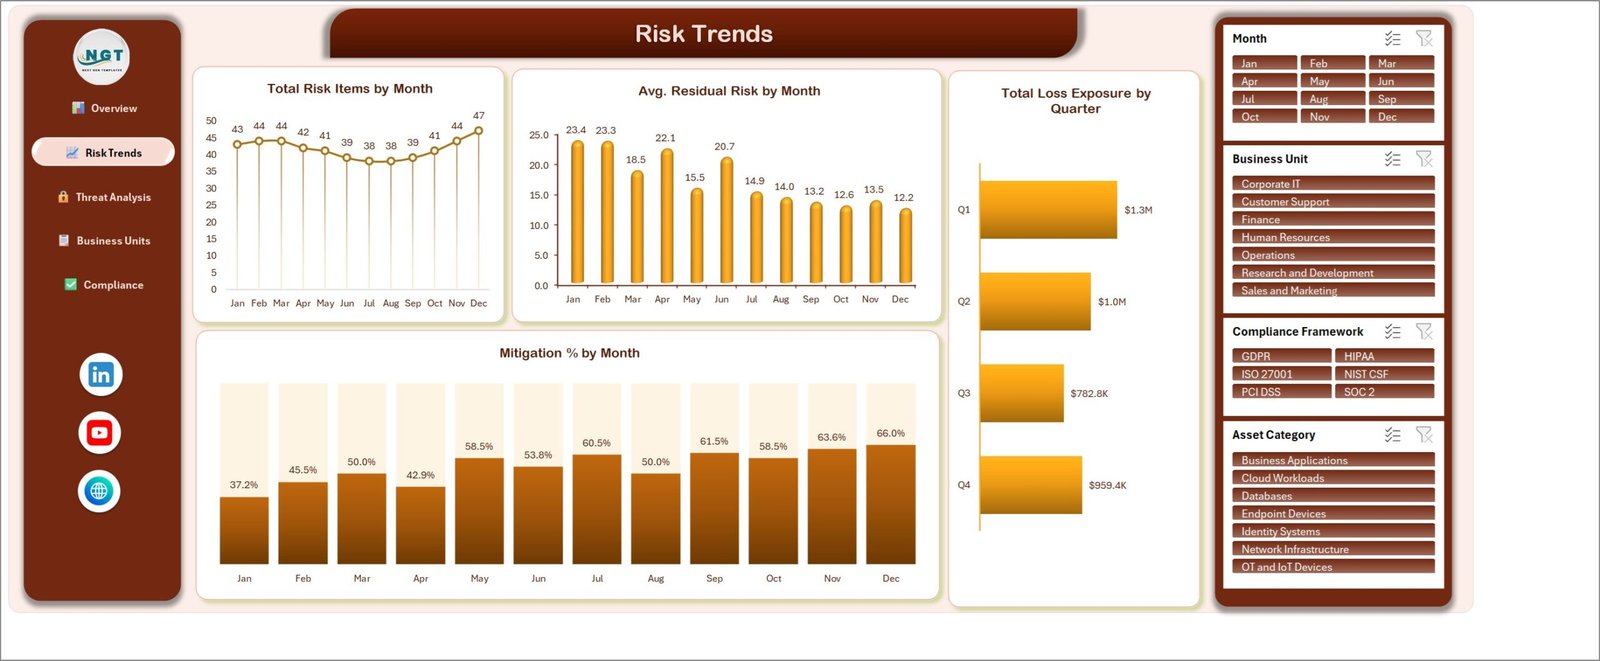
Risk Trends holds Total Risk Items by Month, Avg. Residual Risk by Month, Total Loss Exposure by Quarter and Mitigation % by Month. This is the page that answers whether the programme is actually improving across a twelve-month window.
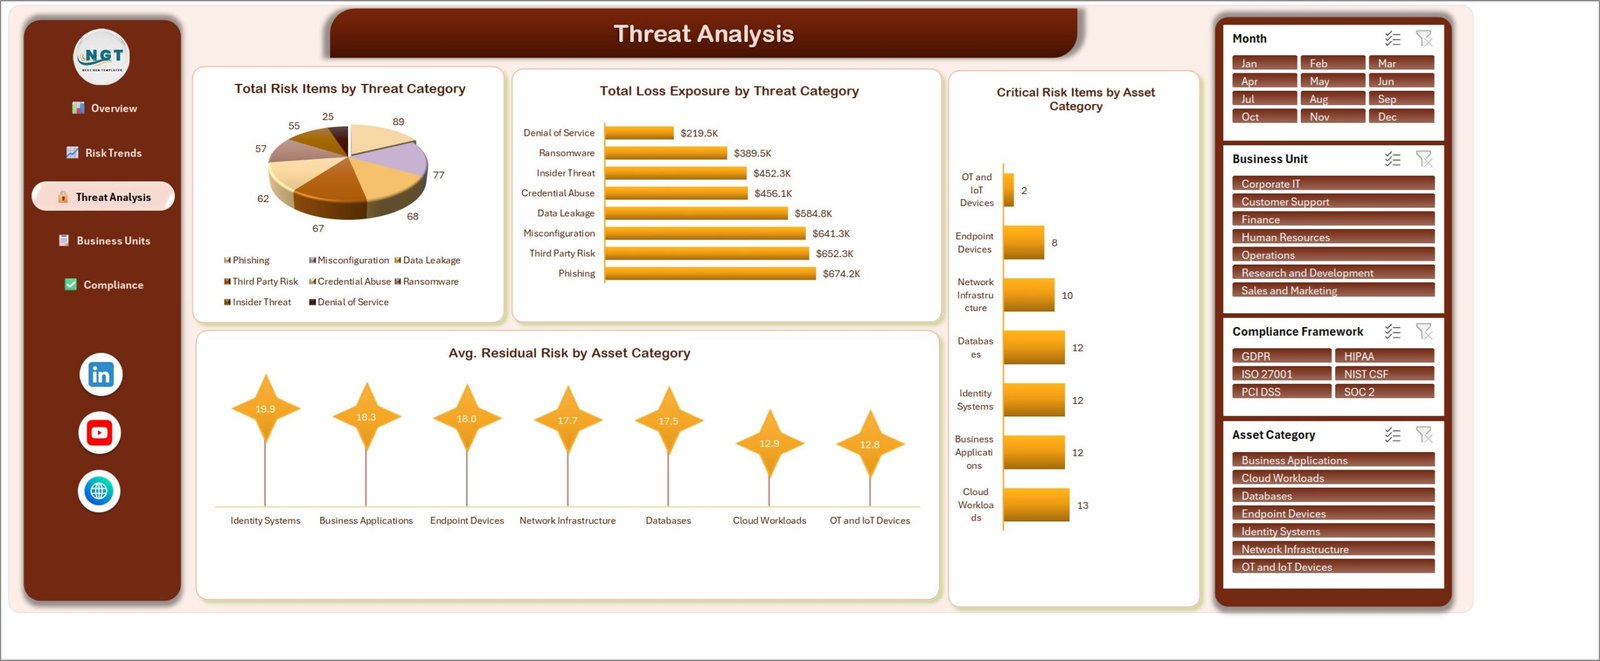
Threat Analysis holds Total Risk Items by Threat Category, Total Loss Exposure by Threat Category, Critical Risk Items by Asset Category and Avg. Residual Risk by Asset Category. Phishing carries the largest exposure in the sample at $674.2K, and the concentration of critical items by asset type is visible immediately.
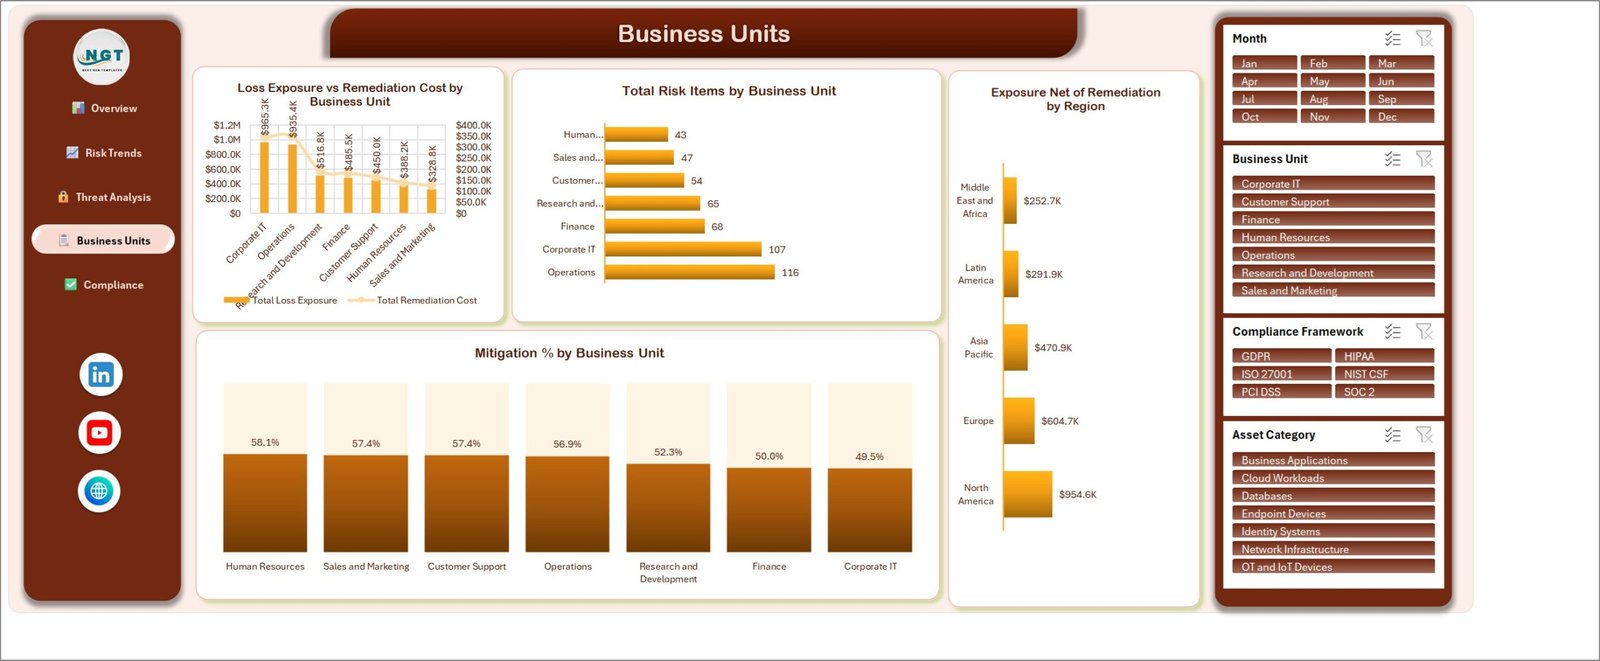
Business Units holds Loss Exposure vs Remediation Cost by Business Unit on a combo chart, Total Risk Items by Business Unit, Exposure Net of Remediation by Region across five regions, and Mitigation % by Business Unit. This is the accountability page.
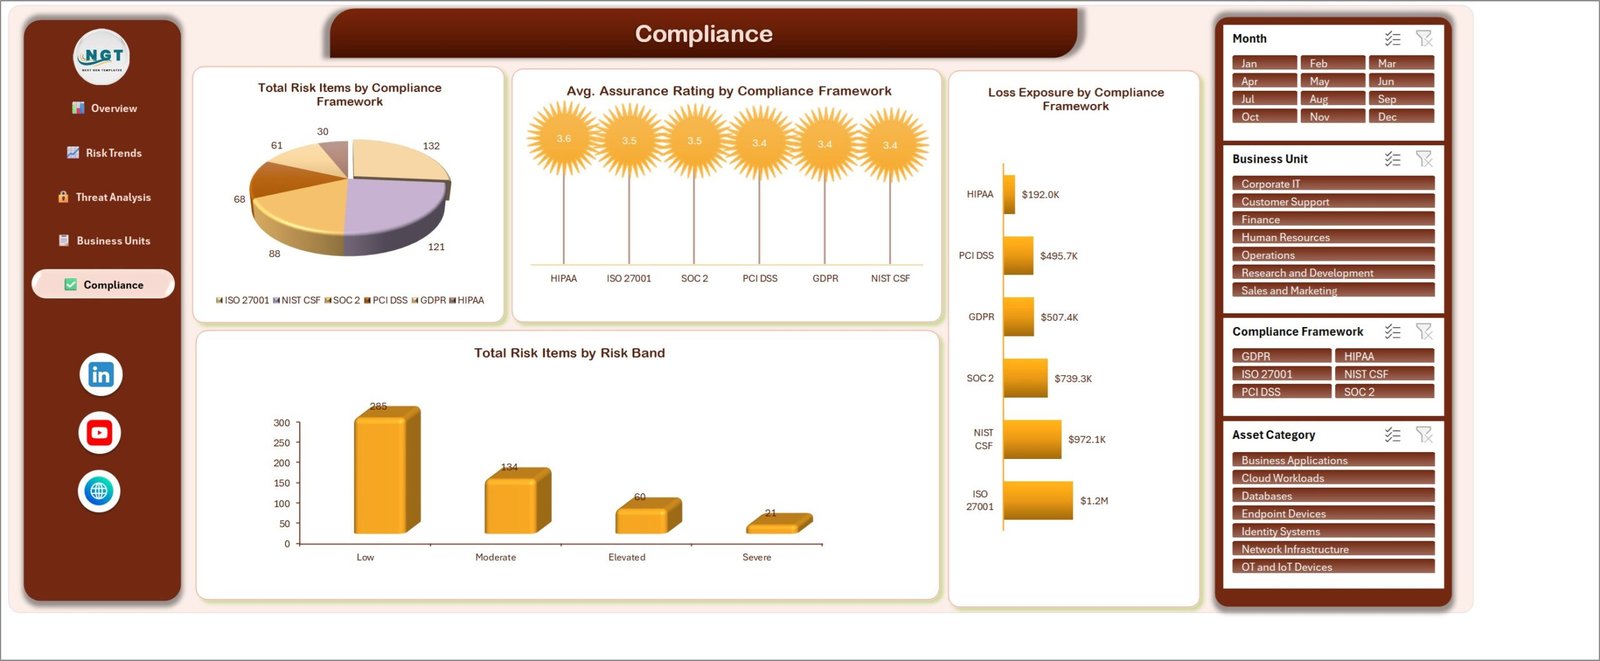
Compliance holds Total Risk Items by Compliance Framework, Avg. Assurance Rating by Compliance Framework, Loss Exposure by Compliance Framework and Total Risk Items by Risk Band (Low, Moderate, Elevated, Severe). Use it to show an auditor where ISO 27001 or PCI DSS exposure actually sits.
Behind the report pages, the Data sheet holds the 500-row register and the Support sheet holds contact and tutorial links. The download is a ZIP containing the workbook plus an Excel Dashboard user manual PDF.
Cyber Risk Management Dashboard in Excel vs. Google Sheets vs. Paid GRC SaaS – Where This Fits
| This Excel dashboard | Google Sheets build | Paid GRC platform | |
|---|---|---|---|
| Cost | $17.99 one time | Free tool, your build time | $15,000+ per year at entry tier |
| Platform | Excel 2016+, Microsoft 365, Mac | Browser | Vendor cloud |
| Setup time | Under 30 minutes | 2-3 days to rebuild the same charts | 6-12 weeks implementation |
| Real-time team collaboration | Through OneDrive or SharePoint co-authoring | Yes, native | Yes, native |
| Mobile access | Excel mobile app, view and light edit | Yes | Yes |
| Customisable fields | Any column you add to the Data sheet | Yes | Configurable, often chargeable |
| Share with a link | Yes, through OneDrive | Yes | Named-seat licensing |
| Year-1 cost at 5 users | $17.99 | $0 plus build labour | $15,000 – $60,000 |
| Framework view (GDPR, HIPAA, ISO 27001, NIST CSF, PCI DSS, SOC 2) | Built in on the Compliance page | Build it yourself | Built in |
| Register data leaves your network | No, the file stays with you | Google servers | Vendor servers |
Who This Template Is For – and Who It Is Not For
It is for IT risk managers, CISOs and security leads whose risk register already lives in a spreadsheet; internal audit and GRC analysts who need a board pack in an afternoon; MSPs and vCISO consultants reporting to several clients; and ISO 27001 or SOC 2 programme owners preparing evidence reviews.
It is not for you if you need automated ingestion from a SIEM or a vulnerability scanner – this reads a register you maintain, it does not connect to Qualys or Splunk. It is not a ticketing system, so remediation work still lives in Jira or ServiceNow. It has no user permissions or field-level audit trail, so if your regulator demands change history you need a real GRC platform. And it is not a live threat feed: it reports on assessments, not on alerts.
How to Use the Cyber Risk Management Dashboard in Excel
- Unzip the download and open the workbook in Microsoft Excel. There is nothing to enable, because there are no macros.
- Walk the five pages with the sample data first so you can see what each chart measures.
- Open the Data sheet and replace the 500 sample rows with your own register, keeping the column headers exactly as they are.
- Keep the category values consistent – Severity as Critical, High, Medium or Low, and Status as Open, Accepted, Monitoring, In Remediation or Mitigated – so the slicers and charts stay clean.
- Press Ctrl+Alt+F5, or use Data then Refresh All, to rebuild every PivotTable and chart.
- Use the Month, Business Unit, Compliance Framework and Asset Category slicers to cut the pack for one audience, then export the page to PDF for the board.
Real-World Use Cases
Priya, IT risk manager at a 900-person fintech. Her quarterly risk committee wanted exposure by framework, not a 500-row table. She now filters to PCI DSS and SOC 2 on the Compliance page and takes two charts to the meeting instead of rebuilding a deck.
Daniel, a vCISO serving six SME clients. He keeps one copy of the workbook per client, pastes each register in, and delivers an identical five-page pack every month – a repeatable deliverable he can price.
Aisha, internal audit lead at a hospital group. She uses the Business Units page to show where remediation spend is not tracking loss exposure, which turned a budget argument into a one-chart conversation.
Frequently Asked Questions
Does this dashboard need macros or an add-in?
No. It is a standard .xlsx workbook built on PivotTables, slicers and native Excel charts. Nothing to enable and nothing to install.
Which Excel versions does it work in?
Excel 2016 and later, Microsoft 365 on Windows, and Excel for Mac. Slicers need a desktop version – Excel for the web will display the pages, but slicer behaviour there is limited.
Can I add my own threat or asset categories?
Yes. Type the new value into the Data sheet and refresh. The slicers and charts pick it up automatically, because nothing is hard-coded.
How many risk records can it hold?
It ships with 500 rows and comfortably handles several thousand. Past roughly 50,000 rows you will feel the refresh, and Power BI becomes the better home.
Is my risk data sent anywhere?
No. The workbook has no external connections. Your register stays in the file, on your machine or in your own OneDrive tenant.
Is this the same as your Cyber Risk Management KPI Dashboard?
No. That product is a month-picker KPI scorecard with traffic lights. This is the analytical dashboard: five pages of slicer-driven charts over a full risk register. They complement each other rather than overlap.
Can I rebrand it for a client?
Yes. Colours, the logo panel and the page titles are all editable. Reselling the file itself is not permitted.
About the Author
Built by PK – Microsoft Certified Professional with 15+ years of Excel, Google Sheets, and Power BI experience. Founder of NextGenTemplates, reaching 300K+ subscribers across YouTube channels. Every template is hand-built and tested before release.
Explore Related Templates
- Cybersecurity Operations Center Dashboard in Excel – the SOC-side view: incidents, alerts, detection and containment.
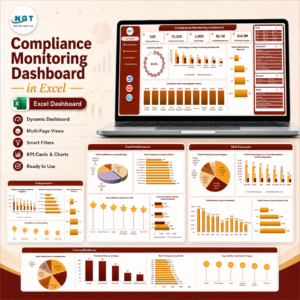
- Compliance Monitoring Dashboard in Excel – control testing and audit findings tracked over time.
- Data Privacy Office Dashboard in Excel – DSARs, breach logs and privacy programme reporting.
- Risk Assessment Firms Dashboard in Excel – engagement-level risk reporting for consultancies.
- IT and Cybersecurity Operations Bundle – eight Excel and Power BI templates at a bundle price.
- Browse more in Excel Dashboards and Excel IT Templates.
Prefer to read the full walkthrough first? See Cyber Risk Management Dashboard in Excel on the blog.
Get the Cyber Risk Management Dashboard in Excel for $17.99 (regular $29.99) – instant download, one-time payment, lifetime use, and free updates to this template. Add it to your cart and you can be reporting on your own register within the hour.
Last updated: 26 August 2026.





















Reviews
There are no reviews yet.