The jewellery and watches industry demands elegance, precision, and high customer trust. Every day, retailers deal with complex product categories, premium pricing, gemstones, collections, and store-level variations. Without the right insights, brands struggle with scattered spreadsheets, delayed reporting, and slow decision-making. The Jewellery & Watches Dashboard in Power BI solves these challenges by bringing every important metric into one powerful visual platform 💎📊.
With this dashboard, retail leaders, analysts, and store managers get real-time visibility into sales, collections, gemstones, stores, and performance trends. Power BI converts raw data into meaningful charts, slicers, and KPI cards so teams can take faster, smarter, and more confident decisions.
💠 Key Features of the Jewellery & Watches Dashboard in Power BI
This dashboard includes five well-structured pages designed to offer complete, clear, and actionable insights.
💎 1. Overview Page — Your Complete Business Summary
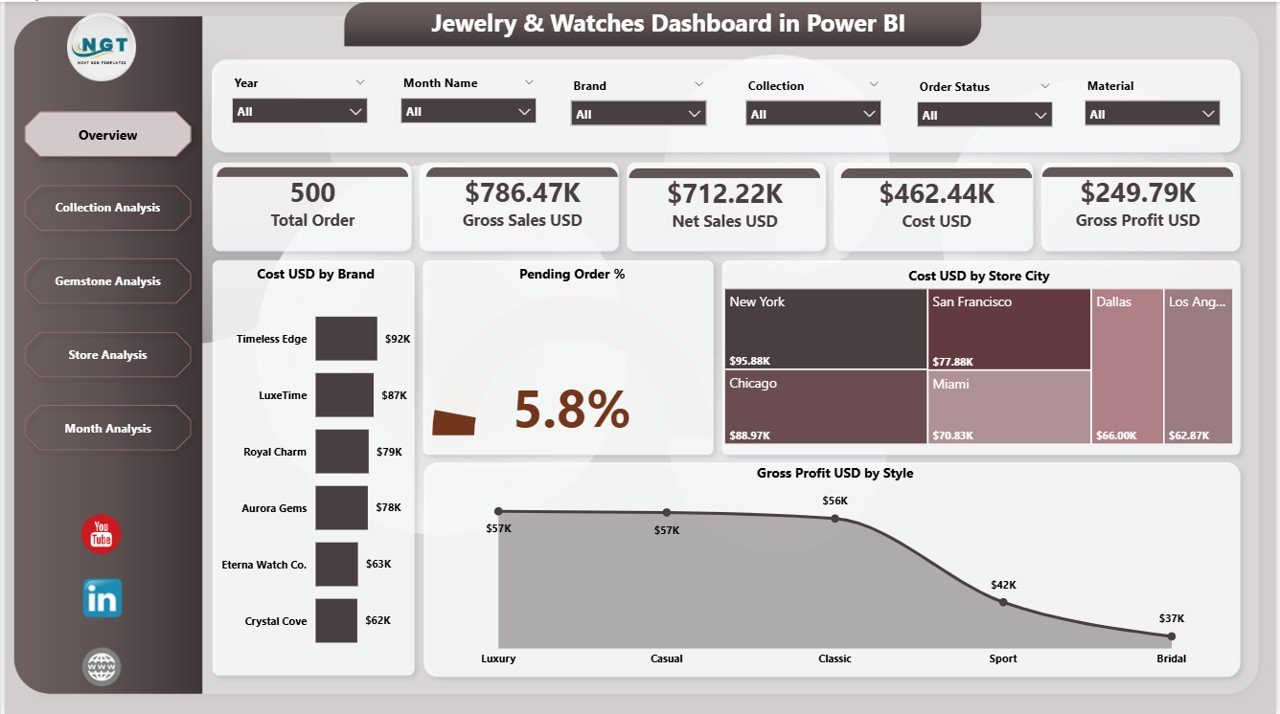
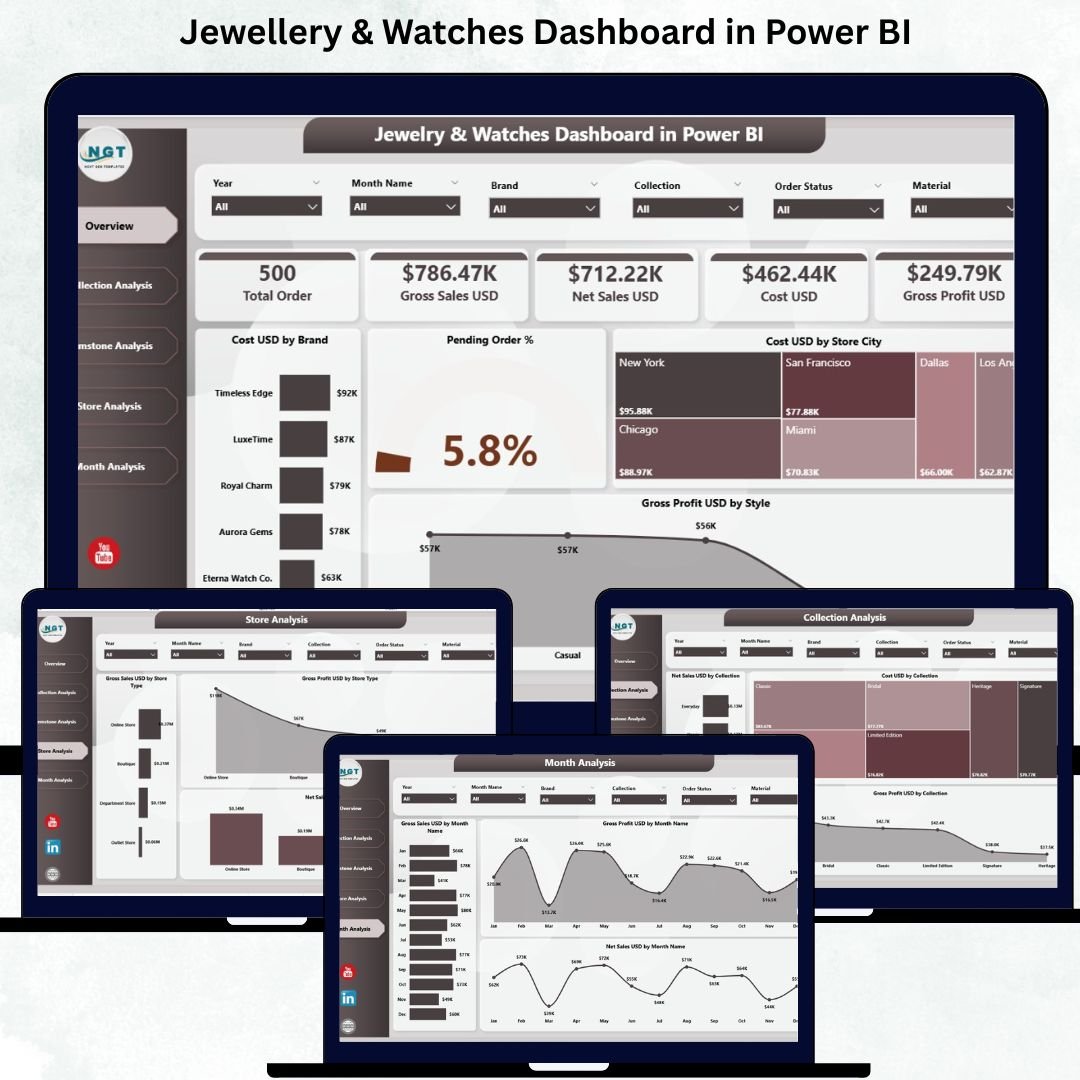
The Overview Page works as the main control center of the dashboard. It provides instant insights using:
✔️ Smart Slicers
Filter data by:
Brand
Collection
Gemstone
Store City
Month
The slicers update the visuals instantly, ensuring a personalized view.
✔️ 4 KPI Cards
The dashboard highlights high-value KPIs such as:
Total Cost (USD)
Total Pending Orders (%)
Gross Profit (USD)
Other performance KPIs
✔️ Insightful Charts
Cost (USD) by Brand – Reveals cost contribution by brand.
Pending Order % – Tracks unfulfilled orders.
Cost (USD) by Store City – Shows city-wise cost performance.
Gross Profit (USD) by Style – Identifies most profitable jewellery styles.
This page gives leadership a complete picture of business performance within seconds.
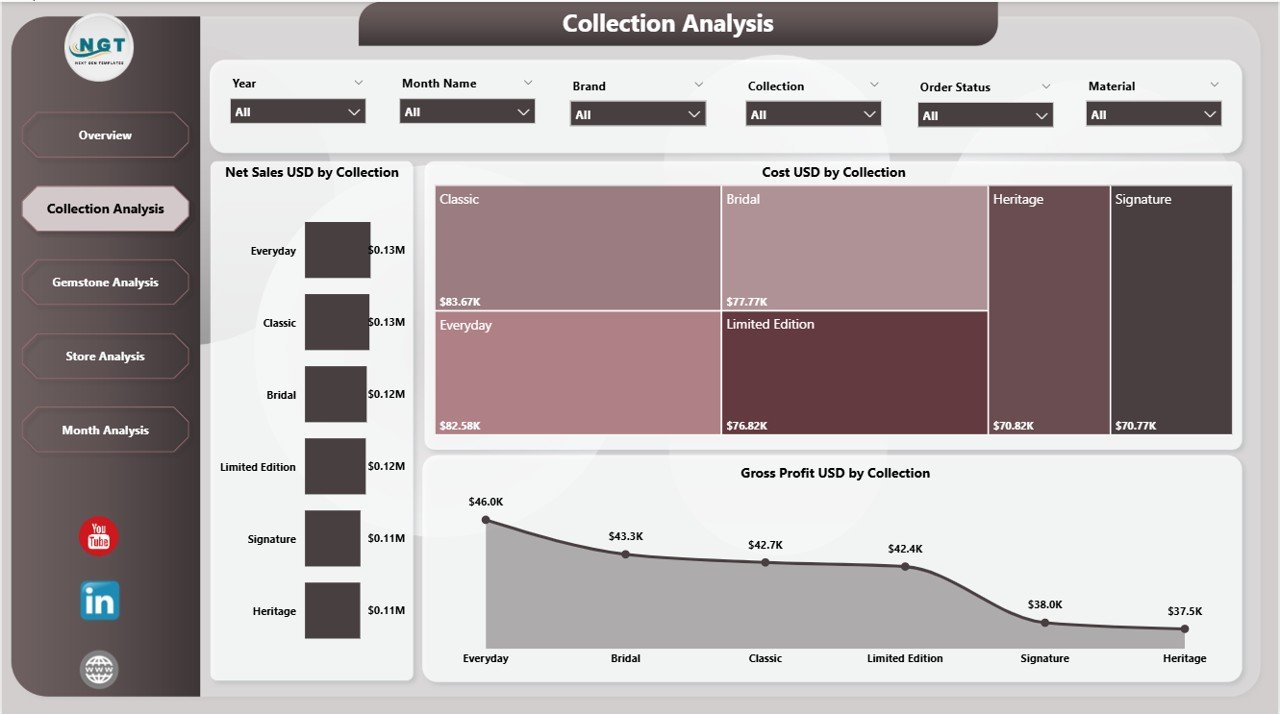
👑 2. Collection Analysis — Understand Your Best-Performing Collections
Luxury brands rely heavily on collections such as Premium, Bridal, Classic, Diamond, Gold, and Limited Edition. This page shows how each collection ranks in the market.
✔️ Charts in Collection Analysis
Net Sales (USD) by Collection
Cost (USD) by Collection
Gross Profit (USD) by Collection
This page helps you refine pricing, plan promotions, and understand customer buying behaviour across styles.
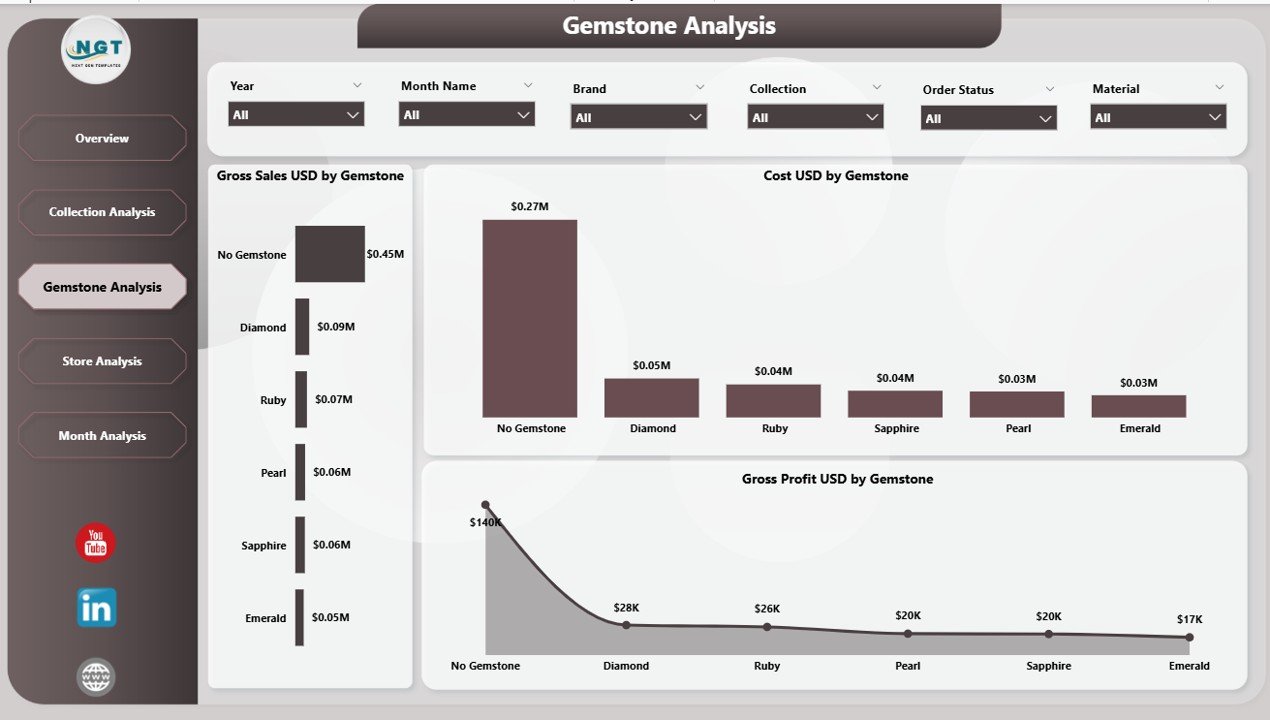
💎 3. Gemstone Analysis — Deep Insights Into Stone Performance
Gemstones like diamonds, rubies, pearls, emeralds, and sapphires generate different levels of demand and profit.
✔️ Charts on This Page
Cost (USD) by Gemstone – Helps optimize stone purchasing.
Gross Profit (USD) by Gemstone – Highlights high-margin stones.
Gross Sales (USD) by Gemstone – Reveals best-selling gemstones.
This page helps your business plan inventory smarter and negotiate better with suppliers.
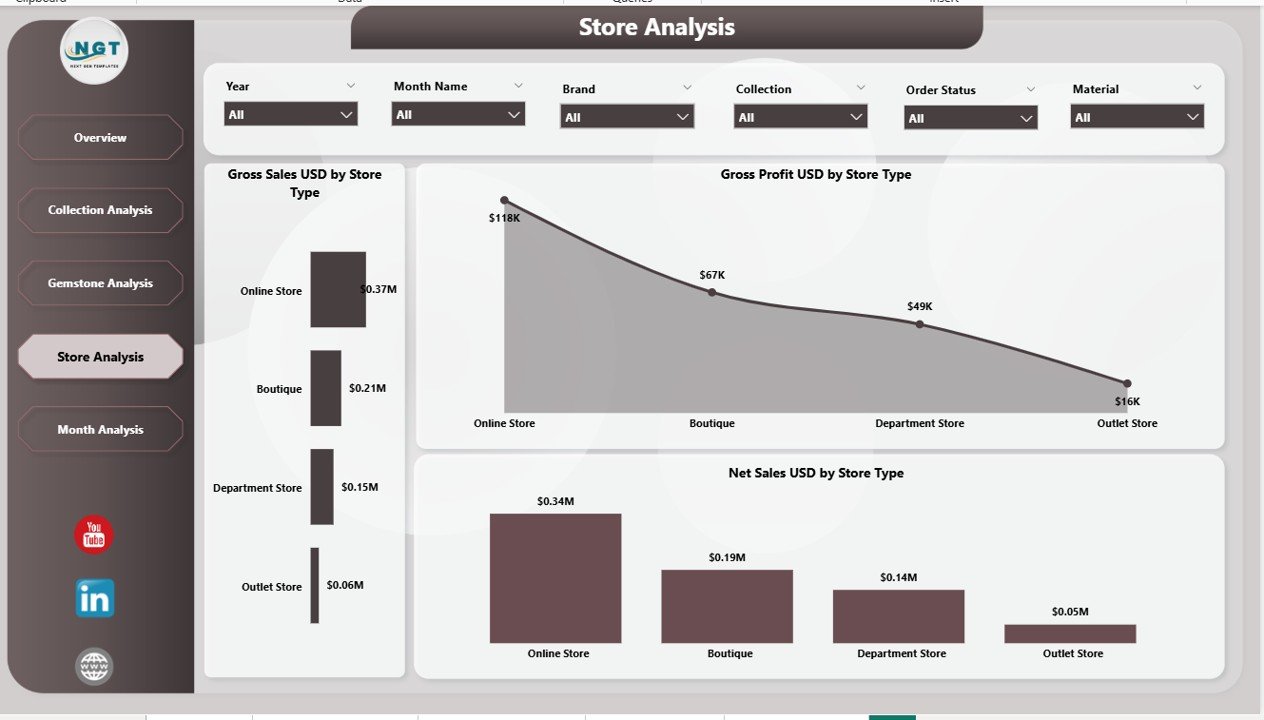
🏬 4. Store Analysis — Compare Performance Across Cities
Each store shows unique customer behaviour. The Store Analysis page helps identify:
High-performing cities
Underperforming stores
Stores with strong gemstone sales
Locations requiring stock or staffing improvements
✔️ Key Store-Level Charts
Net Sales (USD) by Stone Type
Gross Profit (USD) by Stone Type
Gross Sales (USD) by Stone Type
This allows you to evaluate every store with precision.
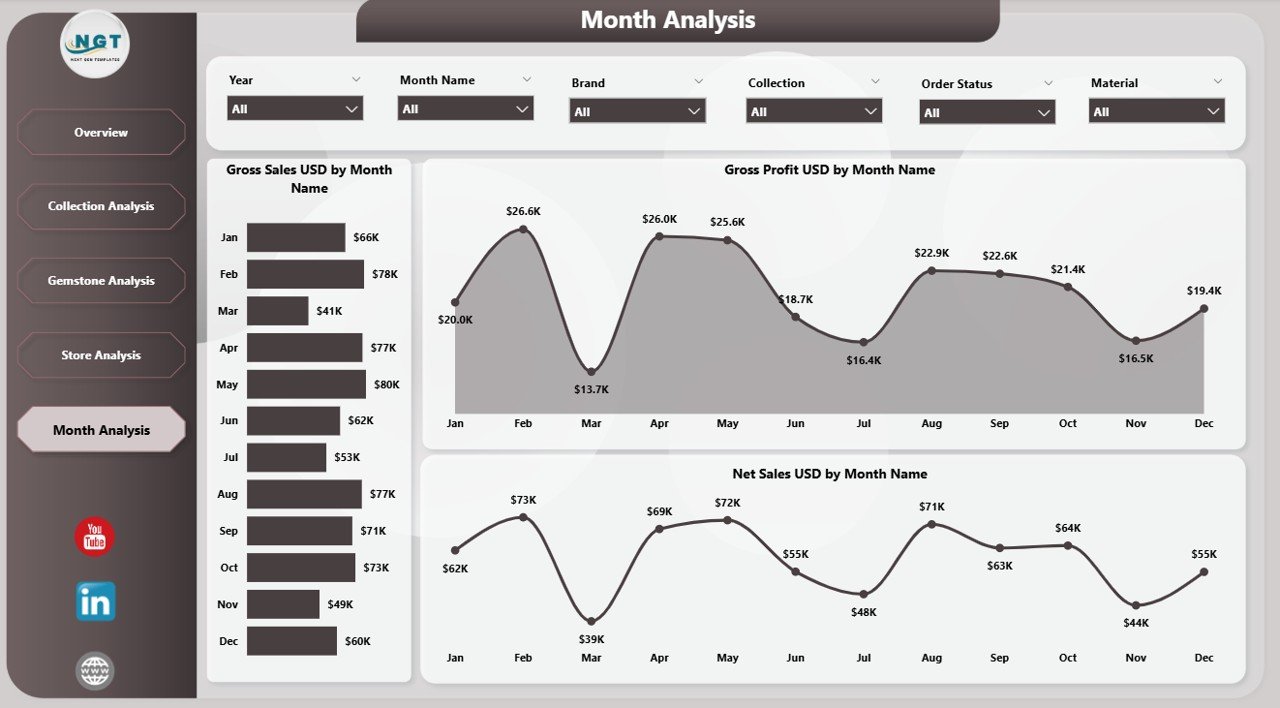
📅 5. Monthly Trends — Track Yearly Growth & Seasonal Performance
Jewellery and watches peak during festivals, wedding seasons, and holidays. This page reveals those patterns.
✔️ Charts on Monthly Trends
Net Sales (USD) by Month
Gross Profit (USD) by Month
Gross Sales (USD) by Month
These charts help teams plan events, promotions, and year-end strategies.
⚡ How Power BI Enhances Jewellery & Watch Reporting
Power BI offers speed, clarity, and automation. Its benefits include:
Instant data refresh
Drill-down capabilities
Clear visuals
Large dataset support
Interactive filters
Easy sharing with teams
This creates a strong data-driven culture across the brand.
🌟 Advantages of the Jewellery & Watches Dashboard
Faster decision-making
Strong visibility across brands & stores
Better cost and margin control
Improved inventory & gemstone planning
Accurate seasonal insights
Reduced reporting time
Better supplier negotiations
Better customer experience through product insights
🛠️ Best Practices for Using the Dashboard
Keep data updated and error-free
Use slicers for deeper insights
Track cost, gross sales, and gross profit regularly
Compare results month-to-month
Analyze store and gemstone trends frequently
Monitor high-potential collections
Share dashboard with teams for continuous improvement
🔚 Conclusion
The Jewellery & Watches Dashboard in Power BI transforms complex retail reporting into clean, meaningful insights. Whether you want to analyze gemstones, collections, stores, brands, or monthly trends, this dashboard gives precise and powerful information. When used consistently, it helps brands improve sales, control cost, optimize inventory, and build a more profitable business.
🔗 Click here to read the Detailed blog post
Visit our YouTube channel to learn step-by-step video tutorials