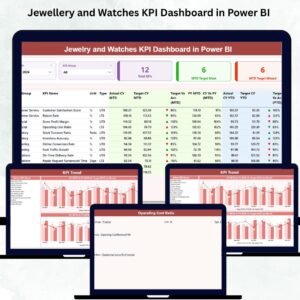

The Watches and Timepieces KPI Dashboard industry operates with precision ⌚📊. Trends shift every season. Luxury demand rises during festive and wedding periods. Smartwatch sales spike during technology launches. Meanwhile, inventory costs grow the moment stock sits unsold for too long.
Therefore, tracking KPI performance is not optional — it is critical.
However, many watch brands, distributors, and retailers still rely on scattered Excel files. As a result, managers spend hours preparing reports. They miss early warning signals. They fail to compare targets with actual performance in real time.
That is exactly why the Watches and Timepieces KPI Dashboard in Power BI becomes a game-changing solution.
This ready-to-use dashboard connects structured Excel data to Power BI and transforms raw KPI numbers into powerful interactive visuals. Instead of juggling multiple reports, you can track monthly performance, year-to-date results, target achievement, previous year comparison, and KPI trends — all in one centralized system.
Because it uses Power BI, you get dynamic slicers, drill-through analysis, visual indicators (▲ / ▼), combo trend charts, and automated calculations — without complex manual work.
If you want clarity, control, and confident decision-making in your watch business, this dashboard is built for you.
🔑 Key Features of Watches and Timepieces KPI Dashboard in Power BI
📊 3 Powerful Dashboard Pages
Structured layout for summary, trends, and KPI documentation.
📅 MTD & YTD Tracking
Monitor month-to-date and year-to-date performance instantly.
🎯 Target vs Actual Comparison
Identify performance gaps using percentage calculations.
📈 Previous Year (PY) Benchmarking
Track year-on-year growth clearly.
🔄 Interactive Slicers
Filter by Month and KPI Group dynamically.
📉 Visual Performance Indicators
Green ▲ for achieved targets, Red ▼ for missed targets.
📚 Drill-Through KPI Definition Page
Access KPI formula, definition, unit, and type instantly.
⚙️ Excel-Based Data Structure
Simple backend maintenance without complex systems.
📦 What’s Inside the Watches and Timepieces KPI Dashboard in Power BI
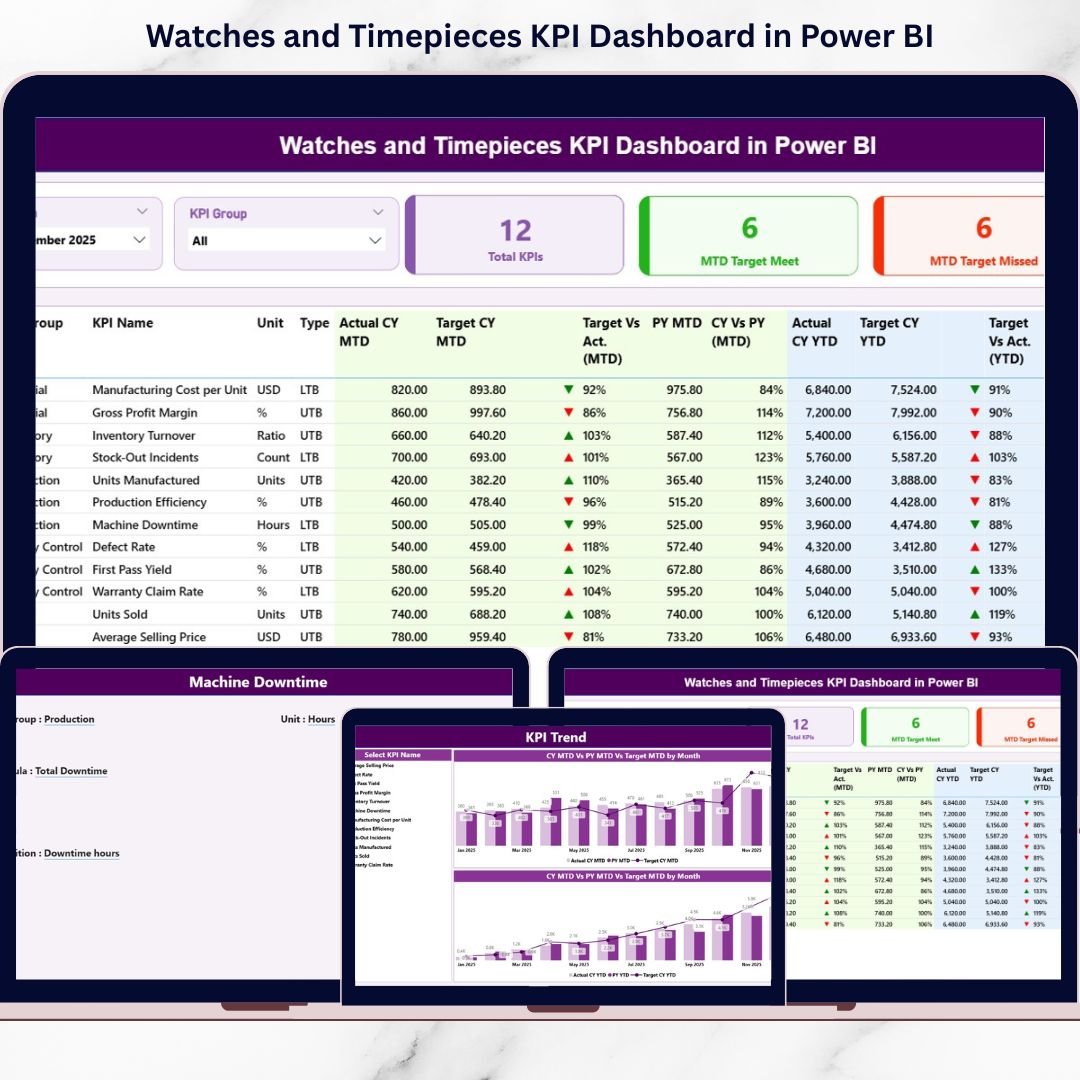
This dashboard contains 3 structured pages designed for complete performance visibility.
1️⃣ Summary Page – The Control Center
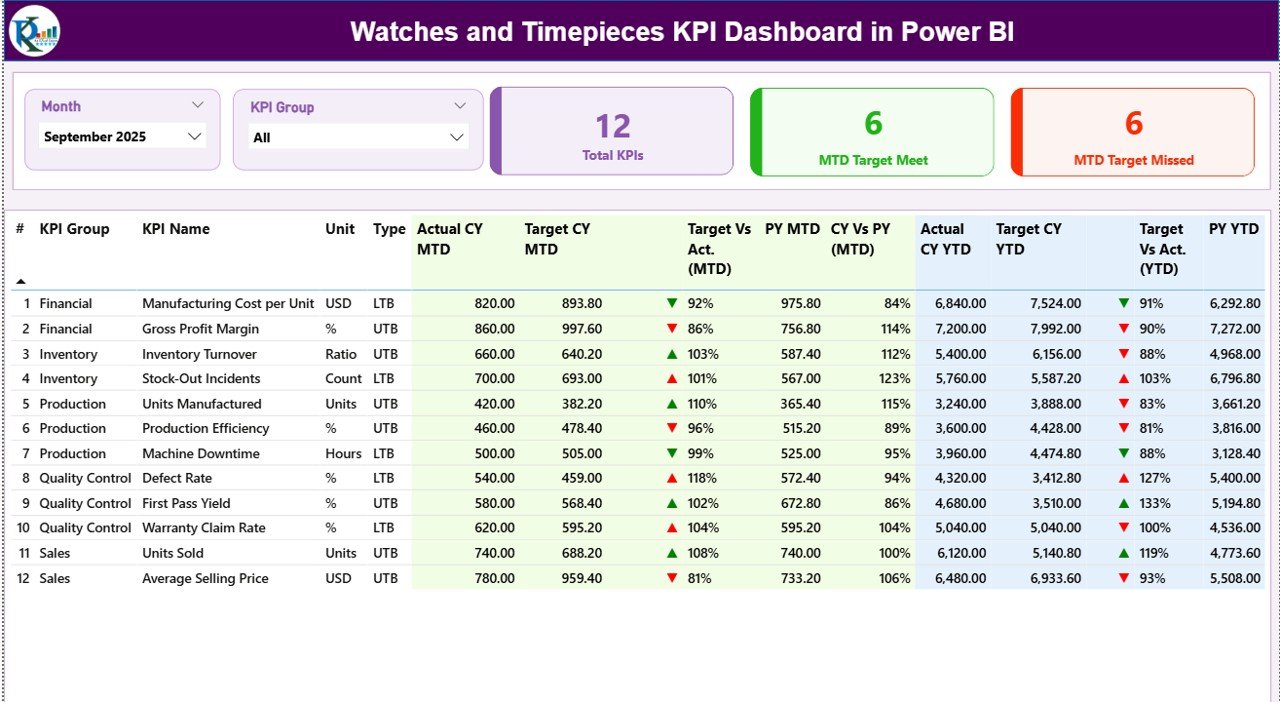
This is the heart of the dashboard.
🔹 Top Slicers
Month Slicer
KPI Group Slicer
These allow instant filtering.
🔹 KPI Cards
Total KPIs Count
MTD Target Meet Count
MTD Target Missed Count
You instantly know how many KPIs are performing well.
🔹 Detailed KPI Performance Table
Includes:
KPI Number
KPI Group (Sales, Inventory, Finance, Production, Customer)
KPI Name
Unit
Type (UTB / LTB)
MTD Section:
Actual CY MTD
Target CY MTD
▲ / ▼ Status Icon
Target vs Actual %
PY MTD
CY vs PY %
YTD Section:
Actual CY YTD
Target CY YTD
▲ / ▼ Status Icon
Target vs Actual %
PY YTD
CY vs PY %
Therefore, managers see short-term and long-term performance instantly.
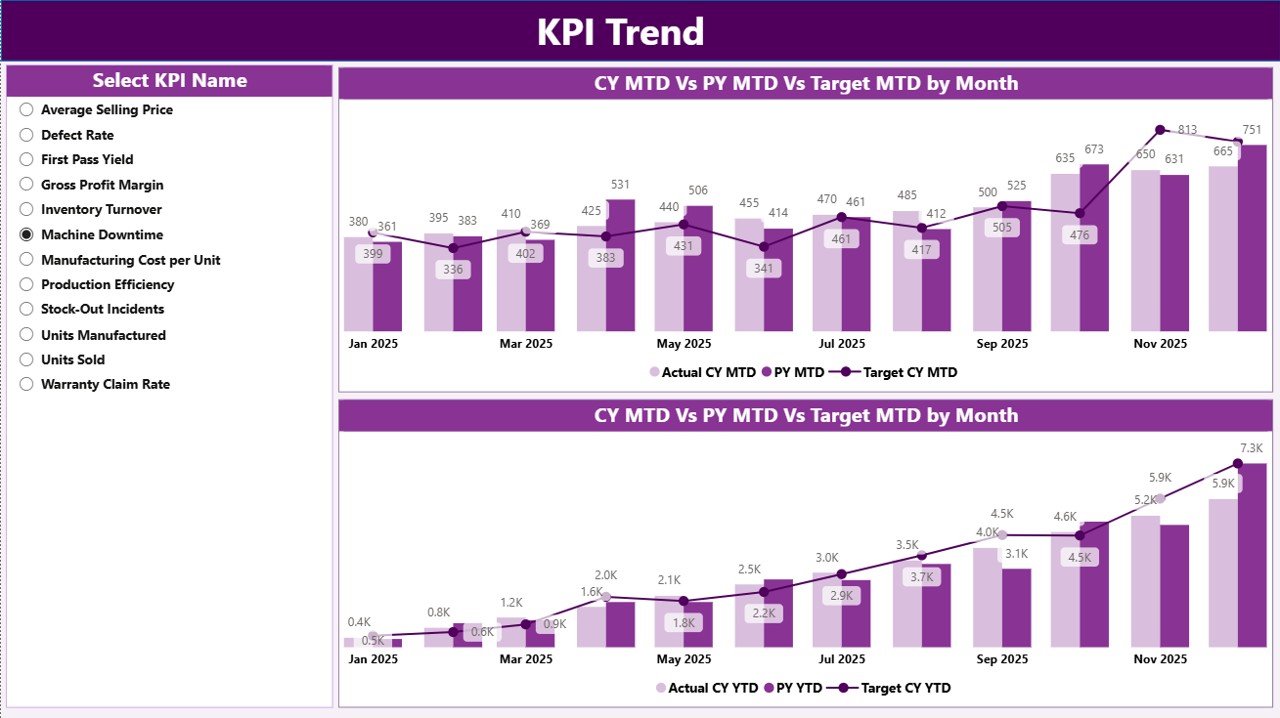
2️⃣ KPI Trend Page – Performance Over Time
This page focuses on trend visualization.
🔹 KPI Name Slicer
Select any KPI for deep analysis.
🔹 MTD Combo Chart
Shows:
Current Year Actual
Previous Year Actual
Target
🔹 YTD Combo Chart
Shows:
Current Year YTD
Previous Year YTD
Target
This page helps you detect:
✔ Seasonal demand shifts
✔ Declining inventory turnover
✔ Margin fluctuations
✔ Growth consistency
Instead of static numbers, you see performance movement clearly.
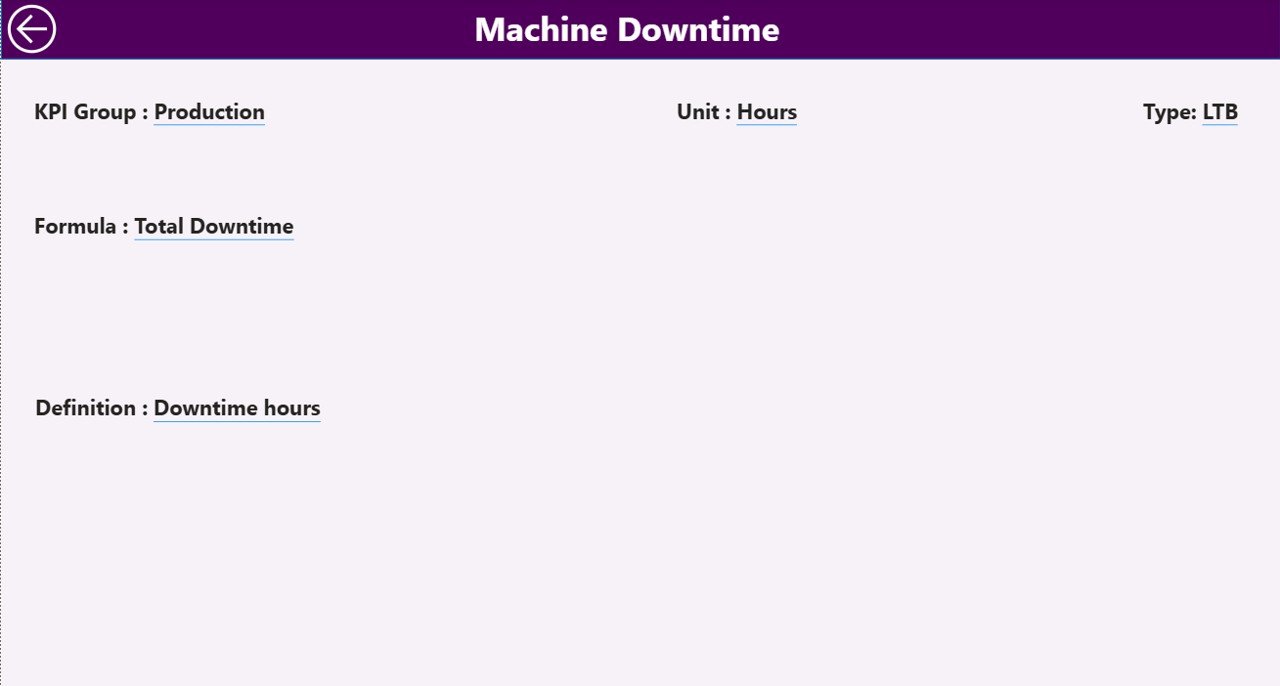
3️⃣ KPI Definition Page – Drill-Through Intelligence
From the Summary page, you can drill through to this page.
It displays:
KPI Number
KPI Name
KPI Group
Unit
Formula
Definition
Type (LTB / UTB)
This ensures complete transparency and accountability across teams.
🛠️ How to Use the Watches and Timepieces KPI Dashboard in Power BI
1️⃣ Maintain Excel data in structured format
2️⃣ Fill Input_Actual sheet (MTD & YTD values)
3️⃣ Fill Input_Target sheet
4️⃣ Maintain KPI Definition sheet
5️⃣ Refresh Power BI dashboard
6️⃣ Use Month and KPI Group slicers
7️⃣ Review Summary page
8️⃣ Analyze Trend page
9️⃣ Drill through to KPI definitions if needed
Within minutes, you get complete KPI visibility.
👥 Who Can Benefit from This Dashboard?
⌚ Watch Manufacturers
💎 Luxury Watch Brands
📱 Smartwatch Companies
🏬 Distributors & Wholesalers
🛒 Retail Chains
📊 Finance & Sales Managers
Whether you manage premium watches or mass-market models, this dashboard adapts to your needs.
🚀 Why Choose Power BI for Watch KPI Tracking?
✔ Interactive visuals
✔ Drill-through capability
✔ Real-time refresh
✔ Automated KPI calculations
✔ Clean professional layout
✔ Scalable for multi-year data
Unlike manual Excel reporting, Power BI provides structured analytics and dynamic filtering.
📈 How This Dashboard Improves Profitability
When you track:
Inventory Turnover
Stock Ageing
Profit Margin %
Sales Growth %
Production Rejection Rate
Customer Return Rate
You:
✔ Detect weak segments early
✔ Improve pricing strategy
✔ Reduce stock holding cost
✔ Increase margin consistency
✔ Strengthen growth planning
Data-driven decisions directly improve margins.
🧠 Best Practices for Implementation
✔ Keep Excel data clean
✔ Use consistent KPI naming
✔ Classify LTB / UTB correctly
✔ Update data monthly
✔ Review trend page regularly
✔ Set realistic targets
✔ Conduct monthly KPI review meetings
Consistent review leads to continuous improvement.
### Click here to read the Detailed blog post
🔗 Visit our YouTube channel to learn step-by-step video tutorials
👉 https://youtube.com/@PKAnExcelExpert
Watch the step-by-step video tutorial:
Compatibility and Requirements
- Works in Power BI Desktop, which is free to download. Microsoft explains the download in Get Power BI Desktop.
- The data sits in an Excel file with an Input_Actual sheet, an Input_Target sheet and a KPI Definition sheet. You refresh the dashboard after you update that file.
Frequently Asked Questions
How many pages does the dashboard have?
Three pages: Summary, KPI Trend and KPI Definition.
Which KPI groups does it cover?
The Summary page groups KPIs into Sales, Inventory, Finance, Production and Customer. You filter them with the KPI Group slicer, and the Month slicer sets the reporting month.
Where do I enter my numbers?
Enter actual MTD and YTD values in the Input_Actual sheet and your goals in the Input_Target sheet. Keep the KPI names and definitions in the KPI Definition sheet, then refresh the dashboard in Power BI.
How do I see if a KPI met its target?
Each KPI row shows a green ▲ when the target is met and a red ▼ when it is missed, for both MTD and YTD. The row also shows Target vs Actual % and CY vs PY %.
Is there an Excel version?
Yes. See the Watches and Timepieces KPI Dashboard in Excel.
Related Watch and Retail KPI Templates
- Watches and Timepieces KPI Dashboard in Excel: the same KPIs in Excel
- Jewellery and Watches KPI Dashboard in Power BI: a similar Power BI dashboard for watch and jewellery sellers
- Jewellery & Watches Dashboard in Power BI: another Power BI view for the same industry
- Jewellery and Watches KPI Dashboard in Excel: the Excel edition for jewellery and watches
- Power BI Dashboard Mega Collection: 15 Power BI templates in one download
Browse all Power BI KPI dashboards.