

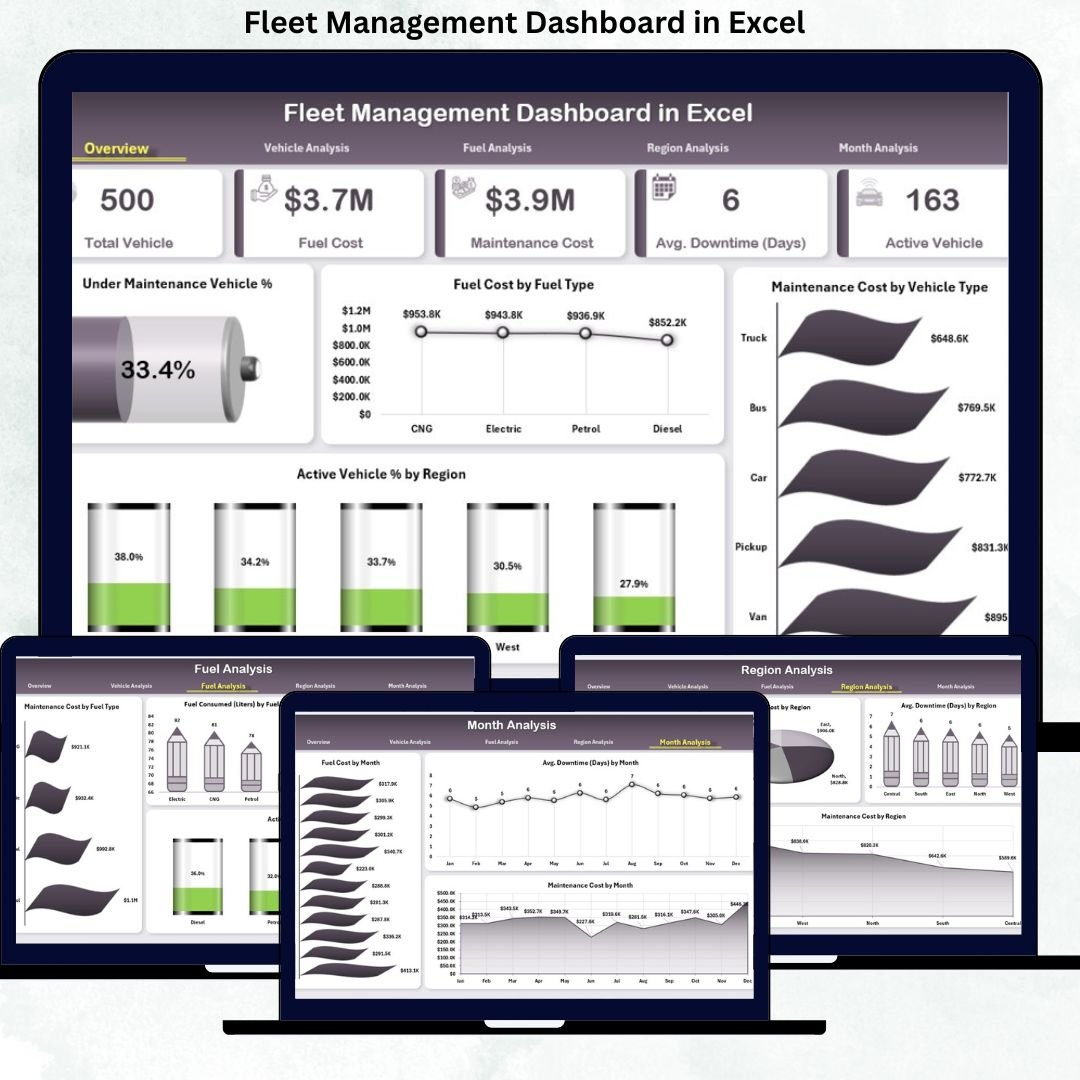



Fleet Management Dashboard are no longer just about tracking vehicles. Today, organizations must control fuel costs, maintenance expenses, vehicle availability, downtime, and regional performance—all at once. When data lives in scattered spreadsheets or manual reports, costs rise silently and decisions arrive too late.
That is exactly why the Fleet Management Dashboard in Excel becomes an essential control panel for modern fleet operations.
This ready-to-use, interactive Excel dashboard converts raw fleet data into clear KPIs, visual insights, and actionable trends—all within a single Excel file. Instead of chasing numbers across multiple sheets, fleet managers gain a centralized, real-time view of performance across vehicles, fuel types, regions, and months.
Built entirely in Excel, this dashboard remains easy to update, simple to customize, and cost-effective. As a result, organizations reduce operating costs, improve vehicle availability, and move from reactive firefighting to proactive fleet management.
🔑 Key Features of Fleet Management Dashboard in Excel
🚀 Centralized Fleet Performance View
Monitor fuel usage, maintenance cost, downtime, and vehicle activity from one dashboard.
⛽ Fuel Cost & Consumption Tracking
Analyze fuel cost and fuel consumed by vehicle type, fuel type, region, and month.
🛠️ Maintenance Cost Monitoring
Identify vehicles and regions driving higher maintenance expenses.
📉 Downtime & Availability Insights
Track under-maintenance vehicles and active vs inactive vehicle percentages.
🌍 Region-Wise Performance Analysis
Compare fuel usage, costs, and downtime across different regions.
📅 Monthly Trend Analysis
Identify seasonal cost spikes and long-term performance patterns.
🧭 Page Navigator for Easy Navigation
Quickly jump between dashboard pages without scrolling or confusion.
⚡ Fully Excel-Based Solution
No macros required. Easy updates with familiar Excel functionality.
📂 What’s Inside the Fleet Management Dashboard in Excel
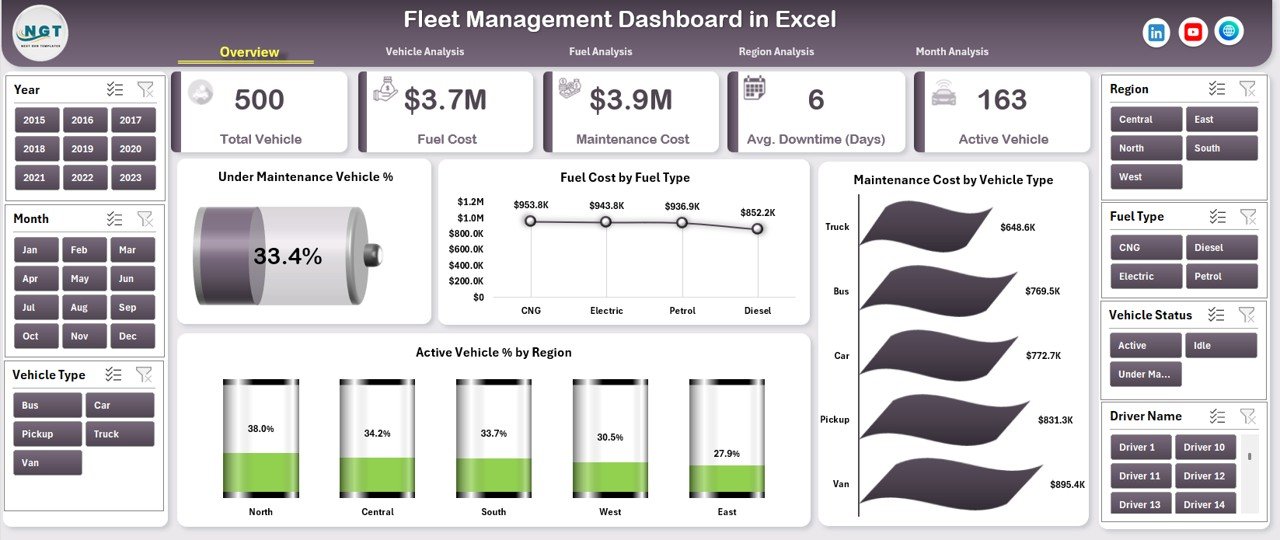
📁 Overview Page – High-level snapshot with KPI cards and key charts
📁 Vehicle Analysis Page – Performance comparison by vehicle type
📁 Fuel Analysis Page – Cost and efficiency analysis by fuel type
📁 Region Analysis Page – Regional fleet performance insights
📁 Month Analysis Page – Time-based trends for fuel, maintenance, and downtime
📊 Supporting Sheets
• Data Sheet – Central source for all fleet data
• Support Sheet – Backend calculations and helper tables
Together, these components deliver a complete, structured fleet analytics system.
🛠️ How to Use the Fleet Management Dashboard in Excel
1️⃣ Enter or update fleet data in the Data Sheet
2️⃣ Dashboard charts and KPIs update automatically
3️⃣ Use slicers to filter by vehicle type, fuel type, region, or month
4️⃣ Review KPI cards for quick status checks
5️⃣ Analyze charts to identify cost leaks and inefficiencies
6️⃣ Use trend pages for planning and forecasting
No advanced Excel skills are required. The dashboard is designed for fast adoption and daily use.
👥 Who Can Benefit from This Fleet Management Dashboard in Excel
🚚 Fleet managers
📦 Logistics and transport companies
🏗️ Construction and infrastructure firms
⚡ Utility and service providers
🏛️ Government fleet departments
🏢 Organizations managing small or large fleets
If your business depends on vehicle efficiency and cost control, this dashboard delivers immediate value.
📘 Click here to read the Detailed blog post
🎥 Visit our YouTube channel to learn step-by-step video tutorials
👉 YouTube Channel
Watch the step-by-step video tutorial:
Compatibility and Requirements
- Works in Microsoft Excel desktop (Excel 2016 or later, or Microsoft 365).
- No macros are required.
- Filter with slicers for vehicle type, fuel type, region and month. Microsoft explains slicers in Use slicers to filter data.
Frequently Asked Questions
Which pages are in the Fleet Management Dashboard?
Overview, Vehicle Analysis, Fuel Analysis, Region Analysis and Month Analysis, plus a Data sheet and a Support sheet for backend calculations.
Where do I enter fleet data?
In the Data sheet. The KPI cards and charts on every page update from it.
Can I filter the dashboard?
Yes. Slicers filter by vehicle type, fuel type, region and month, and the page navigator jumps between pages.
Does it need macros?
No. It is fully Excel-based and no macros are required.
Is there a Power BI version?
Yes. The Fleet Management Dashboard in Power BI covers the same topic in Power BI.
Related Fleet and Transport Templates
- Fleet Management Dashboard in Power BI: the Power BI edition.
- Fleet Management Dashboard in Google Sheets: a browser-based edition.
- Fleet Management KPI Dashboard in Excel: fleet KPIs against targets.
- Transportation & Logistics Dashboard in Excel: wider transport and logistics reporting.
- Logistics and Transportation Hub: 7 Excel and Power BI logistics templates.
Browse all Excel dashboard templates or the Excel logistics templates.





















Reviews
There are no reviews yet.