


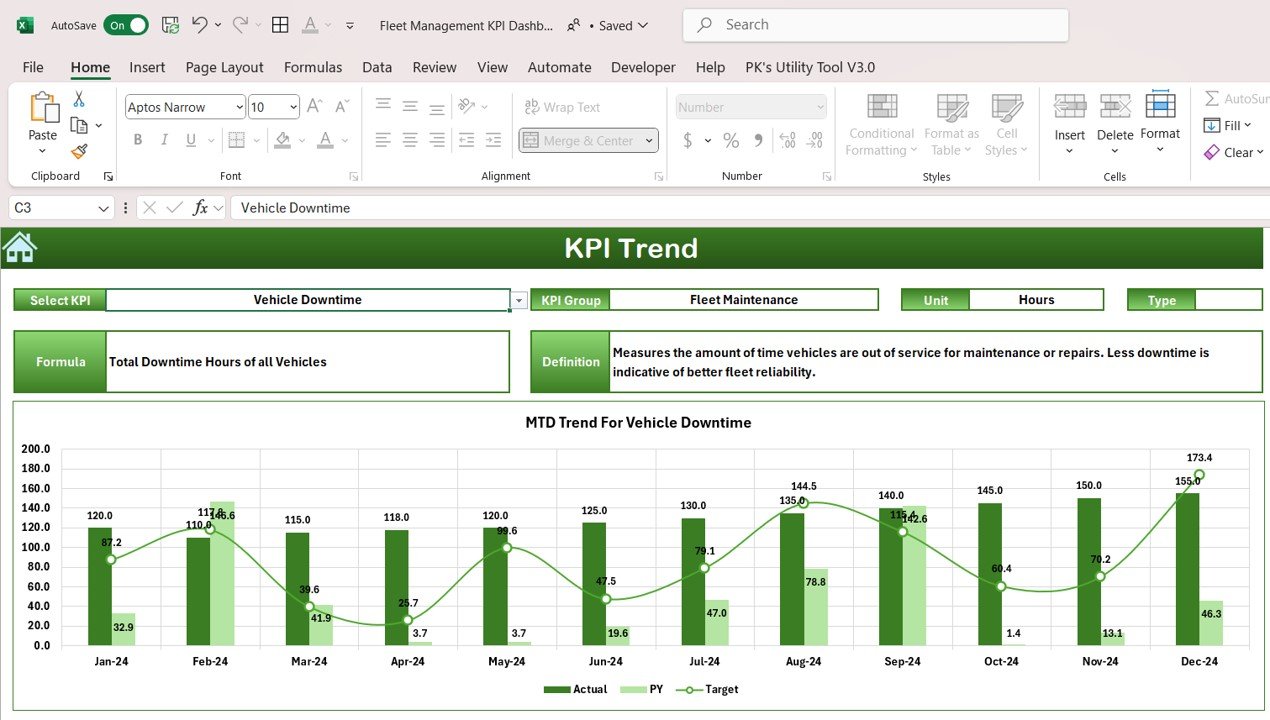



The Fleet Management KPI Dashboard in Excel is a comprehensive and interactive tool designed for fleet managers and businesses that operate a fleet of vehicles. This Excel-based dashboard allows you to track and manage key performance indicators (KPIs) related to fleet operations, including vehicle maintenance, fuel efficiency, mileage, vehicle utilization, and overall fleet costs. By using this dashboard, you can monitor the health and performance of your fleet in real-time, identify inefficiencies, and optimize fleet management to improve productivity and reduce costs.
Whether you’re managing a small fleet or a large fleet of vehicles, the Fleet Management KPI Dashboard in Excel offers an organized and customizable solution to streamline fleet operations. The dashboard provides a detailed overview of your fleet’s performance and highlights areas for improvement, enabling better decision-making and cost-effective fleet management.
Key Features of the Fleet Management KPI Dashboard in Excel
🚗 Track Vehicle Performance & Utilization
Monitor vehicle performance, including fuel efficiency, mileage, and maintenance schedules. Track the utilization rate of each vehicle to ensure that your fleet is being used optimally and to identify underutilized assets.
⚡ Fuel Efficiency & Cost Management
Track fuel consumption and fuel efficiency for each vehicle. Evaluate fuel-related costs and make adjustments to improve fuel efficiency, reduce costs, and improve the overall sustainability of your fleet.
📊 Maintenance & Repair Tracking
Monitor scheduled and unscheduled maintenance and repair costs. Keep track of vehicle condition and reduce downtime by ensuring timely maintenance and repair activities.
📅 Fleet Costs & Budget Management
Track total fleet costs, including maintenance, fuel, insurance, and other related expenses. Compare actual costs with budgeted amounts to identify potential areas for cost reduction.
🖥️ Interactive & Real-Time Data Insights
The Excel dashboard provides real-time data on all fleet-related KPIs. It includes interactive charts, slicers, and filters for in-depth analysis, helping you make informed decisions based on live data.
Why You’ll Love the Fleet Management KPI Dashboard in Excel
✅ Optimize Vehicle Utilization
Track vehicle performance and utilization to ensure that your fleet is being used efficiently. Identify underutilized vehicles and optimize asset deployment to reduce unnecessary costs.
✅ Improve Fuel Efficiency & Reduce Costs
Monitor fuel consumption and fuel efficiency to identify areas for improvement. Track fuel costs and take steps to reduce fuel waste, ultimately improving your fleet’s bottom line.
✅ Reduce Downtime with Maintenance Tracking
Keep track of scheduled and unscheduled maintenance to minimize downtime and ensure that vehicles are operating at peak efficiency. Reduce repair costs by identifying maintenance issues early.
✅ Control Fleet Costs & Stay Within Budget
Track all fleet-related expenses, including fuel, maintenance, and insurance, to manage your fleet’s budget effectively. Identify opportunities to reduce costs and stay within budget.
✅ Make Data-Driven Fleet Decisions
Use real-time data from the dashboard to make informed decisions about fleet operations. Optimize vehicle utilization, maintenance schedules, and fuel efficiency for better performance and cost savings.
What’s Inside the Fleet Management KPI Dashboard Template?
- Vehicle Performance & Utilization: Track fuel efficiency, mileage, and utilization rates for each vehicle in your fleet.
- Fuel Efficiency & Cost Tracking: Monitor fuel consumption, efficiency, and associated costs.
- Maintenance & Repair Management: Track scheduled and unscheduled maintenance, repairs, and associated costs.
- Fleet Costs & Budget Tracking: Track total fleet expenses and compare them with your budget to ensure cost-effectiveness.
- Real-Time Insights: Get up-to-date data on all fleet performance KPIs to optimize your fleet management strategy.
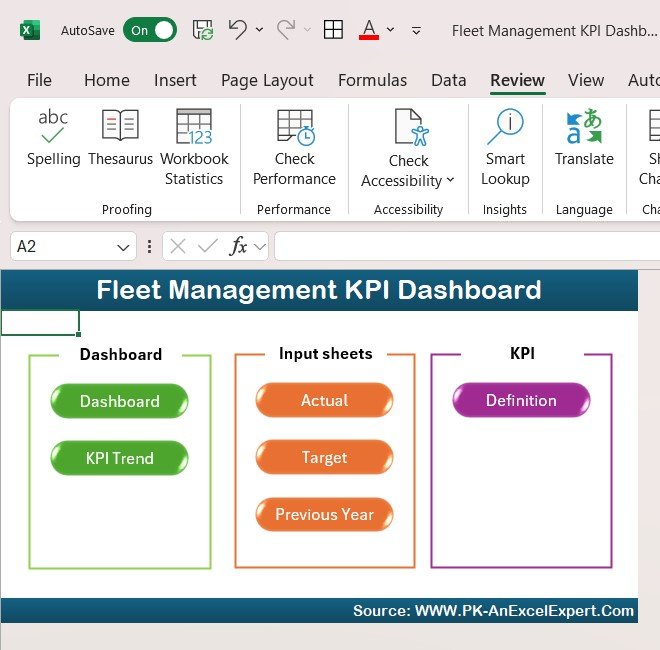
- Customizable KPIs: Adjust the dashboard to track the KPIs that matter most to your fleet management operations.
How to Use the Fleet Management KPI Dashboard in Excel
1️⃣ Download the Template: Get instant access to your Fleet Management KPI Dashboard in Excel.
2️⃣ Input Your Data: Enter your vehicle performance, fuel consumption, maintenance, and cost data into the dashboard.
3️⃣ Track & Monitor KPIs: Use the dashboard to track vehicle performance, fuel efficiency, maintenance, and costs in real-time.
4️⃣ Analyze & Optimize: Use insights from the dashboard to optimize fleet utilization, reduce costs, and improve vehicle efficiency.
Who Can Benefit from the Fleet Management KPI Dashboard in Excel?
🔹 Fleet Managers & Operators
🔹 Transportation & Logistics Companies
🔹 Vehicle Maintenance Teams
🔹 Supply Chain & Operations Managers
🔹 Businesses with Company Vehicles or Fleet Operations
🔹 Anyone Responsible for Managing Fleet Performance & Costs
Streamline your fleet management operations with the Fleet Management KPI Dashboard in Excel. Track key metrics such as vehicle performance, fuel efficiency, maintenance, and costs to optimize fleet usage, reduce expenses, and improve productivity.
Click here to read the Detailed blog post
Visit our YouTube channel to learn step-by-step video tutorials
Youtube.com/@PKAnExcelExpert
Compatibility and Requirements
- Works in Microsoft Excel desktop (Excel 2016 or later, or Microsoft 365).
- Microsoft’s guide Use slicers to filter data explains the Excel feature this file is built on.
Frequently Asked Questions
Which fleet KPIs does the dashboard track?
It covers vehicle performance and utilization, fuel consumption and fuel efficiency, mileage, scheduled and unscheduled maintenance and repair costs, and total fleet costs such as fuel, maintenance and insurance.
Can I compare fleet spending with my budget?
Yes. The cost section compares actual fleet costs with your budgeted amounts, so you can see where spending runs over.
How do I filter the results?
The dashboard has interactive charts, slicers and filters. Use them to narrow the view and look at the numbers in more detail.
Can I change the KPIs?
Yes. You can adjust the dashboard to track the KPIs that matter most to your own fleet operations.
Related Fleet Templates
- Fleet Management Dashboard in Excel: a full fleet dashboard in Excel with more pages
- Fleet Management KPI Dashboard in Google Sheets: the same fleet KPI dashboard in the browser
- Fleet Management Dashboard in Power BI: fleet reporting in Power BI
- Fleet Utilization KPI Dashboard in Excel: focus on how much each vehicle is used
- Logistics and Transportation Hub: logistics and transport templates in one bundle
Browse all Excel KPI dashboards or the Logistics templates.

























Reviews
There are no reviews yet.