

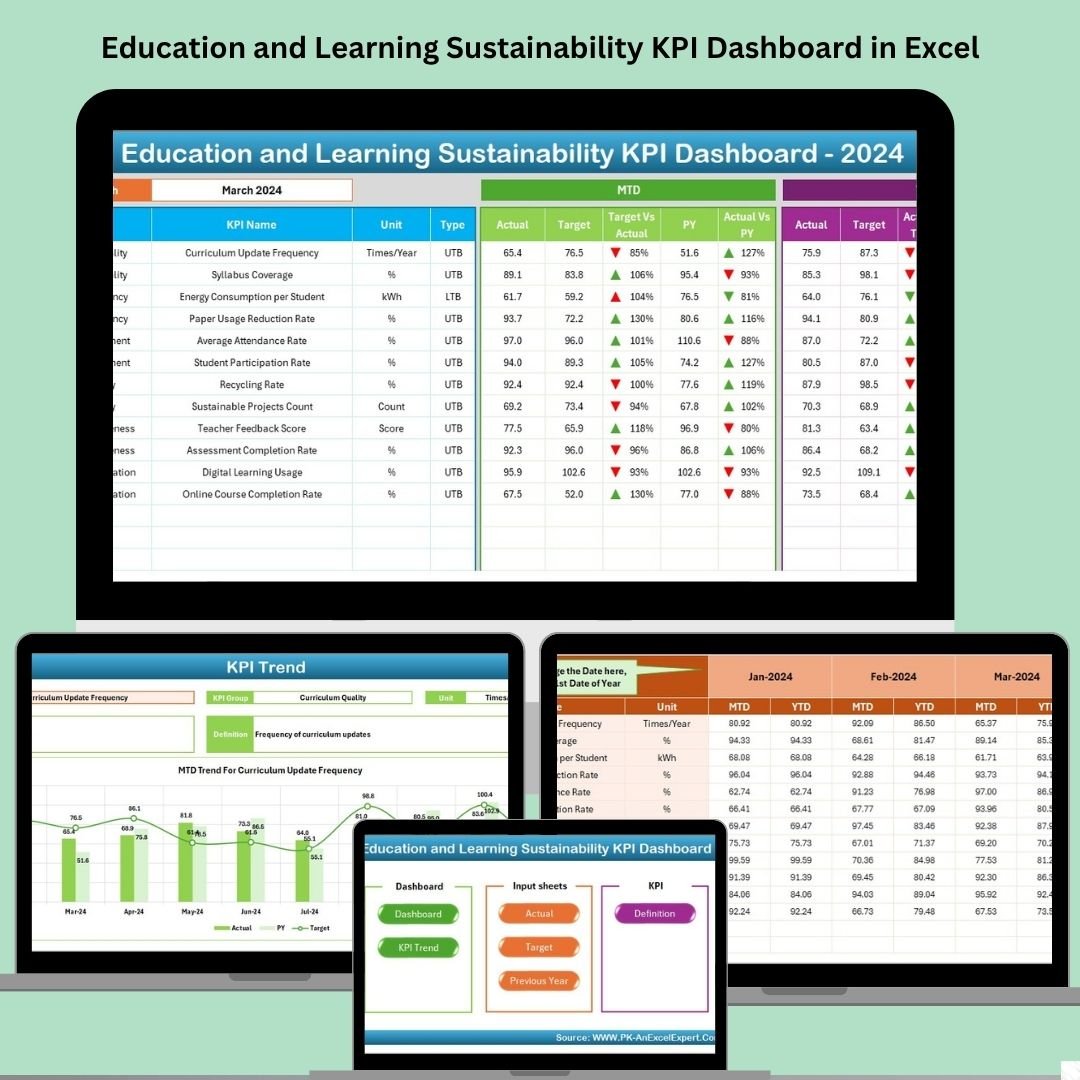

In the modern education system, data-driven decisions are no longer optional—they’re essential. Whether you’re managing a school, university, training institute, or a government-led education initiative, the Education and Learning Sustainability KPI Dashboard in Excel empowers you to measure, monitor, and optimize your learning outcomes and sustainability efforts with precision.
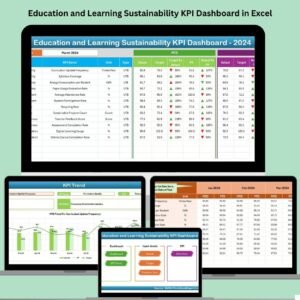
This Excel-based dashboard isn’t just a collection of charts and tables—it’s a strategic command center that helps you visualize and evaluate your most important educational KPIs. With monthly and year-to-date (MTD/YTD) views, conditional formatting, and customizable KPI definitions, this template is built for real-time insights and long-term impact.
✨ Key Features of Education and Learning Sustainability KPI Dashboard
📍 Home Sheet Navigation
Jump between sheets effortlessly using pre-built navigation buttons.
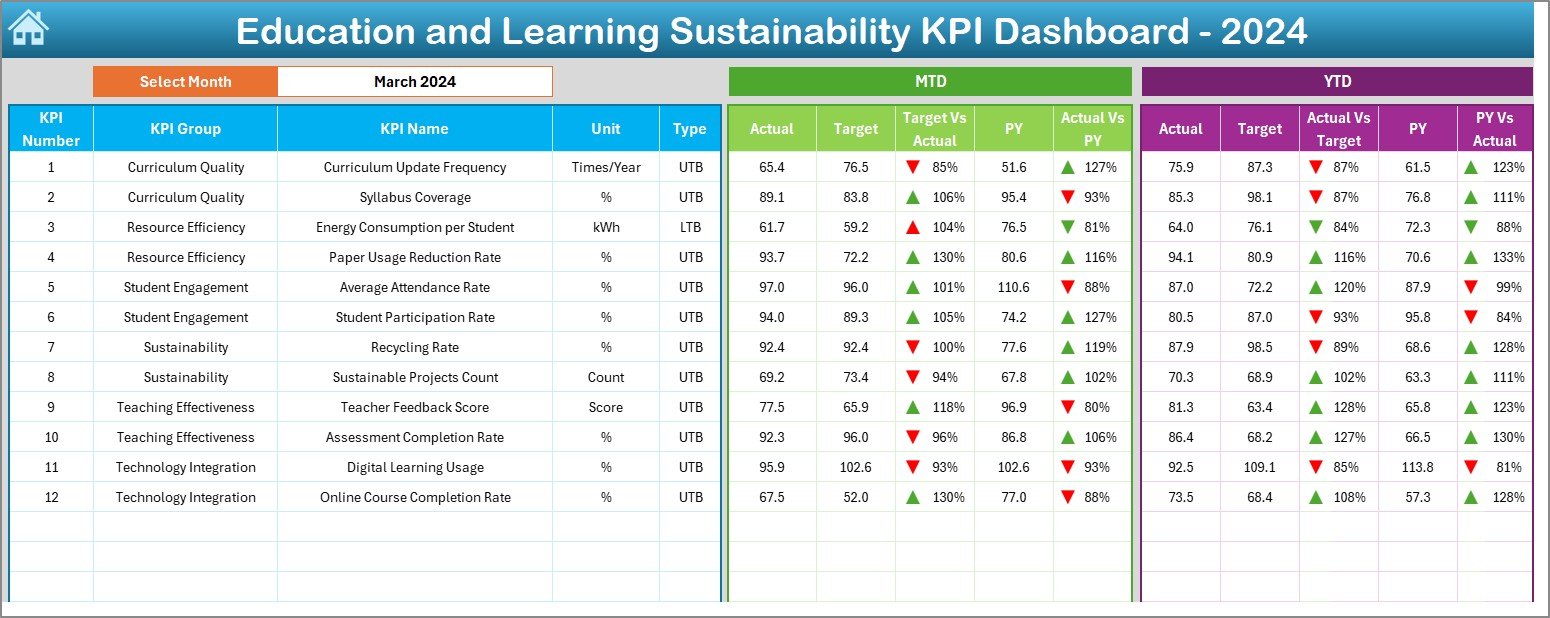
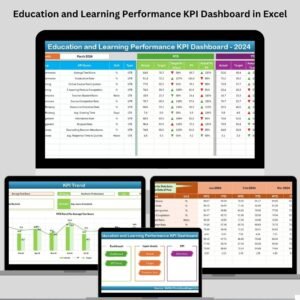
📊 Interactive Dashboard Sheet
Select a month from a dropdown and instantly update MTD/YTD metrics.
Visual indicators (up/down arrows) show performance against targets and last year’s numbers.
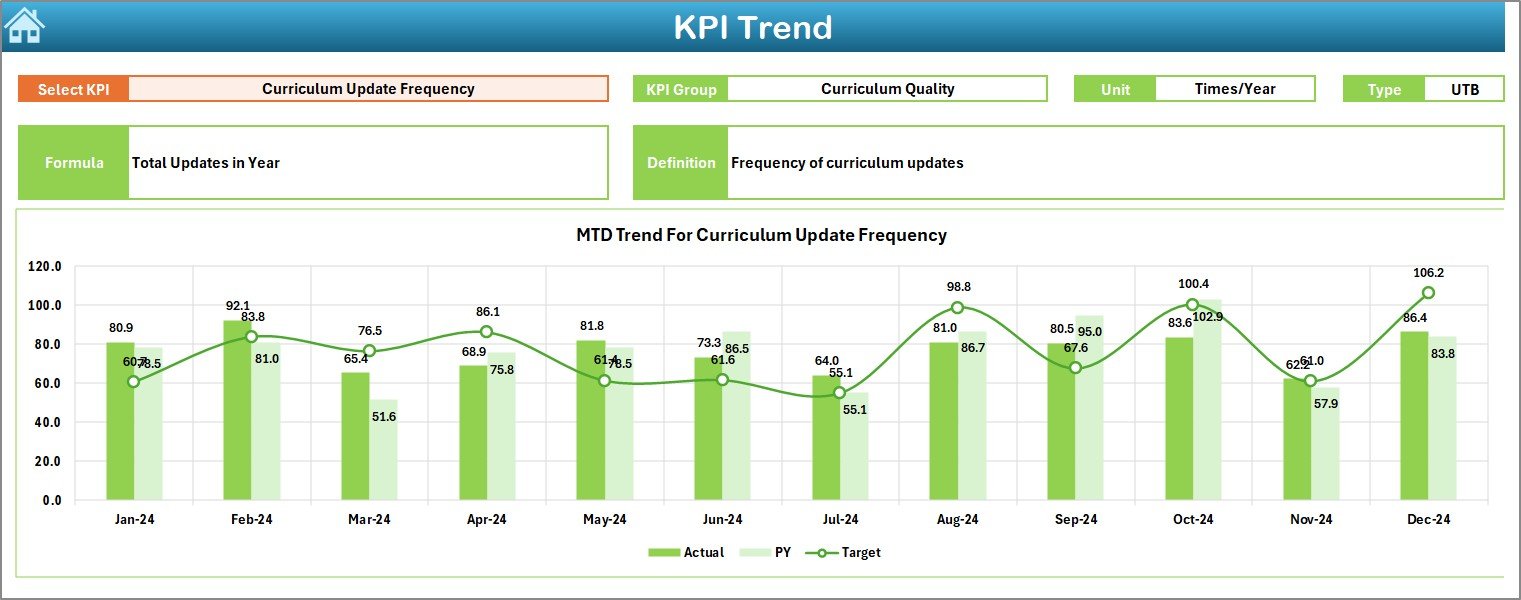
📈 KPI Trend Visualization
Track individual KPI trends over time—ideal for evaluating student engagement, graduation rates, and more.
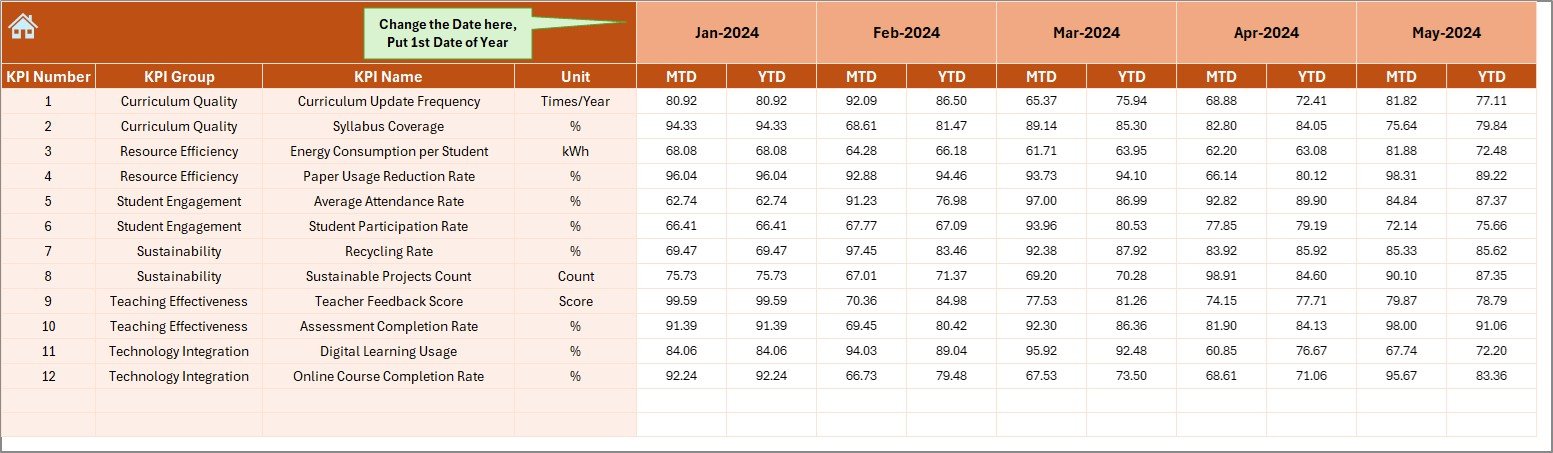
📝 Actual & Target Data Entry Tabs
Dedicated sheets for actual numbers, targets, and previous year comparisons make updates smooth and error-free.
📘 KPI Definition Sheet
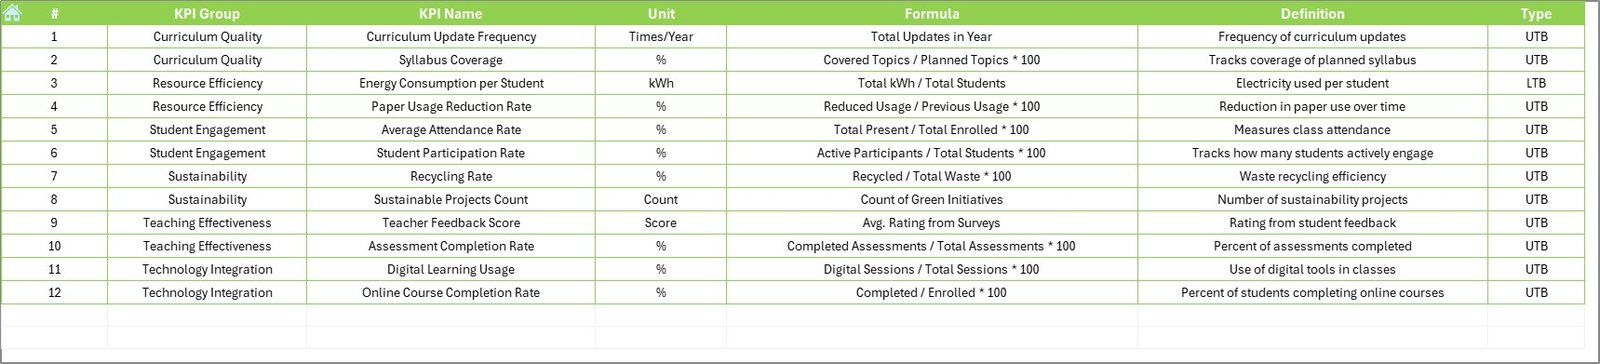
Every KPI is defined clearly with unit, group, formula, and classification (UTB/LTB).
🔐 Customizable & Scalable
Add or remove KPIs, tailor the dashboard to your institution’s needs, and incorporate your branding.
📦 What’s Inside the Education and Learning Sustainability KPI Dashboard
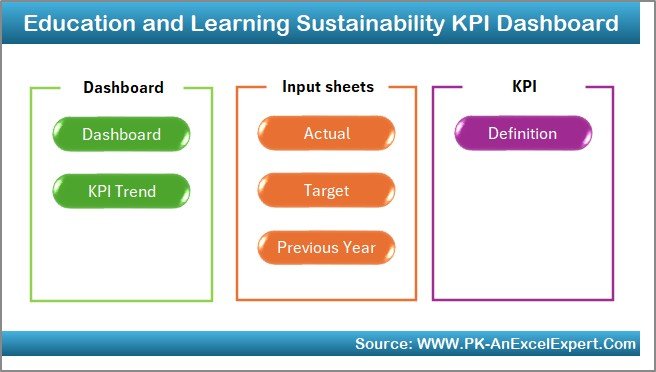
📍 Home Sheet: Acts as a dashboard index with 6 navigation buttons
📊 Dashboard Sheet: Central place for KPI visualizations and dropdown filters
📈 KPI Trend Sheet: Select any KPI to explore trendlines over months and years
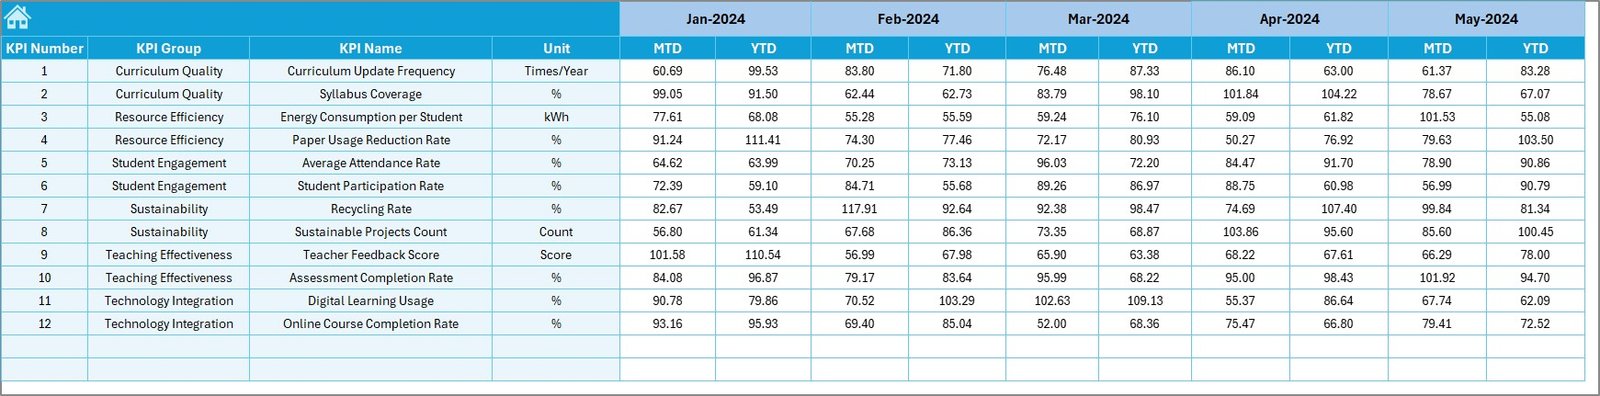
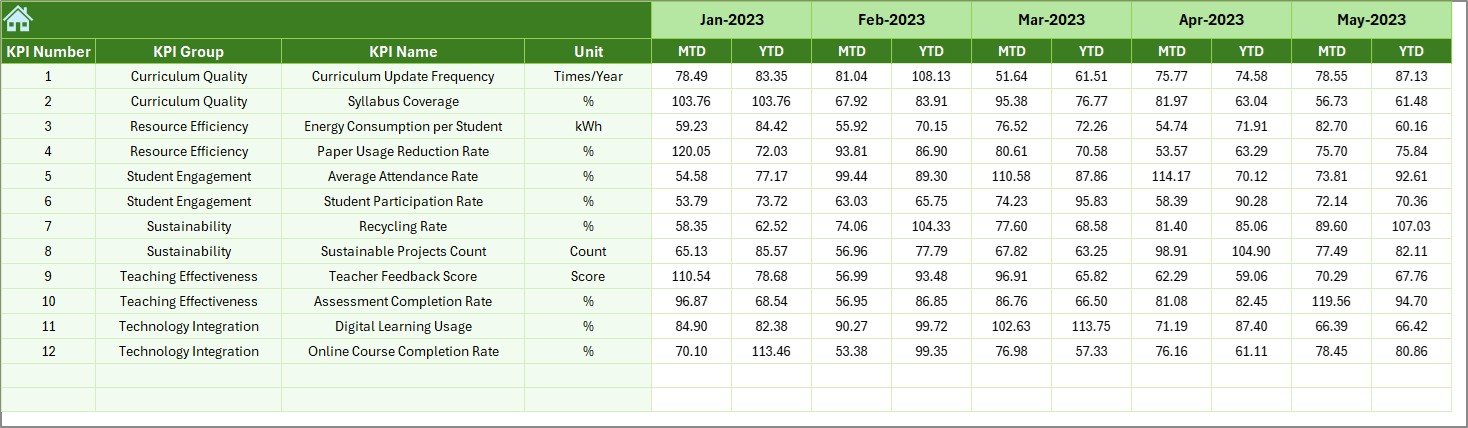
📝 Actual Numbers Input Sheet: Input MTD and YTD data manually
🎯 Target Sheet: Set your MTD/YTD targets for each KPI
📆 Previous Year Sheet: Store historical monthly data for accurate comparisons
📘 KPI Definition Sheet: Contains names, units, formulas, and definitions for each KPI
🧠 How to Use the Education & Learning KPI Dashboard
📝 Start by entering your actual data in the Actual Numbers Input sheet
🎯 Input monthly targets in the Target Sheet
📆 Populate previous year numbers for benchmarking
📊 Use the Dashboard and KPI Trend Sheet to monitor performance
🧩 Customize KPI groups, definitions, and chart visuals as needed
👥 Who Can Benefit from This Dashboard?
🎓 School Principals & University Deans – Oversee overall education health and outcomes
📈 Academic Coordinators & Data Analysts – Track student performance and curriculum efficiency
📋 NGOs in Education – Measure impact and sustainability metrics
🏛 Government Education Departments – Monitor district-wide or state-wide performance
🧑🏫 Corporate Training Managers – Ensure skill development programs meet sustainability targets
🌟 Why You Need This Dashboard
📊 Make data-driven decisions to enhance student outcomes and sustainability practices
⏱ Save time with pre-built templates and instant dashboard updates
🧩 Customize your KPIs based on institutional priorities
🧠 Gain deep insights into trends and historical comparisons
📈 Improve accountability across departments and stakeholders
✅ Click here to read the Detailed blog post
📺 Visit our YouTube channel to learn step-by-step video tutorials
👉 youtube.com/@PKAnExcelExpert
Watch the step-by-step video tutorial:
Compatibility and Requirements
- Works in Microsoft Excel desktop (Excel 2016 or later, or Microsoft 365).
- You pick the month from a dropdown on the Dashboard sheet. Microsoft explains dropdowns in Create a drop-down list.
Frequently Asked Questions
Which sheets are included?
Seven sheets: Home, Dashboard, KPI Trend, Actual Numbers Input, Target, Previous Year and KPI Definition.
How do I update the dashboard?
Enter your MTD and YTD figures in the Actual Numbers Input sheet and your goals in the Target sheet. Then select a month on the Dashboard sheet and the MTD and YTD views update.
Can I compare this year with last year?
Yes. Add last year’s monthly figures to the Previous Year sheet. The Dashboard shows up and down arrows against your targets and last year’s numbers.
How do I see the trend for one KPI?
Open the KPI Trend sheet and select the KPI you want. It shows the trend over months and years.
Can I add or remove KPIs?
Yes. You can add or remove KPIs, change the KPI groups and definitions, and add your institution’s branding. The KPI Definition sheet lists each KPI’s unit, group, formula and type (UTB or LTB).
Related Education and Learning Templates
- Education and Learning Performance KPI Dashboard in Excel: performance KPIs for schools and training centers
- Education and Learning Quality Assurance KPI Dashboard in Excel: quality KPIs for learning programs
- Education and Learning Financial Health KPI Dashboard in Excel: a finance view for institutions
- Sustainability Reporting KPI Dashboard in Excel: sustainability KPIs for any organization
- Education Dashboard in Google Sheets: an education dashboard in Google Sheets
Browse all Excel KPI dashboards.










Reviews
There are no reviews yet.