


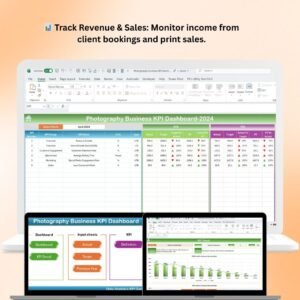
The Revenue Growth KPI Dashboard in Excel is a powerful and dynamic tool designed to help businesses track and monitor their revenue performance over time. This Excel-based dashboard allows you to visualize key performance indicators (KPIs) related to revenue growth, including total revenue, year-over-year (YoY) growth, monthly sales trends, and revenue forecasts.
Whether you’re a small business owner or part of a large enterprise, this tool helps you make data-driven decisions, optimize revenue strategies, and identify areas for improvement. With real-time tracking and customizable features, the dashboard is perfect for keeping an eye on your business’s financial health and ensuring continuous growth.
Key Features of the Revenue Growth KPI Dashboard in Excel
📊 Revenue Performance Monitoring
Track total revenue, revenue by product or service category, and revenue per customer to assess your business’s financial performance.
📅 Year-over-Year (YoY) Growth Tracking
Measure YoY revenue growth to understand long-term trends, identify seasonality patterns, and track your company’s growth trajectory.
📈 Monthly Sales Trends Analysis
Visualize monthly sales performance with dynamic charts and graphs. Quickly identify peaks, troughs, and overall performance trends to adjust strategies accordingly.
🔮 Revenue Forecasting
Use historical data to project future revenue growth. The forecasting feature helps businesses make informed predictions about future sales and plan resources more effectively.
⚙️ Customizable KPIs & Metrics
Tailor the dashboard to track KPIs that align with your business needs. Whether it’s tracking revenue by region, customer segment, or product category, you can modify the dashboard to fit your goals.
📉 Performance Comparison
Compare revenue performance against set targets and previous periods to measure progress, identify underperforming areas, and adjust strategies accordingly.
Why You’ll Love the Revenue Growth KPI Dashboard in Excel

✅ Monitor Revenue Performance in Real Time
Keep track of your revenue, identify growth trends, and measure the effectiveness of your sales strategies with up-to-date data and visuals.
✅ Understand Long-Term Growth Patterns
Evaluate YoY growth to get a clear picture of how your business is evolving over time. Use these insights to adjust long-term strategies for sustained growth.
✅ Identify Areas for Improvement
Spot underperforming sectors, seasonal trends, or product categories to optimize your revenue generation efforts and maximize profits.
✅ Plan Future Growth with Confidence
Use the revenue forecasting feature to predict future performance and make better decisions regarding investments, staffing, and resource allocation.
✅ Data-Driven Decision Making
Leverage the insights from this dashboard to make informed decisions that drive profitability and ensure business success.
What’s Inside the Revenue Growth KPI Dashboard in Excel?
- Revenue Performance Monitoring: Track total revenue and performance by product or service.
- Year-over-Year (YoY) Growth Tracking: Measure YoY growth to identify trends and assess long-term progress.
- Monthly Sales Trends: Visualize monthly sales trends to spot performance patterns.
- Revenue Forecasting: Project future revenue based on historical data.
- Customizable KPIs: Tailor the dashboard to fit your business needs.
- Performance Comparison: Compare performance against targets and previous periods.
How to Use the Revenue Growth KPI Dashboard in Excel
1️⃣ Download the Template: Get the Revenue Growth KPI Dashboard in Excel instantly.
2️⃣ Enter Your Revenue Data: Input historical and current revenue data into the dashboard.
3️⃣ Monitor KPIs & Growth: Track key metrics like total revenue, YoY growth, and monthly sales trends.
4️⃣ Analyze Trends & Forecast Future Revenue: Use the forecasting feature to predict future revenue growth.
5️⃣ Make Data-Driven Decisions: Adjust your revenue generation strategies based on the insights from the dashboard.
Who Can Benefit from the Revenue Growth KPI Dashboard in Excel?
🔹 Business Owners & Entrepreneurs
🔹 Sales Managers & Teams
🔹 Marketing Professionals
🔹 Financial Analysts & Consultants
🔹 Corporate Executives & Decision Makers
🔹 Small & Medium Businesses (SMBs)
🔹 Large Enterprises with Revenue Management Needs
Optimize your revenue generation strategies and ensure sustainable growth with the Revenue Growth KPI Dashboard in Excel. Track key metrics, analyze trends, and forecast future growth to stay ahead of the competition.
Click here to read the Detailed blog post
Visit our YouTube channel to learn step-by-step video tutorials
Youtube.com/@PKAnExcelExpert


Reviews
There are no reviews yet.