


The Debt-to-Equity Ratio KPI Dashboard in Excel is an essential financial tool designed to help businesses and financial analysts track, manage, and optimize their debt-to-equity ratio. This key performance indicator (KPI) is crucial for understanding the financial health of a business, assessing its risk level, and making informed decisions about capital structure and financial planning.
This Excel-based dashboard allows you to monitor the debt-to-equity ratio over time, visualize trends, and analyze how changes in debt or equity impact the company’s financial standing. With the easy-to-use interface and real-time data tracking, the tool ensures that you can make data-driven decisions that help optimize the balance between debt and equity, leading to improved financial sustainability.
Key Features of the Debt-to-Equity Ratio KPI Dashboard in Excel
📊 Real-Time Debt-to-Equity Ratio Tracking
Track the debt-to-equity ratio over time to monitor the balance between your company’s debt and equity. This ratio is a critical metric for assessing the company’s financial leverage and risk level.
📈 Historical Performance Analysis
Visualize the trend of your debt-to-equity ratio across different periods (monthly, quarterly, or yearly). This helps you understand how changes in debt or equity affect your overall financial structure.
📉 Financial Health Insights
Understand how your debt and equity mix impacts your company’s risk profile and financial stability. The dashboard helps identify when the company is over-leveraged or under-leveraged, enabling you to make adjustments to optimize your capital structure.
🔑 Customizable Financial Metrics
Customize the dashboard to track additional financial metrics such as total debt, total equity, and equity ratio. This allows you to tailor the dashboard to your specific financial analysis needs.
📅 Time-Based Performance Analysis
Monitor the changes in the debt-to-equity ratio over different time periods. Use this data to evaluate your company’s financial performance during specific time frames and identify trends.
⚙️ Real-Time Data Integration
Integrate your financial data sources (e.g., balance sheet, income statement) to get real-time updates and accurate calculations of your debt-to-equity ratio. This ensures that your analysis reflects the latest financial data.
Why You’ll Love the Debt-to-Equity Ratio KPI Dashboard in Excel
✅ Track Your Financial Leverage
Monitor your company’s financial leverage in real-time to ensure that the balance between debt and equity is optimal for your business objectives.
✅ Gain Financial Health Insights
Understand how your debt and equity structure impact your company’s risk and sustainability and make informed decisions to improve financial stability.
✅ Optimize Capital Structure
Use the insights from the dashboard to manage your capital structure effectively, ensuring that you are neither over-leveraged nor under-leveraged.
✅ Data-Driven Financial Planning
Leverage the data from the dashboard to plan future financing, identify financial risks, and determine whether to take on more debt or seek additional equity funding.
✅ Customizable & Scalable
The dashboard is fully customizable, allowing you to track additional KPIs or adjust the calculations based on your company’s financial reporting needs.
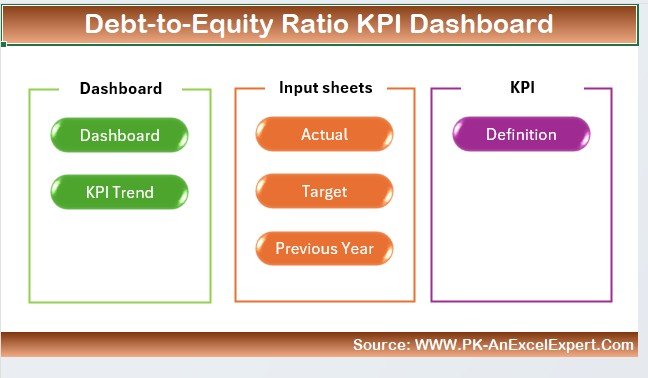
What’s Inside the Debt-to-Equity Ratio KPI Dashboard in Excel?
- Real-Time Debt-to-Equity Tracking: Monitor the balance between debt and equity in real-time.
- Historical Performance Analysis: Track trends in your debt-to-equity ratio over time.
- Financial Health Insights: Gain valuable insights into your company’s financial structure.
- Customizable Metrics: Tailor the dashboard to include additional financial data and metrics.
- Time-Based Performance: Analyze your financial data across different periods.
- Real-Time Data Integration: Sync with your financial systems for accurate, up-to-date data.
How to Use the Debt-to-Equity Ratio KPI Dashboard in Excel
1️⃣ Download the Template: Instantly access the Debt-to-Equity Ratio KPI Dashboard in Excel.
2️⃣ Integrate Your Financial Data: Import your financial data, including total debt and total equity.
3️⃣ Track Your Debt-to-Equity Ratio: Monitor the debt-to-equity ratio in real-time to assess your company’s financial leverage.
4️⃣ Analyze Financial Trends: Visualize your debt-to-equity ratio trends over time and evaluate performance.
5️⃣ Make Data-Driven Financial Decisions: Use the insights to optimize your capital structure and financial planning.
Who Can Benefit from the Debt-to-Equity Ratio KPI Dashboard in Excel?
🔹 Financial Analysts & CFOs
🔹 Business Owners & Entrepreneurs
🔹 Investors & Stakeholders
🔹 Accounting & Finance Teams
🔹 Risk Management Professionals
🔹 Small & Medium Enterprises (SMBs)
🔹 Large Corporations with Complex Financial Structures
Track, analyze, and optimize your company’s financial leverage with the Debt-to-Equity Ratio KPI Dashboard in Excel. Make informed decisions to maintain a healthy balance between debt and equity and drive financial sustainability.
Click here to read the Detailed blog post
Visit our YouTube channel to learn step-by-step video tutorials
Youtube.com/@PKAnExcelExpert


Reviews
There are no reviews yet.