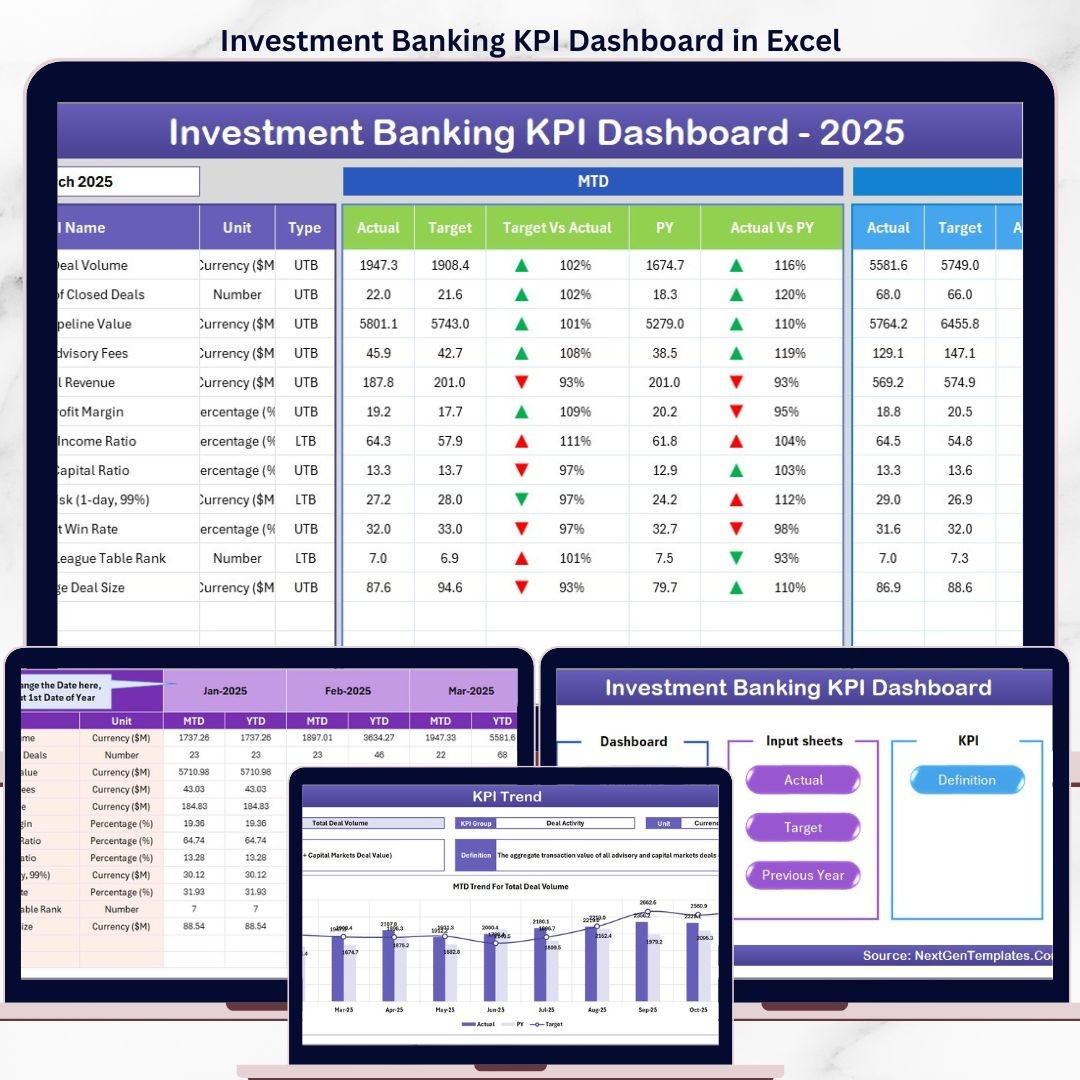

The Investment Banking KPI Dashboard in Excel tracks key performance indicators across 7 structured worksheets, with MTD and YTD Actual vs Target vs Previous Year comparisons built in from day one. Setup takes under 15 minutes — enter your KPI definitions once, input your actual numbers monthly, and every chart and variance indicator updates automatically.
🌍 Join 8,400+ teams in 40+ countries using NextGenTemplates to replace expensive analytics platforms with one-time-purchase Excel Finance Templates.
✅ Instant download · One-time payment · No subscription · No per-user fees · Lifetime access
🔑 Key Features of Investment Banking KPI Dashboard in Excel
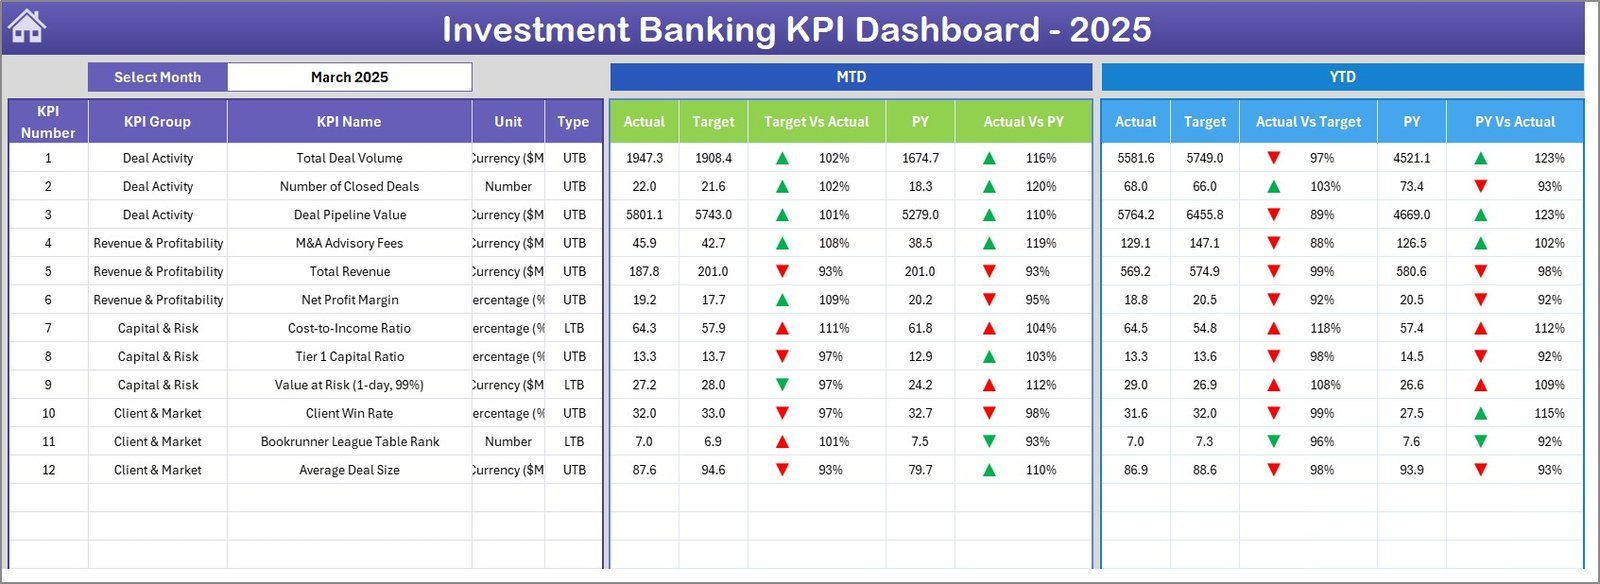
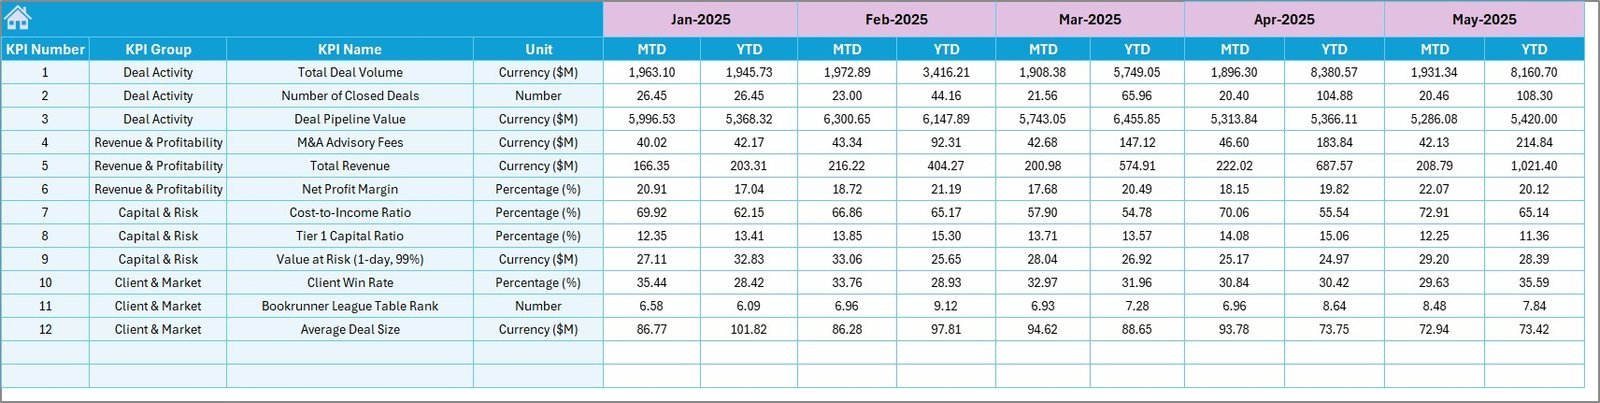
🔹 MTD and YTD dual-view monitoring — Every KPI shows Month-to-Date and Year-to-Date Actual, Target, and Previous Year data side by side, giving you a complete picture of performance trajectory at a single glance.
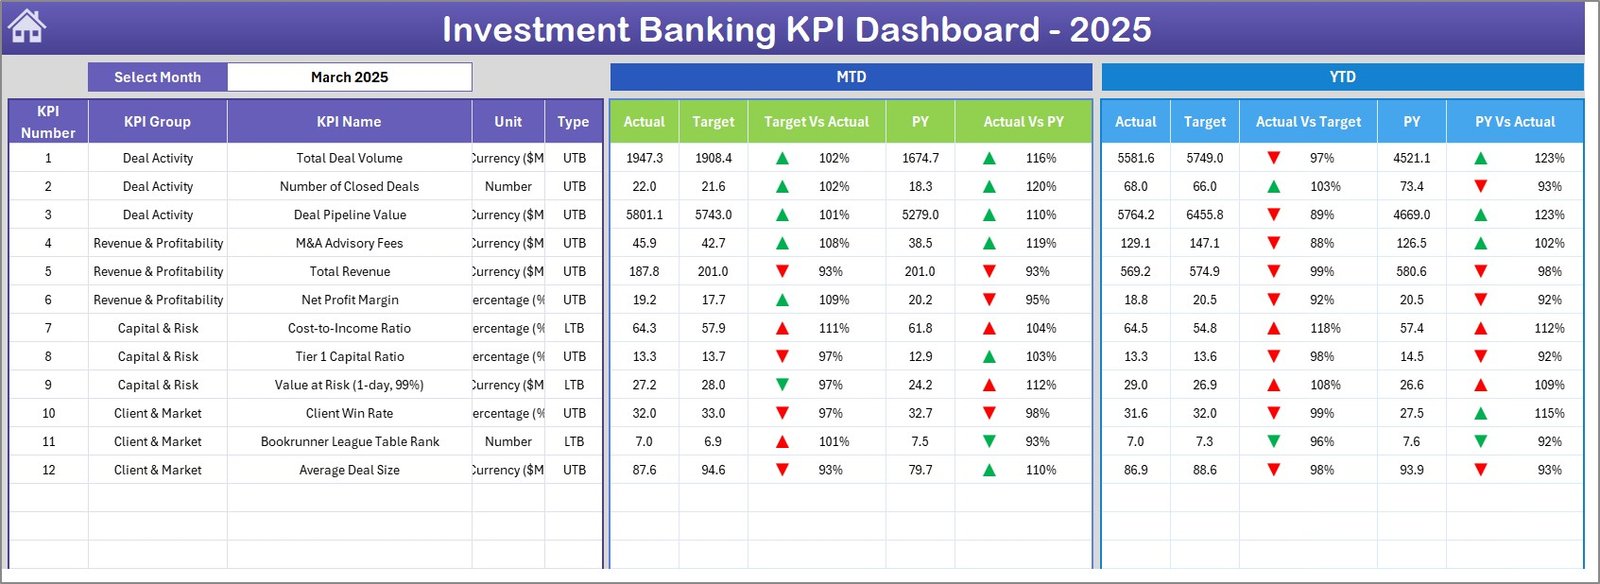
🔹 Conditional formatting variance arrows — Target vs Actual and PY vs Actual columns display dynamic up/down arrows colored green or red, so your investment banking team instantly spots which KPIs are on track and which need attention — no manual analysis required.
🔹 Dynamic month selector — A single dropdown on cell D3 of the Dashboard sheet switches the entire dashboard to the selected month. All MTD numbers, charts, and variance indicators recalculate in real time.
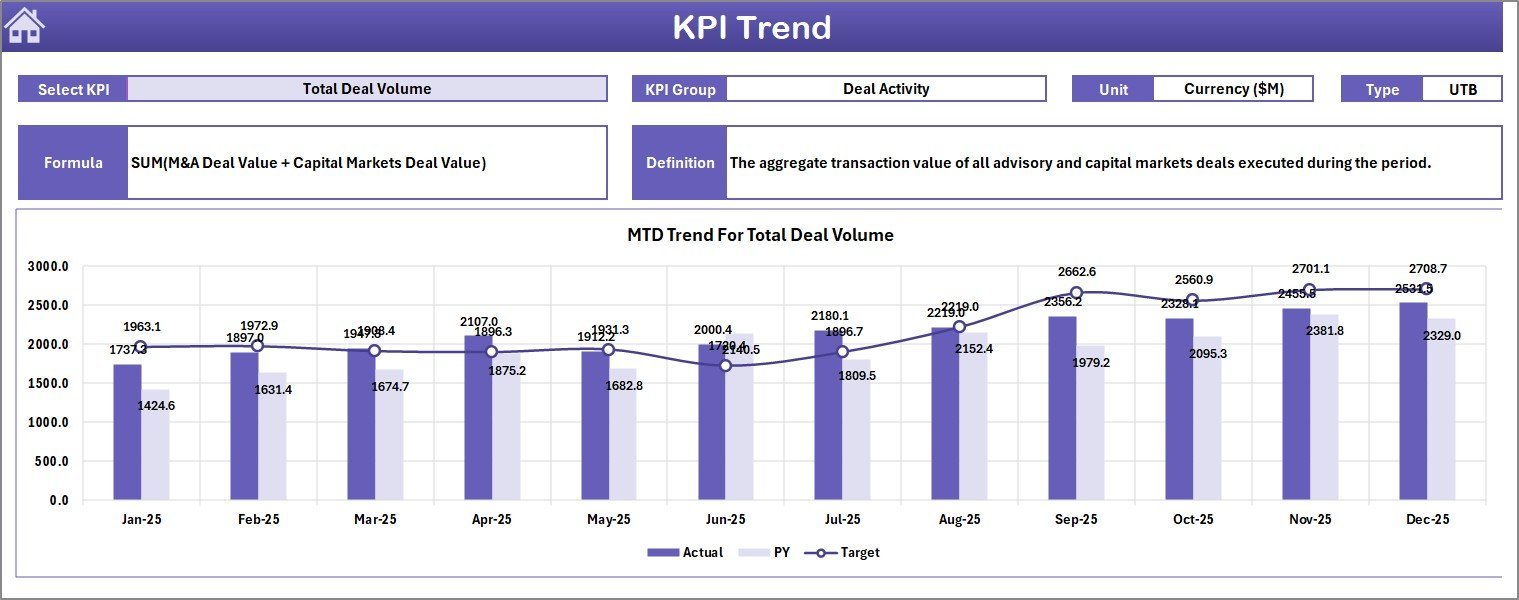
🔹 KPI Trend charts with LTB/UTB classification — The KPI Trend sheet plots separate MTD and YTD trend lines for Actual, Target, and PY. Each KPI is classified as Lower the Better or Upper the Better, ensuring variance colors reflect the correct performance direction.
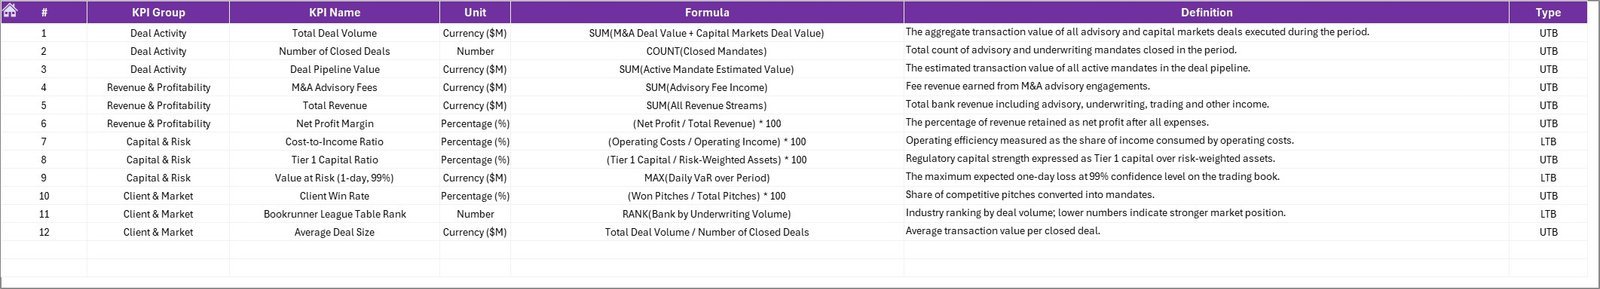
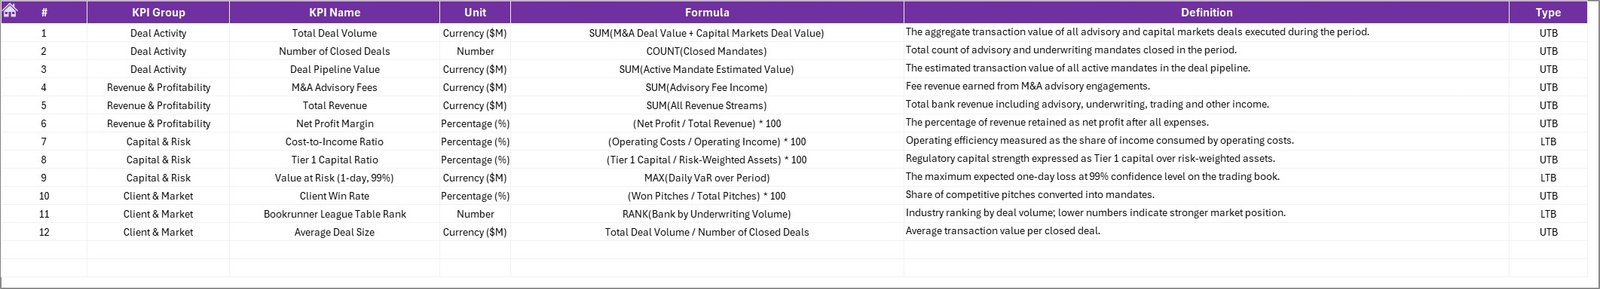
🔹 Fully configurable KPI library — The KPI Definition sheet lets you define KPI Name, Group, Unit, Formula, and Description for every metric. 100% customizable for your deal desk, coverage team, or M&A division.
📦 What’s Inside the Investment Banking KPI Dashboard in Excel
Home Sheet
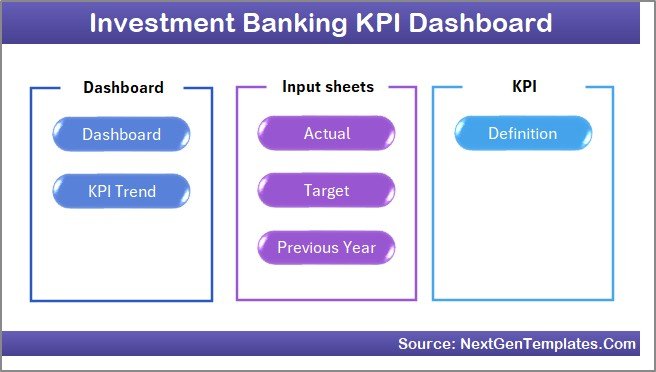
🔹 Sheet 1 — Home (Navigation): An index sheet with 6 navigation buttons that jump directly to each worksheet. Clean, professional layout designed for client presentations and internal reporting.
Investment Banking KPI Dashboard
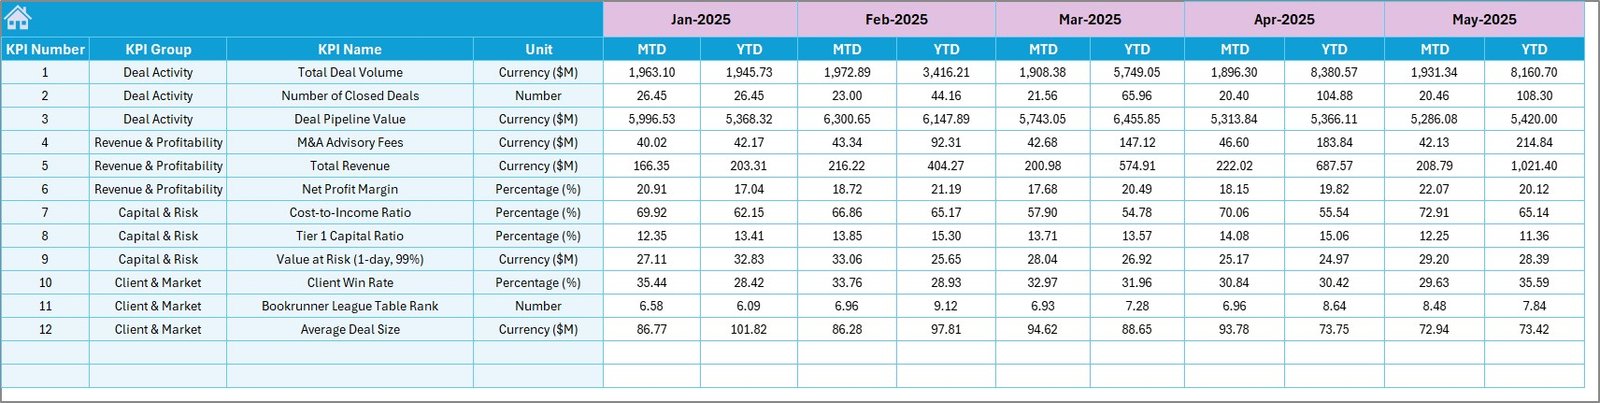
🔹 Sheet 2 — Dashboard: Central reporting view. Select the month from D3, and the full MTD/YTD Actual, Target, and PY columns update across all tracked KPIs. Conditional formatting arrows flag performance direction instantly.

KPI Trend Sheet
🔹 Sheet 3 — KPI Trend: Select any KPI from a dropdown on C3. View KPI Group, Unit, Type (LTB/UTB), Formula, and Definition. MTD and YTD trend charts display Actual vs Target vs PY over time.

Actual Numbers Input Sheet
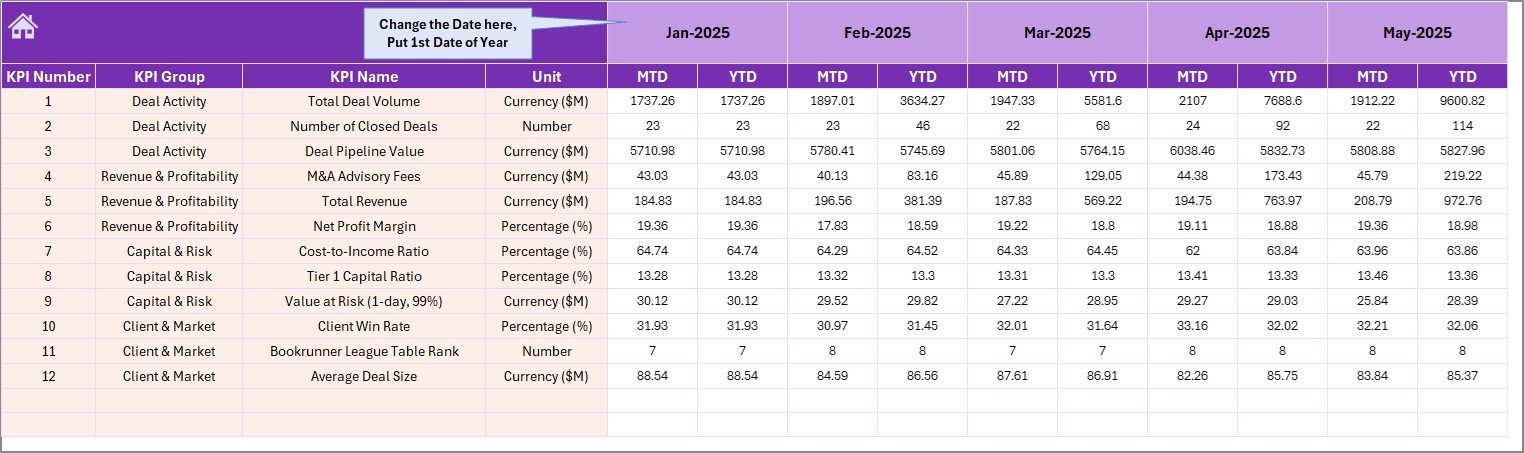
🔹 Sheet 4 — Actual Numbers Input: Enter monthly actuals for both MTD and YTD. Set the fiscal year start month once in cell E1 — all period labels cascade automatically.
Target Number Input Sheet
🔹 Sheet 5 — Target Numbers: Input monthly MTD and YTD targets per KPI. The dashboard automatically computes Target vs Actual variance and renders the conditional formatting arrows.
Previous Year Number Input Sheet
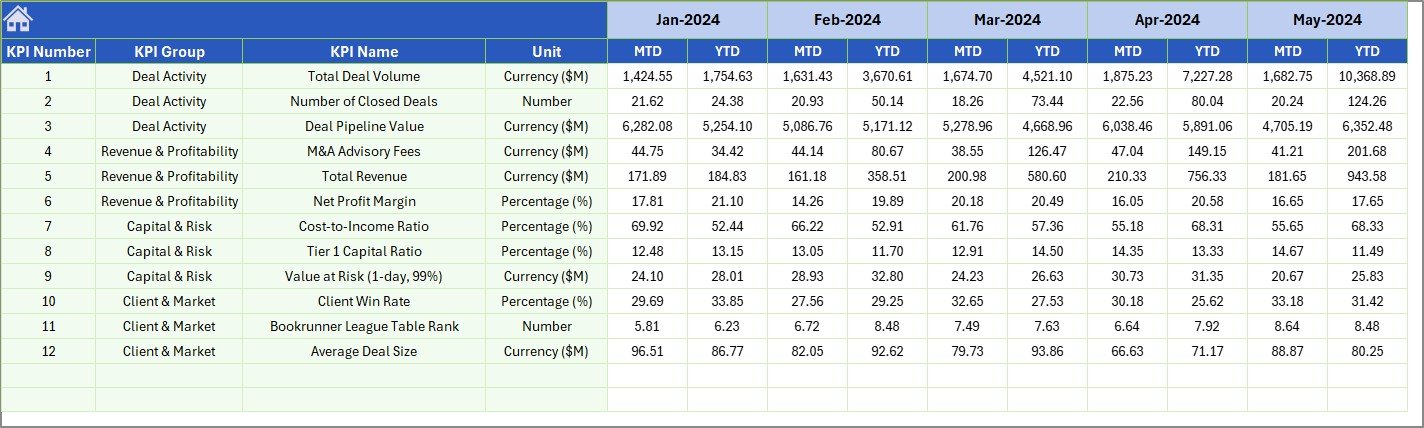
🔹 Sheet 6 — Previous Year Numbers: Mirror the same structure as the Actual sheet but for the prior year. Enables true YoY comparison across every KPI in one view.
KPI Definition Sheet
🔹 Sheet 7 — KPI Definition: Define KPI Name, Group, Unit, Formula, and Description. Mark each KPI as LTB (Lower the Better) or UTB (Upper the Better) in the final column to drive correct conditional formatting logic.
📊 Investment Banking KPI Dashboard in Excel vs. Google Sheets vs. Bloomberg Terminal — Where This Fits
| Feature | Investment Banking KPI Dashboard (Excel) | Google Sheets Equivalent | Bloomberg Terminal / BI Platform |
|---|---|---|---|
| Cost | $14.99 one-time ✅ | Free (manual build) | $2,000–$24,000 / year / seat |
| Platform | Microsoft Excel ✅ | Browser-based | Proprietary platform |
| MTD + YTD dual view | Built-in ✅ | Manual setup required | Requires custom configuration |
| LTB / UTB KPI logic | Pre-built ✅ | Not available by default | N/A for internal KPIs |
| Conditional variance arrows | Auto-formatted ✅ | Requires scripting | Limited customization |
| KPI Trend charts | MTD + YTD auto-charts ✅ | Manual chart build | Real-time data only |
| Setup time | Under 15 minutes ✅ | 4–8 hours DIY | Weeks of onboarding |
| Works offline | Yes ✅ | Requires internet | Requires live connection |
| Year-1 cost (5 users) | $14.99 total ✅ | $0 + hours of setup | $10,000–$120,000+ |
For investment banking teams that need structured KPI reporting without Bloomberg’s price tag or Google Sheets’ setup overhead, this Excel dashboard sits in the sweet spot.
👥 Who This Template Is For — and Who It’s Not For
✅ This template is built for:
- Investment banking analysts and associates tracking deal, revenue, and pipeline KPIs monthly
- Finance managers and CFOs at boutique advisory or mid-market PE firms needing structured KPI oversight
- M&A teams and coverage bankers who want MTD/YTD trend visibility without Excel consulting costs
- Finance directors who need a PY comparison layer to present to partners or senior management
❌ This template is NOT for:
- Teams requiring real-time live market data feeds (you need Bloomberg or Refinitiv for that)
- Organizations running Power BI or Tableau server environments (check our Finance KPI Dashboard templates in Power BI)
- Users without Microsoft Excel 2016 or later
⚙️ How to Use the Investment Banking KPI Dashboard in Excel
1️⃣ Set up KPI Definitions — Open Sheet 7, enter your KPI names, groups, units, formulas, and LTB/UTB classification.
2️⃣ Set fiscal year start — In the Actual Numbers Input sheet (E1), enter the first month of your fiscal year.
3️⃣ Enter Target data — Fill in monthly MTD and YTD targets in Sheet 5 for each KPI.
4️⃣ Enter Previous Year data — Populate Sheet 6 with last year’s actuals (same format as current year).
5️⃣ Input monthly actuals — Each month, open Sheet 4 and enter current period MTD and YTD figures.
6️⃣ Switch to Dashboard — Select the month from D3’s dropdown. All KPIs, variances, and conditional arrows update instantly.
💼 Real-World Use Cases
Marcus leads analytics at a mid-market M&A advisory. He uses the Investment Banking KPI Dashboard in Excel to report deal pipeline conversion rates, fee revenue per banker, and pitch-to-close ratios to partners every month — without needing a BI developer or a $25,000 Bloomberg subscription.
Priya manages FP&A at a financial services holding company. She tracks 12 investment banking KPIs including ROE, AUM growth, and deal closure rate across three subsidiaries. The KPI Trend sheet lets her present rolling trend lines to the board with a single dropdown selection — no pivot table refreshing, no manual chart updates.
❓ Frequently Asked Questions
What KPIs does the Investment Banking KPI Dashboard in Excel track?
The template ships with configurable KPI slots — you define the KPI names, groups, units, and formulas in the KPI Definition sheet. Typical investment banking KPIs include deal revenue, AUM growth, fee income, pipeline conversion rate, ROE, and deal cycle time. All metrics update automatically once input data is entered.
How does this compare to Bloomberg Terminal for KPI tracking?
Bloomberg Terminal provides live market data; this dashboard is designed for internal performance KPI tracking — deal metrics, team targets, and YoY variances. The Investment Banking KPI Dashboard in Excel costs a one-time $14.99 vs. Bloomberg’s $2,000+ per month per seat.
Can I customize the KPIs to match my firm’s specific metrics?
Yes. The KPI Definition sheet is fully editable. Add, remove, or rename any KPI along with its Group, Unit, Formula, and LTB/UTB classification. The dashboard, trend charts, and variance logic all update automatically based on your definitions.
How long does setup take?
Most users complete full setup in under 15 minutes. Enter KPI definitions, set the fiscal year start month, paste in targets and prior-year data, then input your first month’s actuals. The dashboard and all trend charts are ready immediately.
Does this work on Mac or Windows Excel?
Yes. The Investment Banking KPI Dashboard in Excel works on Microsoft Excel 2016 or later on both Windows and Mac. No macros or VBA are required — all logic runs on native Excel formulas and conditional formatting.
Can I add more KPIs beyond the default number?
Yes. The input sheets and KPI Definition sheet are structured to accommodate additional rows. You can extend the KPI list to cover as many metrics as your team tracks — from 5 to 50+ KPIs.
👤 About the Author
Built by PK — Microsoft Certified Professional with 15+ years of Excel, Google Sheets, and Power BI experience. Founder of NextGenTemplates, reaching 300K+ subscribers across YouTube channels (@PK-AnExcelExpert, @NextGenTemplates, @NeoTechNavigators). Every template is hand-built and tested before release.
🔗 Explore Related Templates
💎 Save 37% — Get 8 premium finance templates in the Finance & Accounting Command Center Bundle →
📊 Finance Summary Dashboard in Excel — Track income, expenses, and profit margins with interactive charts.
📈 Budget Forecasting Dashboard in Excel — Plan, track, and flag budget variances across departments.
📉 Revenue Analysis Report in Excel — Dynamic revenue tracking by region, channel, and month.
📖 Click here to read the Detailed Blog Post
🎥 Visit our YouTube channel for step-by-step video tutorials
👉 YouTube.com/@NextGenTemplates
📅 Last updated: May 2026


Reviews
There are no reviews yet.