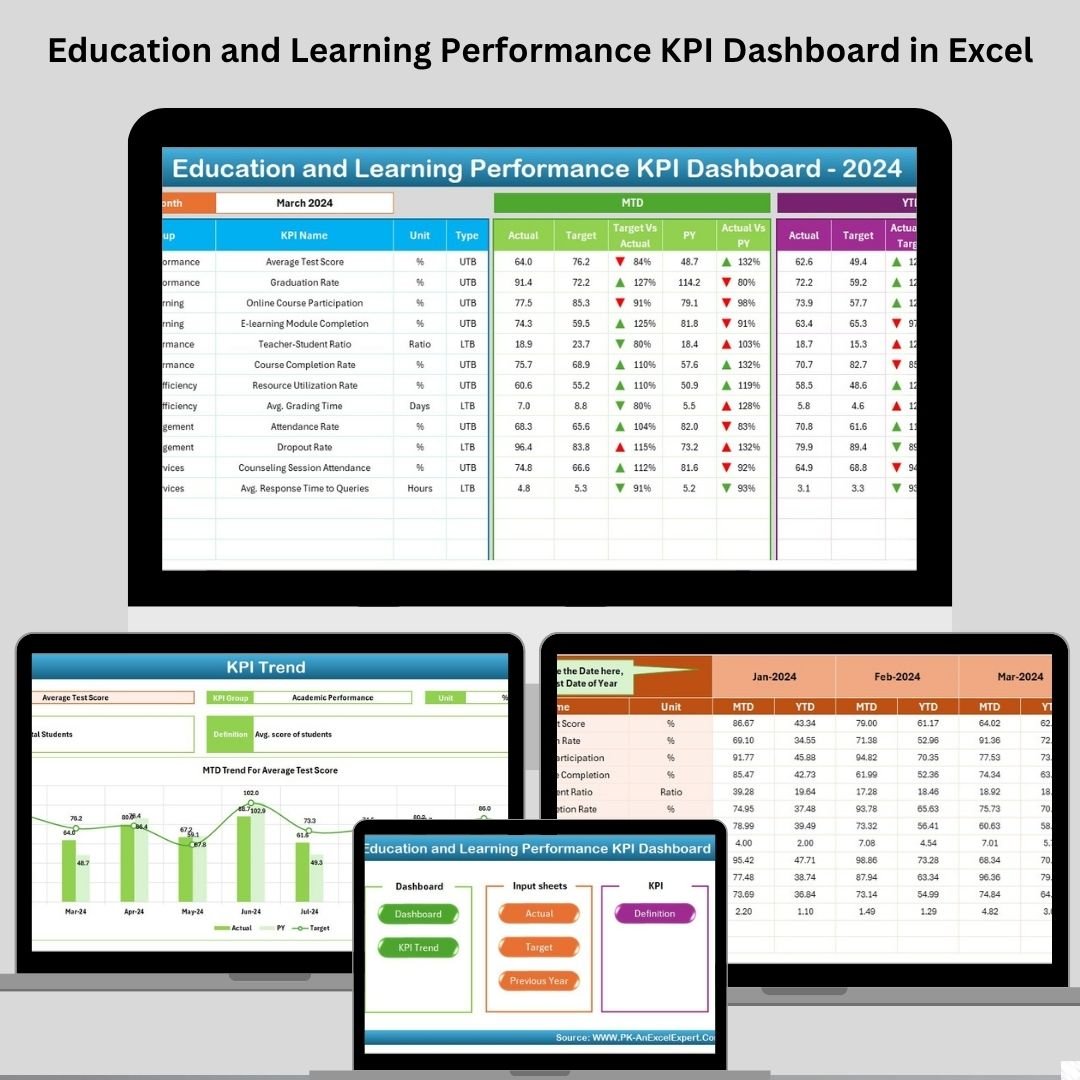
Are you an educator, administrator, or trainer struggling to track performance metrics manually? 📚
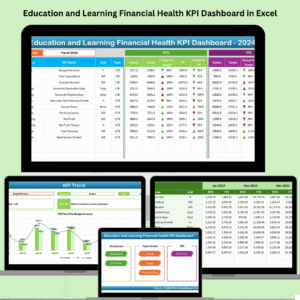
Then say hello to the Education and Learning Performance KPI Dashboard in Excel — your all-in-one, ready-to-use Excel tool that transforms educational data into actionable insights. 🚀
Whether you’re running a school, managing a training center, or overseeing an e-learning platform, this dashboard is your ultimate performance tracker, designed to streamline operations, boost accountability, and drive student success.
✨ Key Features of Education and Learning KPI Dashboard
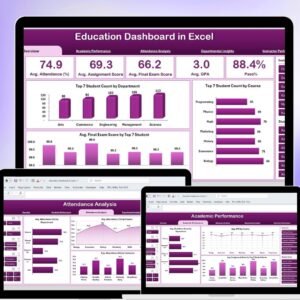
📊 Interactive Dashboard for Instant Insights
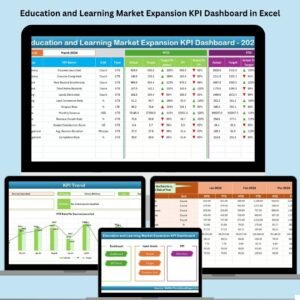
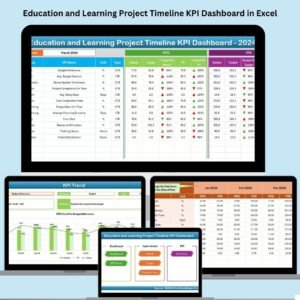
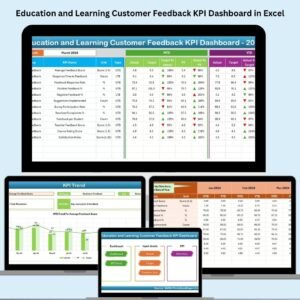
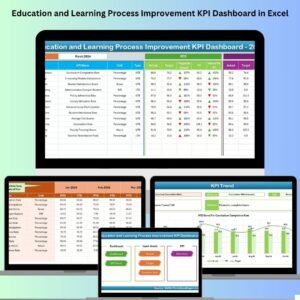
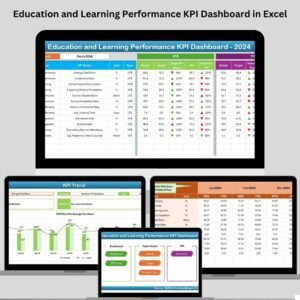
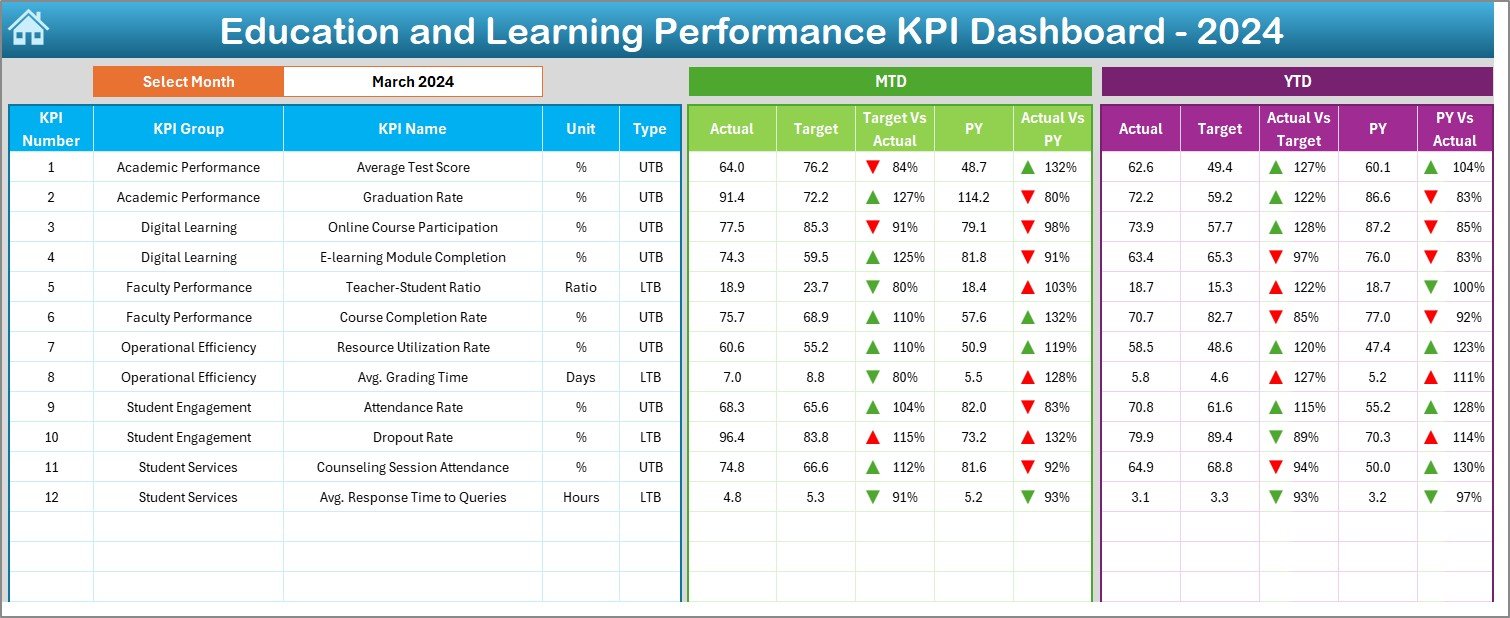
The Dashboard sheet is the heart of this template. Just pick a month, and everything updates automatically:
📅 Month-to-Date (MTD) and Year-to-Date (YTD) metrics
🎯 Targets vs. Actuals with previous year comparisons
🔺 Visual indicators (green/red arrows) to spot trends fast
🎨 Color-coded formatting for clarity during presentations
Ideal for review meetings, board reports, or weekly check-ins!
📈 KPI Trend Sheet to Monitor Long-Term Progress
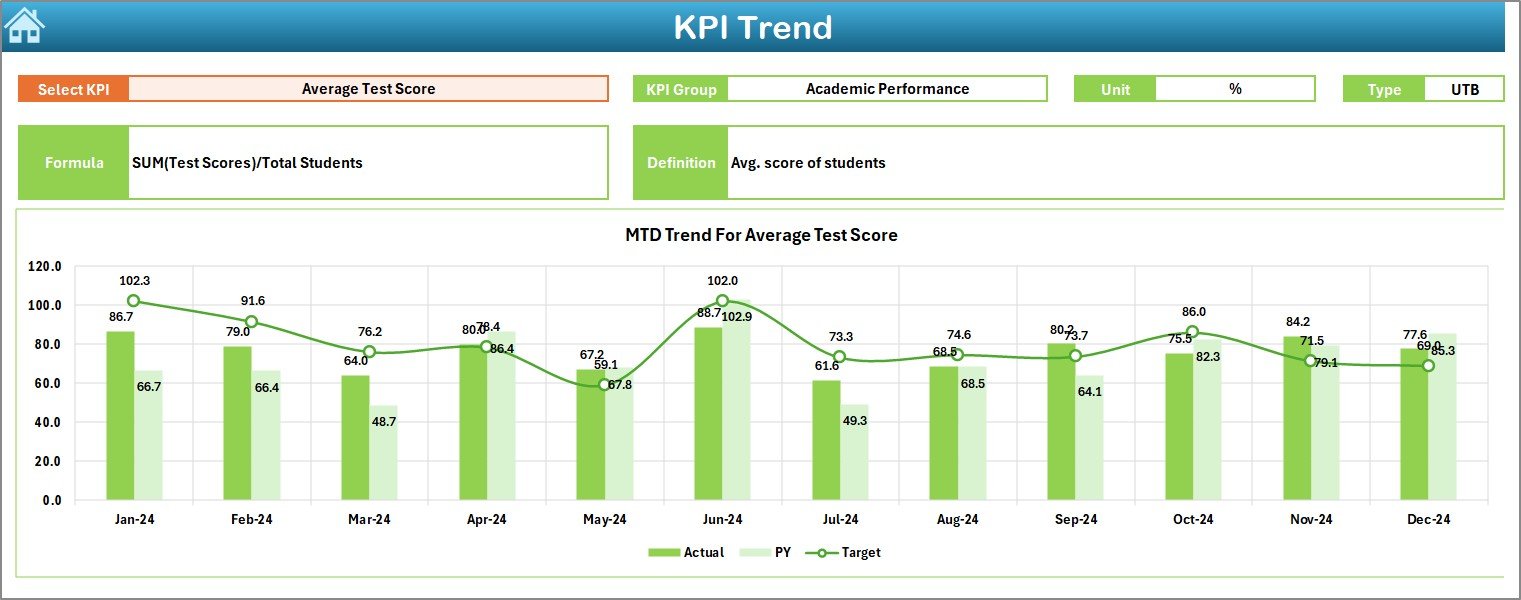
Deep-dive into any KPI with the click of a dropdown:
📘 See KPI definition, group, formula, and measurement unit
📊 Track MTD and YTD trends against targets and previous year
🔍 Spot patterns early and make data-driven interventions
No more guesswork — just clean, contextual insights.
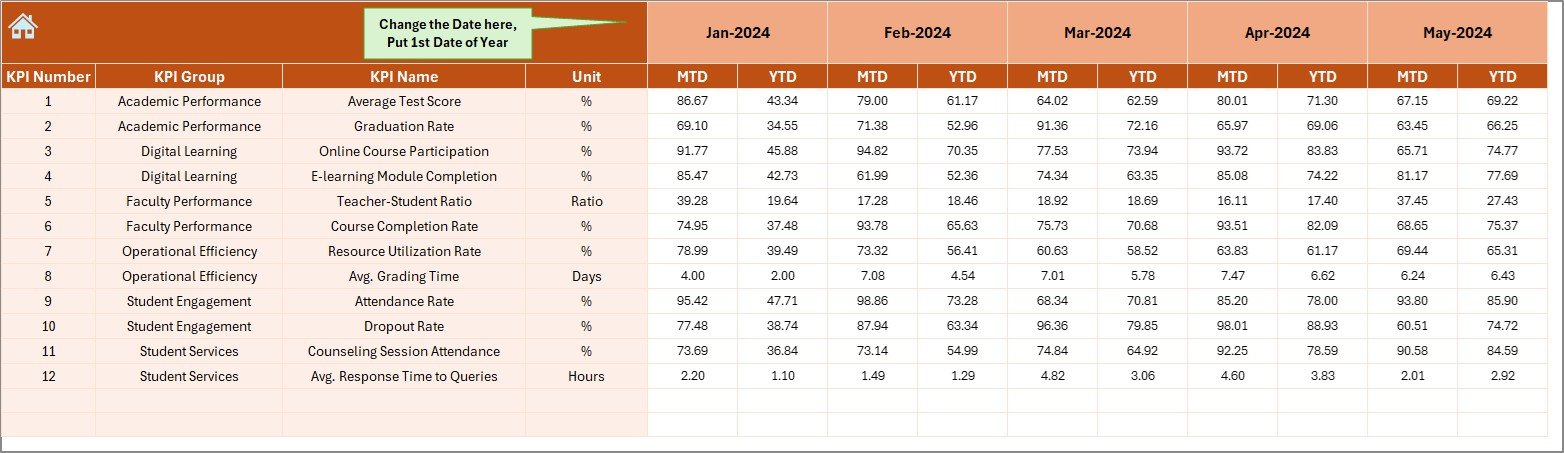
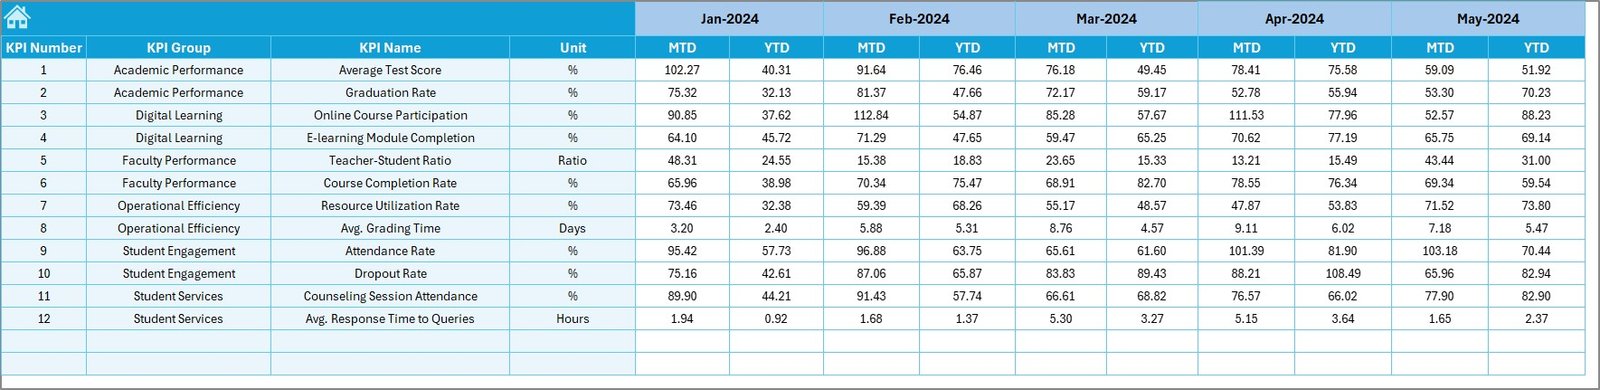
🧾 Actual Numbers Input Sheet for Monthly Updates
Update once and let the dashboard do the work:
📆 Enter your actuals for the selected month
🔄 MTD and YTD figures adjust automatically
🧠 Easy-to-navigate structure, even for Excel beginners
🎯 Target Sheet to Define Your Goals
Set the path for success by entering your benchmarks:
✅ MTD and YTD targets for every KPI
📅 Monthly planning with long-term alignment
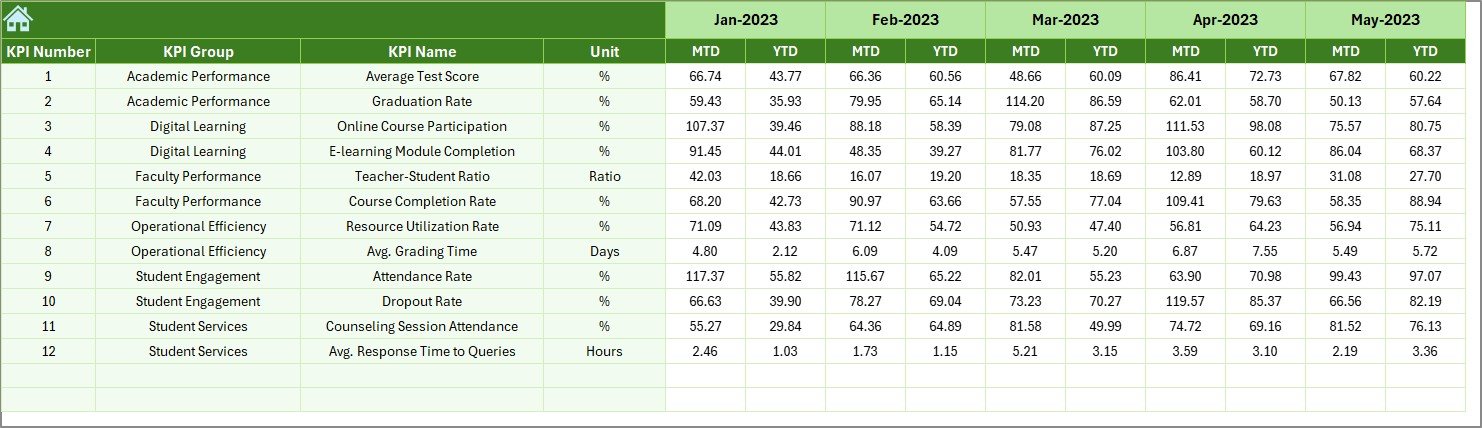
🔁 Previous Year Number Sheet for Growth Analysis
Easily compare this year’s results with last year’s:
📊 View year-over-year progress
🔄 Assess which KPIs improved, and which need attention
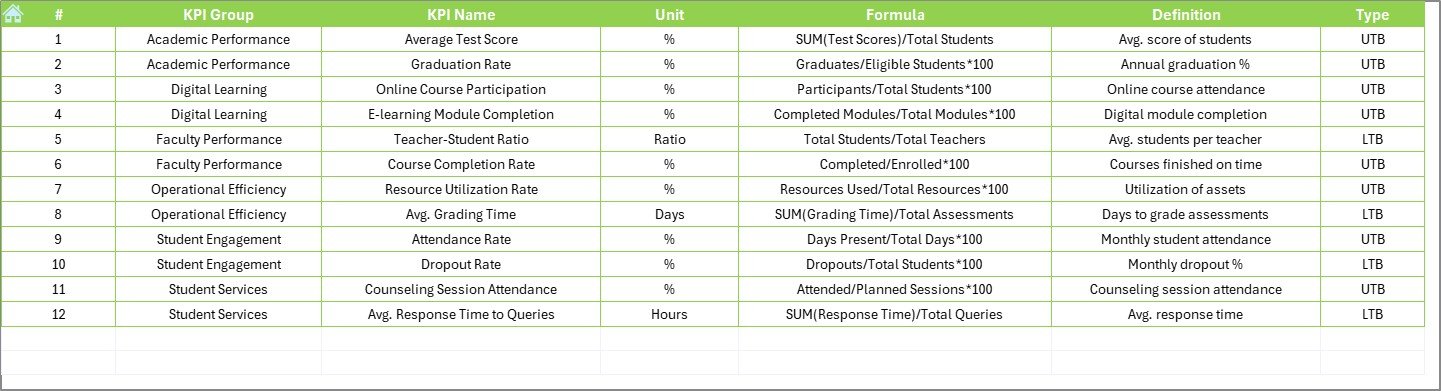
📘 KPI Definition Sheet for Full Clarity
Keep your team aligned with clear definitions:
📌 Define KPI names, categories, units, formulas, and relevance
🧠 Prevent miscommunication with shared understanding
📦 What’s Inside the Dashboard?
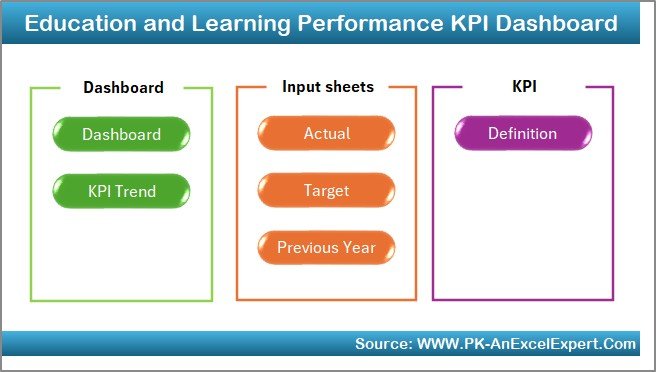
✅ 7 fully automated worksheet tabs
📊 Visual dashboard with slicers and conditional formatting
🧾 Data input and target sheets for monthly updates
📈 Trend charts for KPI monitoring
📘 Full KPI dictionary and editable fields
🔄 Previous year comparisons for long-term evaluation
🛠️ Customizable for any institution’s goals
👩🏫 Who Can Benefit from This Product?
This Excel dashboard is perfect for:
🏫 Schools and colleges tracking academic KPIs
💻 Online learning platforms monitoring course engagement
🏢 Corporate training teams measuring learning effectiveness
🎓 Coaching institutes evaluating student performance
📈 Educational consultants needing data visualization tools
If education is your mission, this dashboard is your compass. 🎯
🧠 How to Use the Education KPI Dashboard
📂 Download and open the Excel file
✏️ Customize KPIs in the KPI Definition tab
🧾 Input monthly Actuals and Targets
🔢 Add last year’s numbers for comparison
📊 Review performance using the Dashboard and Trend tabs
📤 Share insights with team members or decision-makers
No technical skills needed — just data, dedication, and this template!
🔗 Click here to read the Detailed blog post
📺 Visit our YouTube channel to learn step-by-step video tutorials