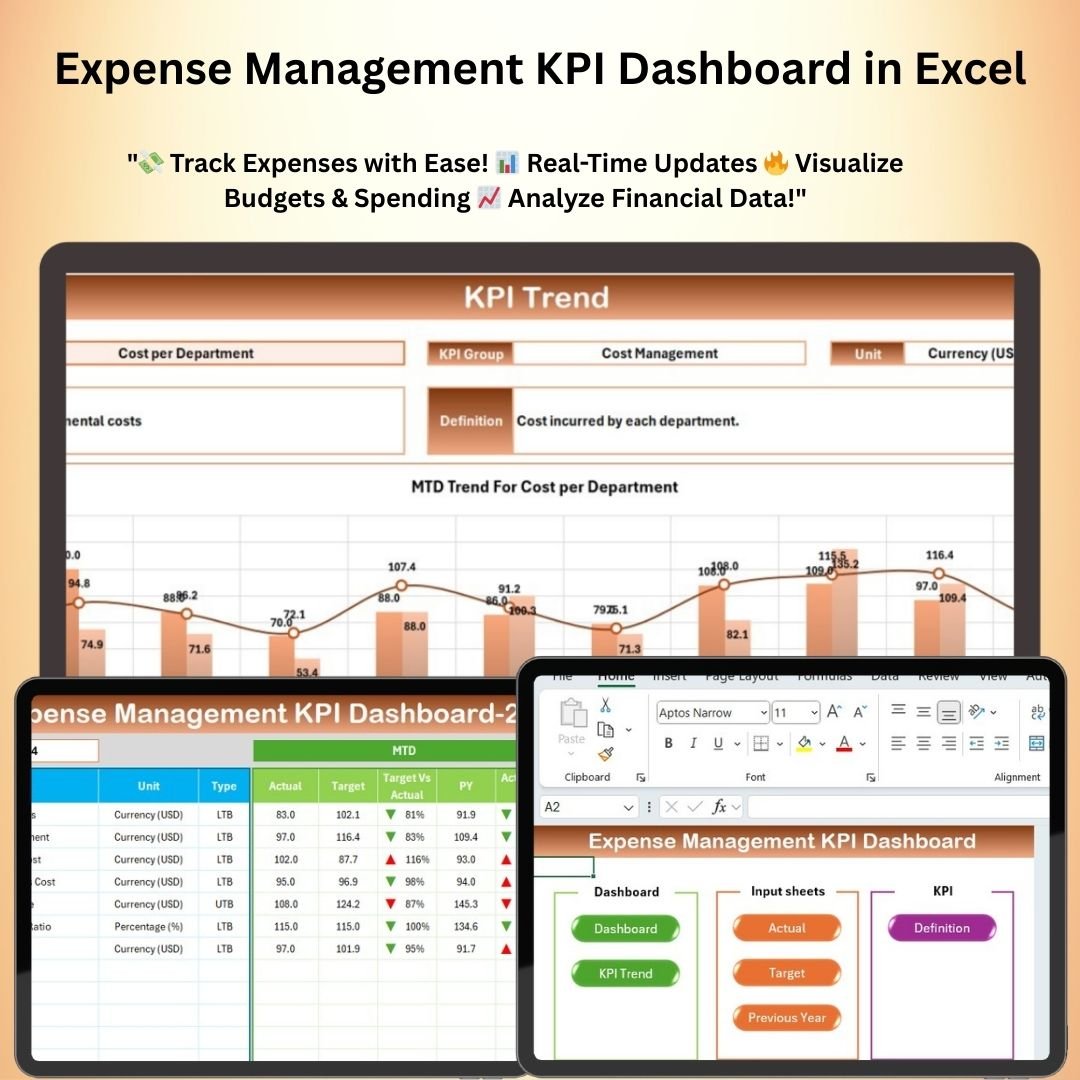
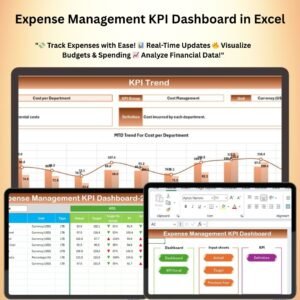
The Expense Management KPI Dashboard in Excel is a powerful tool designed to help businesses and individuals track and manage their expenses effectively. This interactive dashboard provides a visual representation of key expense metrics, allowing you to monitor and optimize your financial performance in real-time. Whether you’re managing a business budget, personal finances, or department spending, this Excel-based KPI dashboard makes it easy to stay on top of your expenses and make informed financial decisions.
With built-in charts, graphs, and automated calculations, this dashboard offers a comprehensive view of your expenses, highlighting trends, variances, and key areas where savings can be achieved. The customizable nature of this dashboard allows you to tailor it to your specific needs, whether you’re tracking expenses by category, department, or project.
Key Features of the Expense Management KPI Dashboard in Excel
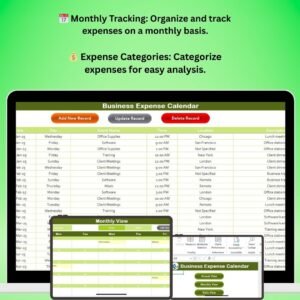
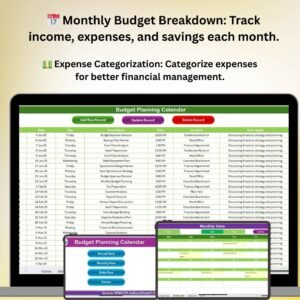
📌 Customizable Expense Categories
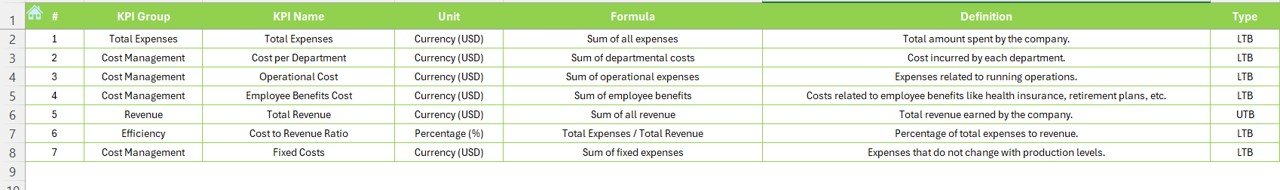
Easily set up and track expenses in multiple categories such as utilities, marketing, payroll, and more. The dashboard allows you to add or modify categories to suit your specific business needs.
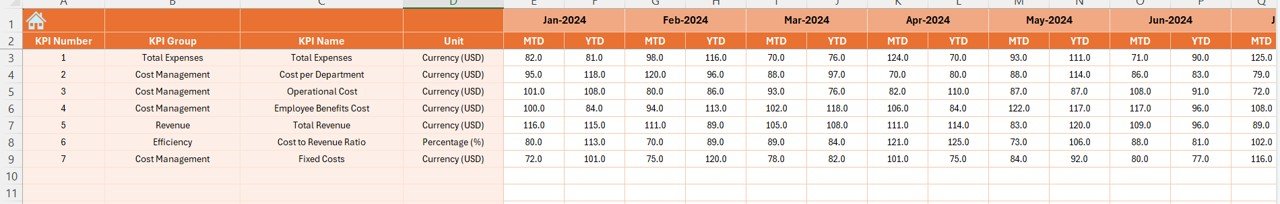
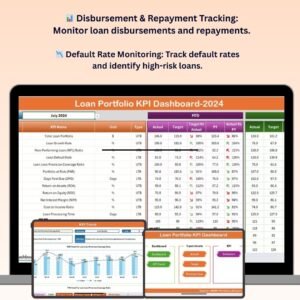
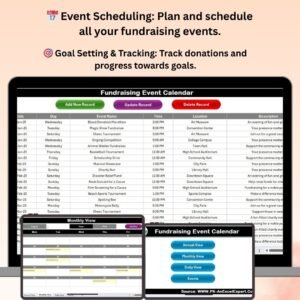
🛠 Dynamic KPI Tracking
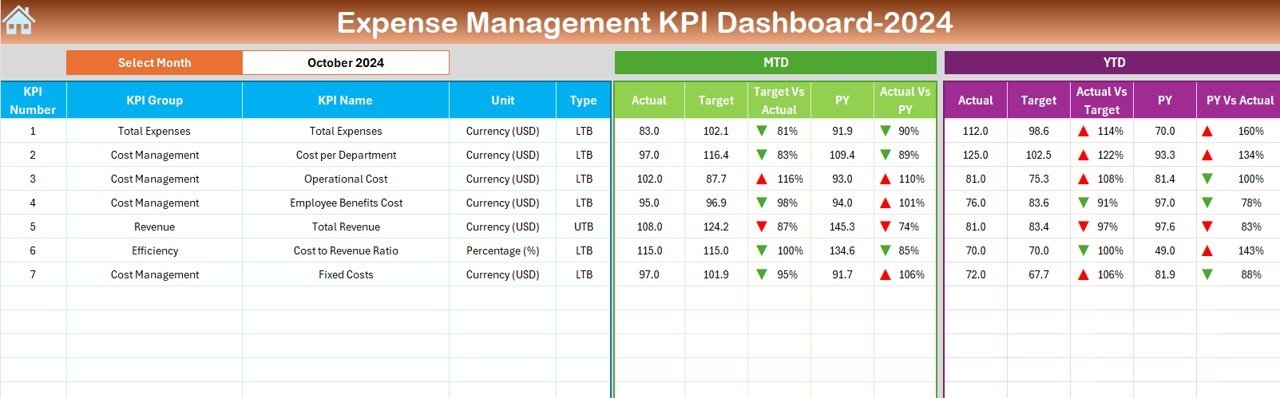
The dashboard includes key performance indicators (KPIs) such as total expenses, variance from budget, and expense trends over time. These KPIs help you quickly assess how well you’re managing your expenses.
💡 Real-Time Updates
As new data is entered, the dashboard automatically updates to reflect changes. This real-time functionality allows you to make timely decisions and adjustments to your budget or spending.
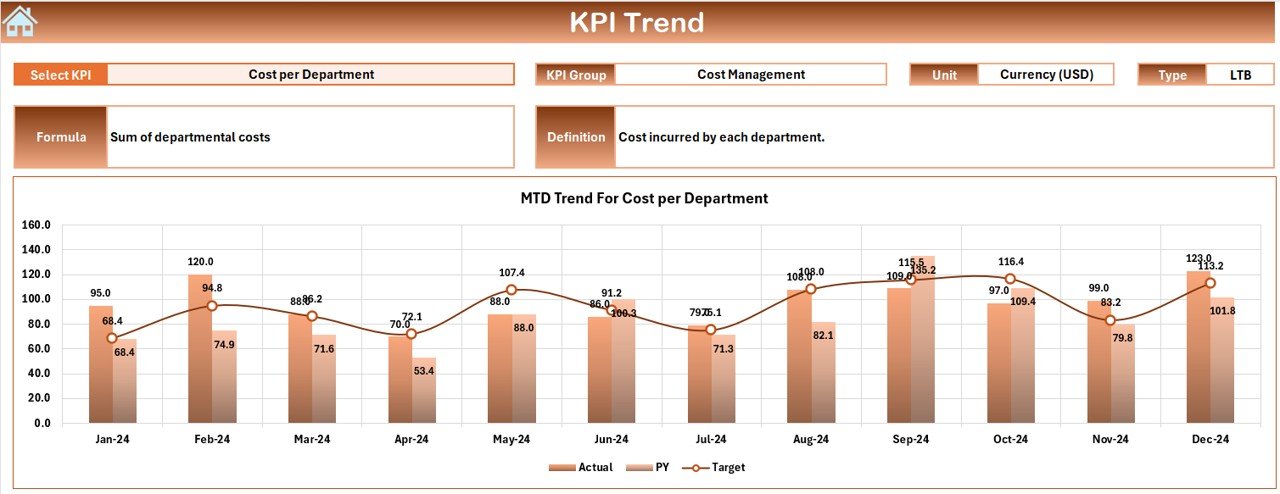
🔢 Data Visualization
Visual charts and graphs help you understand your expenses at a glance. Use bar charts, pie charts, and line graphs to track expenses by category, project, or department, and identify areas that require attention.
🚀 Automated Calculations
The dashboard automates the calculation of totals, variances, and percentages, making it easy to track your financial performance without manual calculations.
📊 Budget vs. Actual Analysis
Compare your budgeted expenses with actual spending to identify areas where you’re over or under budget. This feature helps you manage cash flow and optimize spending.
⚙ User-Friendly Interface
Designed with simplicity in mind, this dashboard is easy to navigate, even for Excel beginners. Set it up quickly and start tracking your expenses in no time.
🚀 Why You’ll Love This Expense Management KPI Dashboard in Excel
✅ Track Expenses Efficiently – Easily monitor and manage expenses with real-time data updates. ✅ Visualize Financial Data – Use charts and graphs to see your financial performance at a glance. ✅ Customizable Categories – Adapt the dashboard to suit your specific expense tracking needs. ✅ Automated Calculations – Save time with automatic calculations of totals, variances, and trends. ✅ Budget Tracking – Compare actual expenses with your budget to control spending and optimize financial resources.
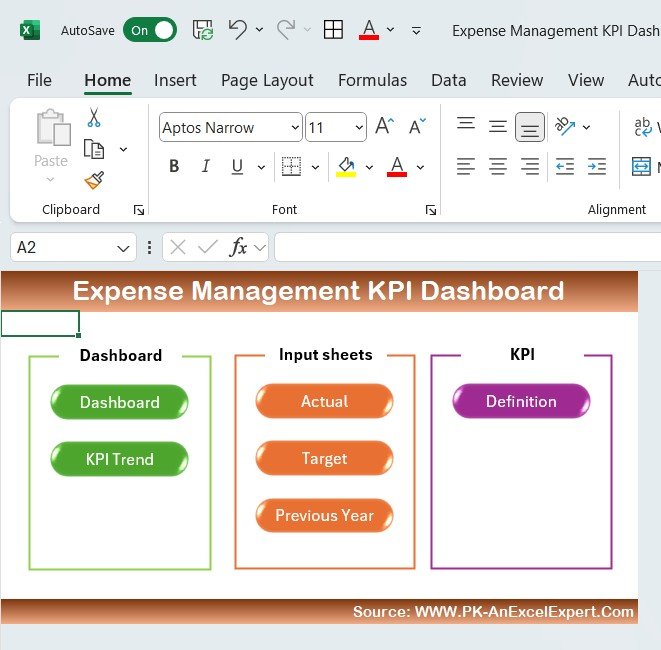
📂 What’s Inside the Expense Management KPI Dashboard in Excel?
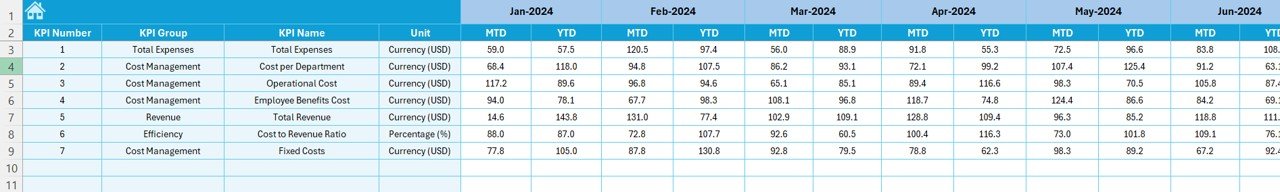
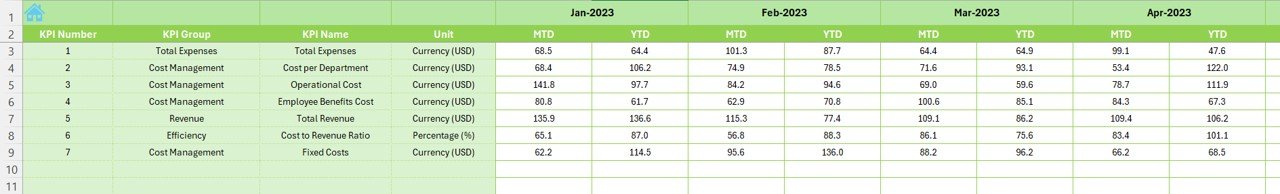
- Expense Categories: Track expenses by category, department, or project.
- KPI Dashboard: Monitor total expenses, variances, and trends.
- Real-Time Updates: Automatic updates when new data is entered.
- Visual Data: Includes pie charts, bar graphs, and line charts for easy data analysis.
- Budget vs. Actual: Analyze variances between budgeted and actual expenses.
🔍 How to Use the Expense Management KPI Dashboard in Excel
1️⃣ Download the Template – Instant access to the Excel file upon purchase. 2️⃣ Customize Categories – Set up expense categories relevant to your business or personal finances. 3️⃣ Input Data – Enter your expenses into the provided fields. 4️⃣ Track Performance – Watch your expenses and KPIs update in real-time. 5️⃣ Analyze Reports – Use the visual charts and budget analysis to make informed financial decisions.
🎯 Who Can Benefit from the Expense Management KPI Dashboard in Excel? 🔹 Business Owners 🔹 Financial Analysts 🔹 Project Managers 🔹 Marketing Teams 🔹 HR and Operations Teams 🔹 Anyone looking to manage their expenses efficiently
Take control of your finances with the Expense Management KPI Dashboard in Excel. With its customizable features, real-time updates, and visual tracking capabilities, this dashboard is the perfect tool for anyone looking to streamline their expense management process.
Click here to read the Detailed blog post
https://www.pk-anexcelexpert.com/expense-management-kpi-dashboard-in-excel/
Visit our YouTube channel to learn step-by-step video tutorials
Visit our YouTube channel to learn step-by-step video tutorials


Reviews
There are no reviews yet.