
In the modern education system, data-driven decisions are no longer optional—they’re essential. Whether you’re managing a school, university, training institute, or a government-led education initiative, the Education and Learning Sustainability KPI Dashboard in Excel empowers you to measure, monitor, and optimize your learning outcomes and sustainability efforts with precision.
This Excel-based dashboard isn’t just a collection of charts and tables—it’s a strategic command center that helps you visualize and evaluate your most important educational KPIs. With monthly and year-to-date (MTD/YTD) views, conditional formatting, and customizable KPI definitions, this template is built for real-time insights and long-term impact.
✨ Key Features of Education and Learning Sustainability KPI Dashboard
📍 Home Sheet Navigation
Jump between sheets effortlessly using pre-built navigation buttons.
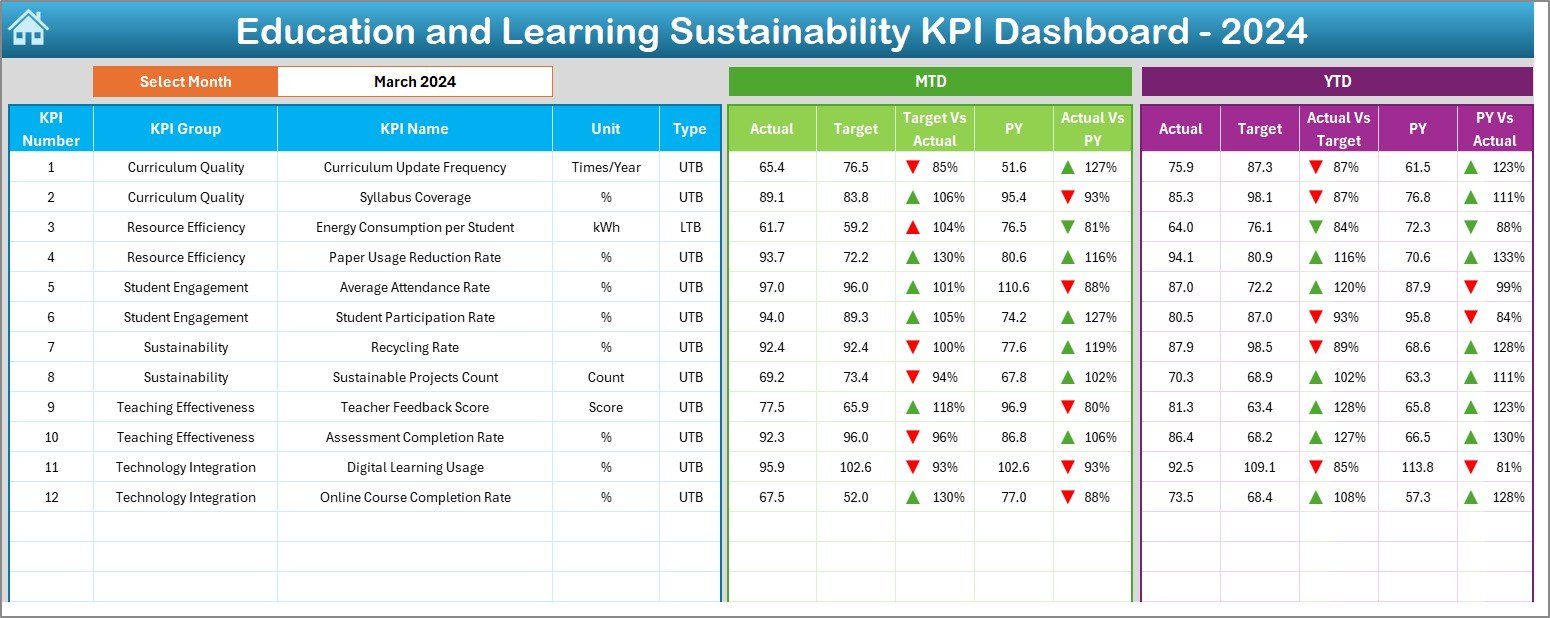
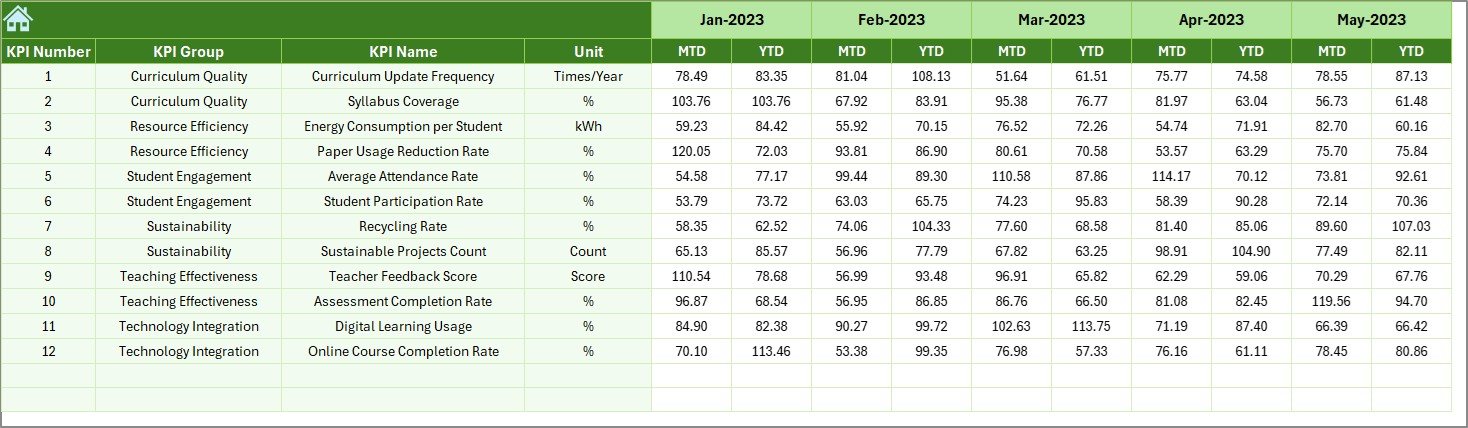
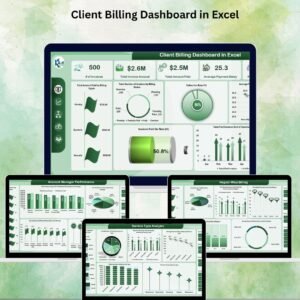
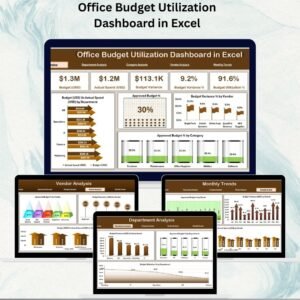
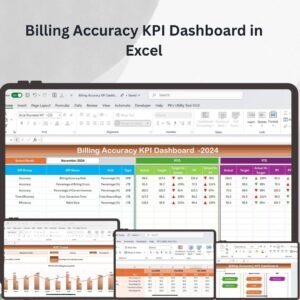
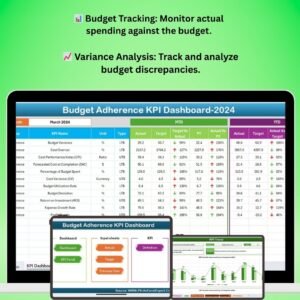
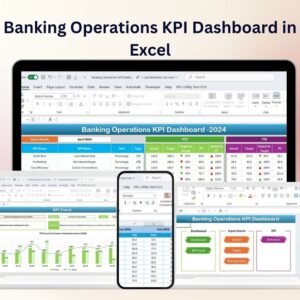
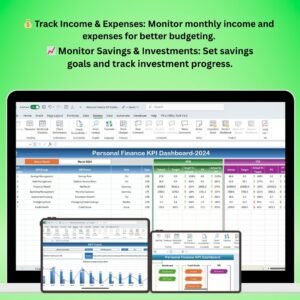
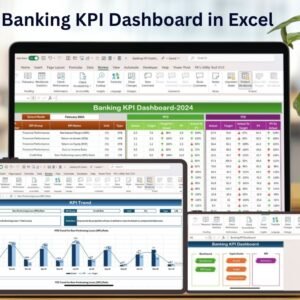
📊 Interactive Dashboard Sheet
Select a month from a dropdown and instantly update MTD/YTD metrics.
Visual indicators (up/down arrows) show performance against targets and last year’s numbers.
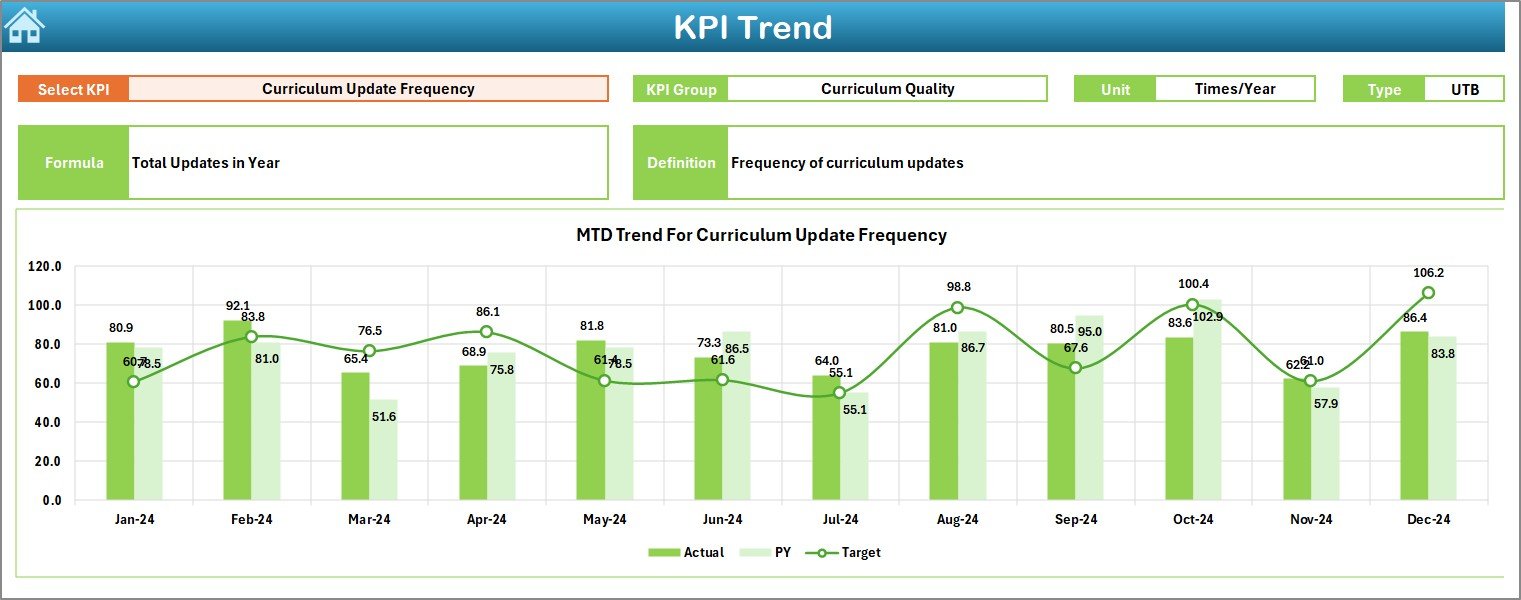
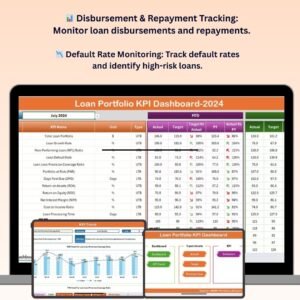
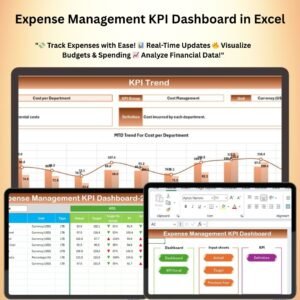
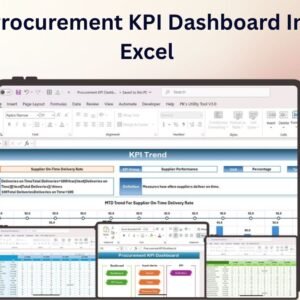
📈 KPI Trend Visualization
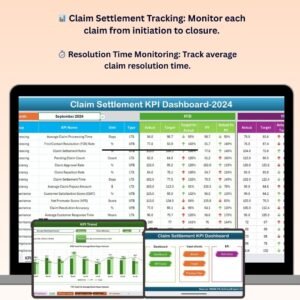
Track individual KPI trends over time—ideal for evaluating student engagement, graduation rates, and more.
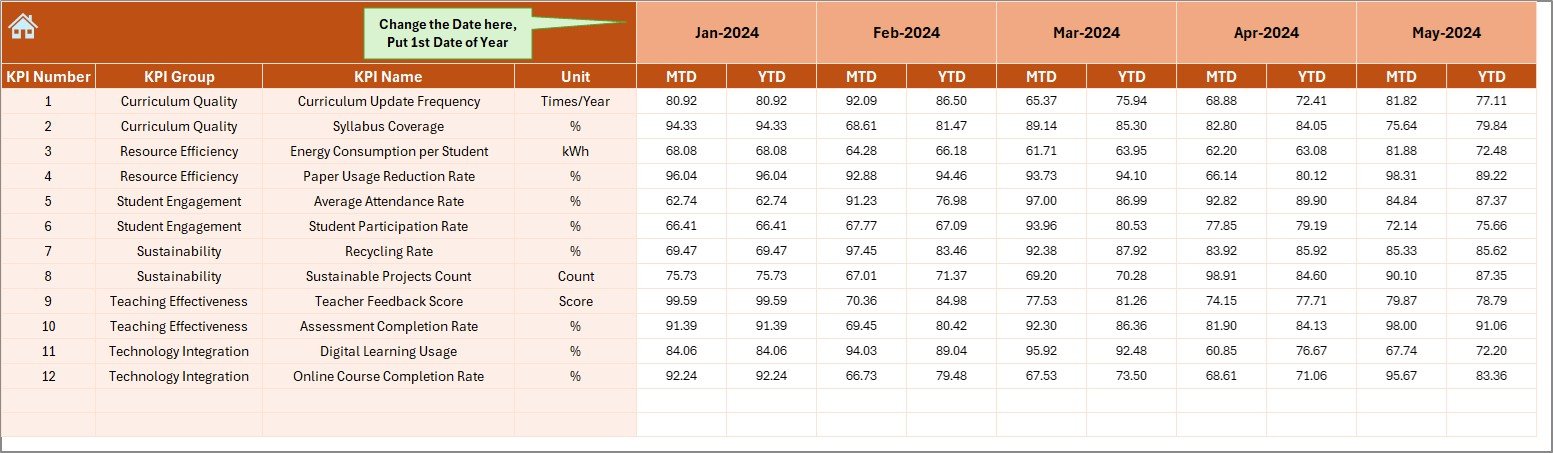
📝 Actual & Target Data Entry Tabs
Dedicated sheets for actual numbers, targets, and previous year comparisons make updates smooth and error-free.
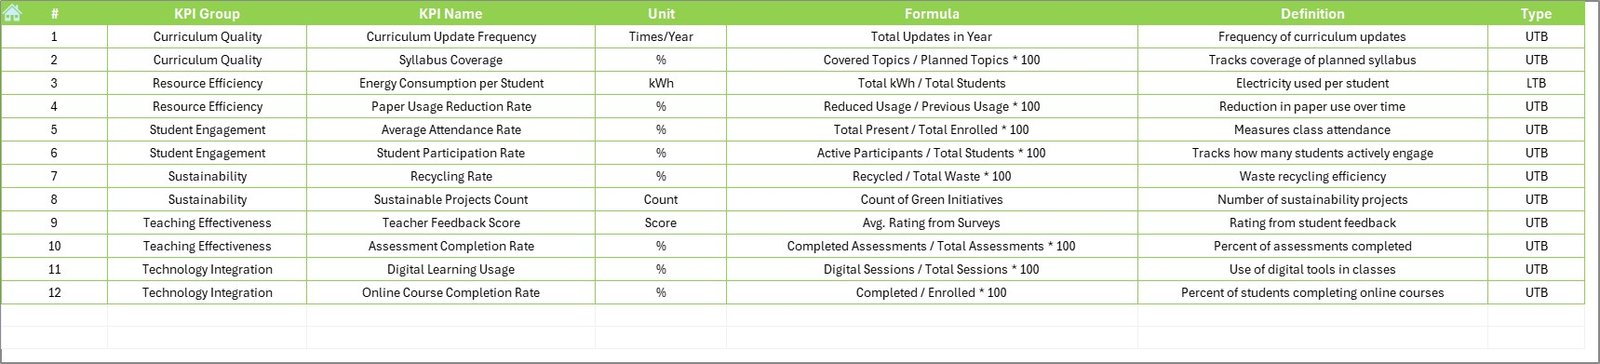
📘 KPI Definition Sheet
Every KPI is defined clearly with unit, group, formula, and classification (UTB/LTB).
🔐 Customizable & Scalable
Add or remove KPIs, tailor the dashboard to your institution’s needs, and incorporate your branding.
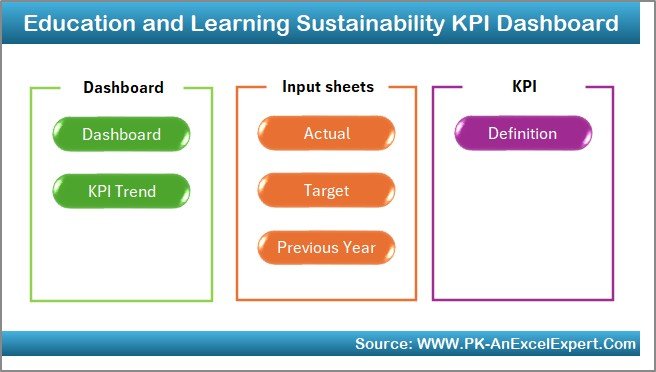
📦 What’s Inside the Education and Learning Sustainability KPI Dashboard
-
📍 Home Sheet: Acts as a dashboard index with 6 navigation buttons
-
📊 Dashboard Sheet: Central place for KPI visualizations and dropdown filters
-
📈 KPI Trend Sheet: Select any KPI to explore trendlines over months and years
-
📝 Actual Numbers Input Sheet: Input MTD and YTD data manually
-
🎯 Target Sheet: Set your MTD/YTD targets for each KPI
-
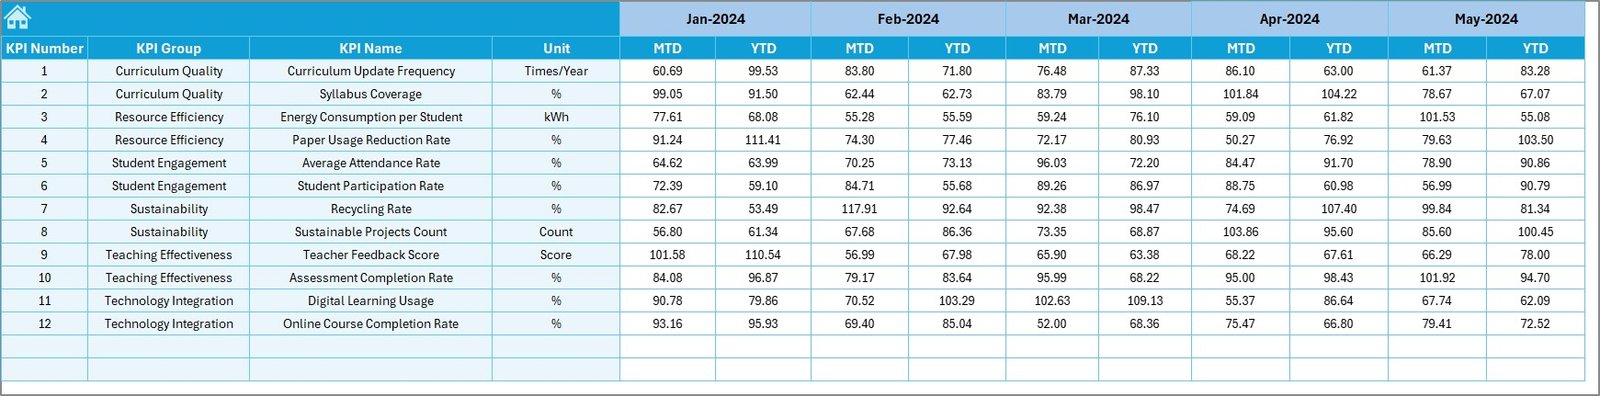
📆 Previous Year Sheet: Store historical monthly data for accurate comparisons
-
📘 KPI Definition Sheet: Contains names, units, formulas, and definitions for each KPI
🧠 How to Use the Education & Learning KPI Dashboard
-
📝 Start by entering your actual data in the Actual Numbers Input sheet
-
🎯 Input monthly targets in the Target Sheet
-
📆 Populate previous year numbers for benchmarking
-
📊 Use the Dashboard and KPI Trend Sheet to monitor performance
-
🧩 Customize KPI groups, definitions, and chart visuals as needed
👥 Who Can Benefit from This Dashboard?
🎓 School Principals & University Deans – Oversee overall education health and outcomes
📈 Academic Coordinators & Data Analysts – Track student performance and curriculum efficiency
📋 NGOs in Education – Measure impact and sustainability metrics
🏛 Government Education Departments – Monitor district-wide or state-wide performance
🧑🏫 Corporate Training Managers – Ensure skill development programs meet sustainability targets
🌟 Why You Need This Dashboard
-
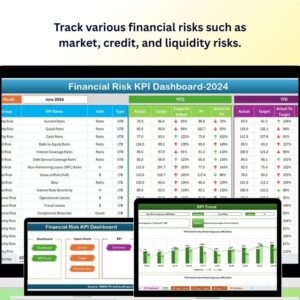
📊 Make data-driven decisions to enhance student outcomes and sustainability practices
-
⏱ Save time with pre-built templates and instant dashboard updates
-
🧩 Customize your KPIs based on institutional priorities
-
🧠 Gain deep insights into trends and historical comparisons
-
📈 Improve accountability across departments and stakeholders
✅ Click here to read the Detailed blog post
📺 Visit our YouTube channel to learn step-by-step video tutorials
👉 youtube.com/@PKAnExcelExpert


Reviews
There are no reviews yet.