
In today’s fast-paced financial markets, commodities trading organizations must process and analyze massive volumes of trading data every day. Traders manage multiple exchanges, counterparties, contract structures, settlements, brokerage costs, and regional performance simultaneously. However, relying on scattered spreadsheets and manual reporting often leads to delayed decisions, operational inefficiencies, and missed trading opportunities.
The Commodities Trading Dashboard in Power BI is a powerful, ready-to-use analytics solution designed to transform complex trading data into clear, interactive, and actionable insights. Built using Microsoft Power BI, this dashboard enables traders, analysts, and management teams to monitor trading performance in real time through dynamic visual reports and Key Performance Indicators (KPIs).
Instead of reviewing multiple reports separately, users can analyze all trading activities from one centralized platform. Consequently, organizations improve settlement tracking, evaluate brokerage performance, identify profitable trading strategies, and make faster data-driven decisions.
Power BI’s interactive filtering, drill-down analysis, and automated data refresh capabilities allow users to explore trading insights instantly. As soon as trading data updates, visuals automatically reflect the latest performance metrics. Therefore, decision-makers always work with accurate and up-to-date information.
The dashboard is structured into multiple analytical pages, each focusing on a specific dimension of trading performance. This structured approach allows users to move seamlessly from high-level summaries to detailed operational analysis.
Whether managing commodity futures, spot trades, or multi-region trading operations, this dashboard provides complete visibility into trading performance. As a result, organizations enhance transparency, reduce operational risks, and improve profitability.
📊 Key Feature of Commodities Trading Dashboard in Power BI
📈 Real-Time Trading Performance Monitoring
Track trading activity instantly using dynamic Power BI visuals.
📊 Interactive KPI Dashboard
Understand trade volume, settlements, and brokerage performance at a glance.
🔎 Dynamic Filters & Drill-Down Analysis
Analyze performance by exchange, contract type, region, or counterparty.
💰 Brokerage Performance Insights
Monitor brokerage expenses and trader contributions effectively.
⏱ Settlement Tracking Visibility
Identify pending settlements quickly to reduce operational risks.
🌍 Regional Trading Analysis
Compare trading performance across multiple geographic markets.
📅 Monthly Trend Analysis
Discover seasonal trading patterns and growth opportunities.
⚡ Automated Data Refresh
Dashboards update automatically when source data changes.
📦 What’s Inside the Commodities Trading Dashboard in Power BI
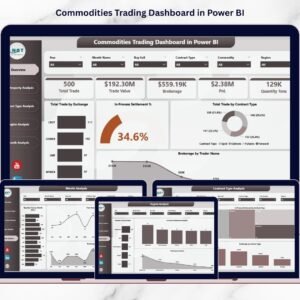
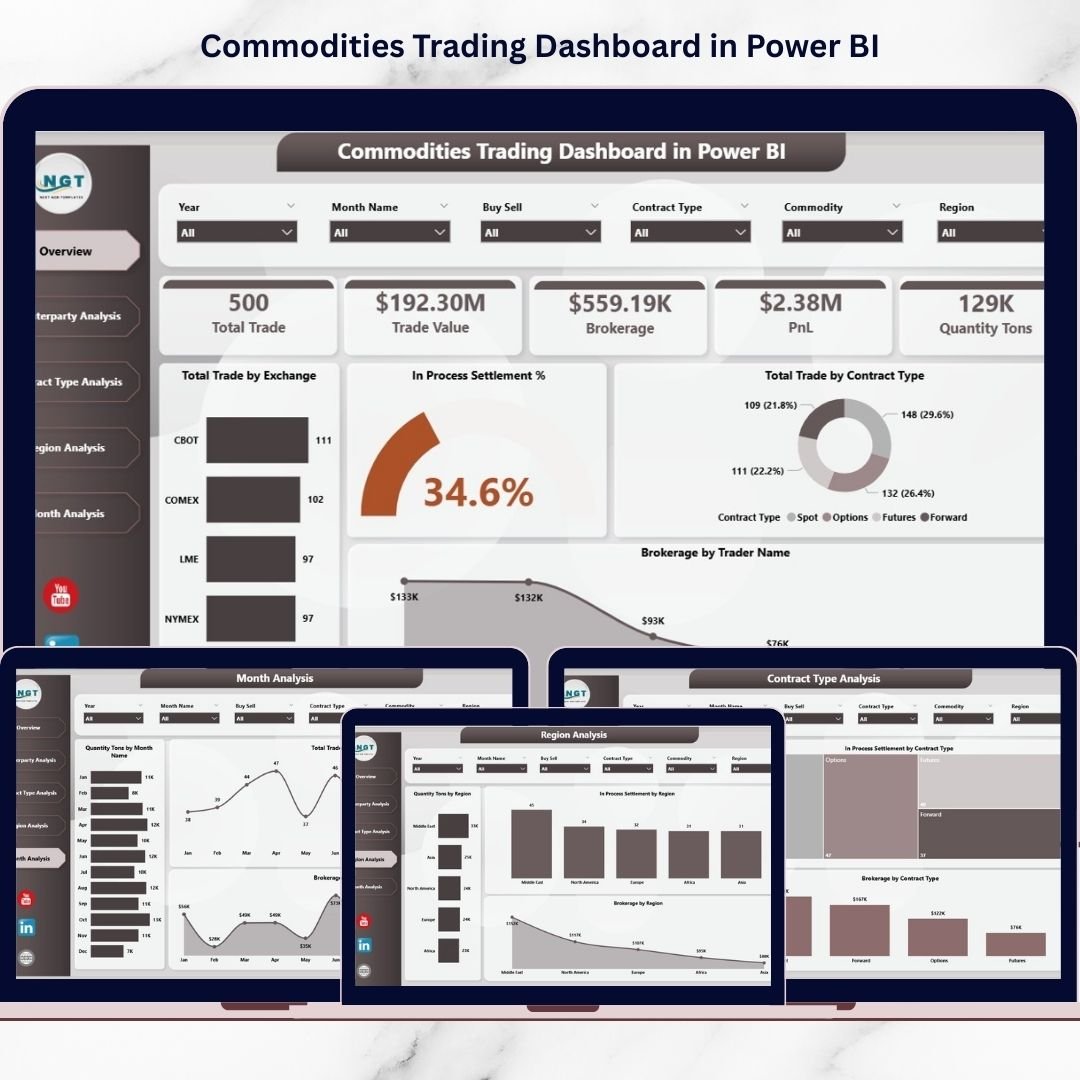
The dashboard includes five interactive analytical pages, each designed to deliver focused insights.
🔹 1. Overview Page – Central Trading Performance Hub
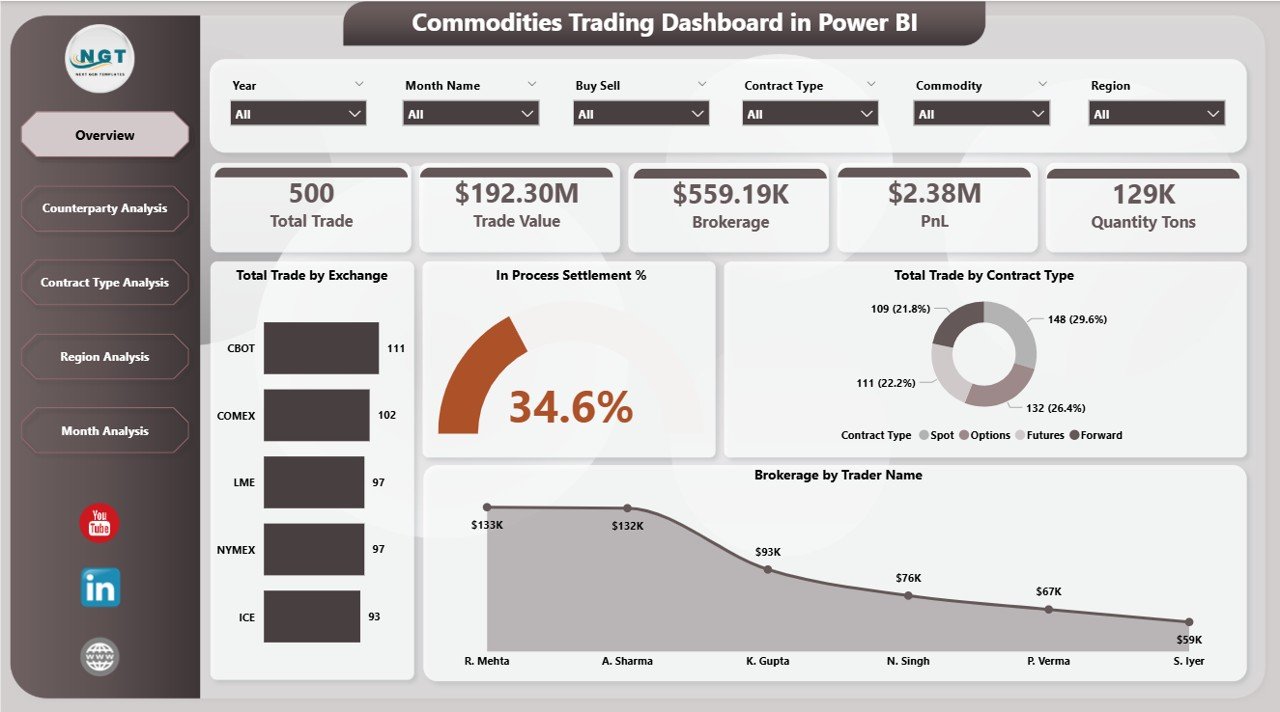
The Overview page acts as the main control panel.
Key Metrics
Total Trade by Exchange
In-Process Settlement %
Total Trade by Contract Type
Brokerage by Trader Name
Managers instantly evaluate trading performance and operational health.
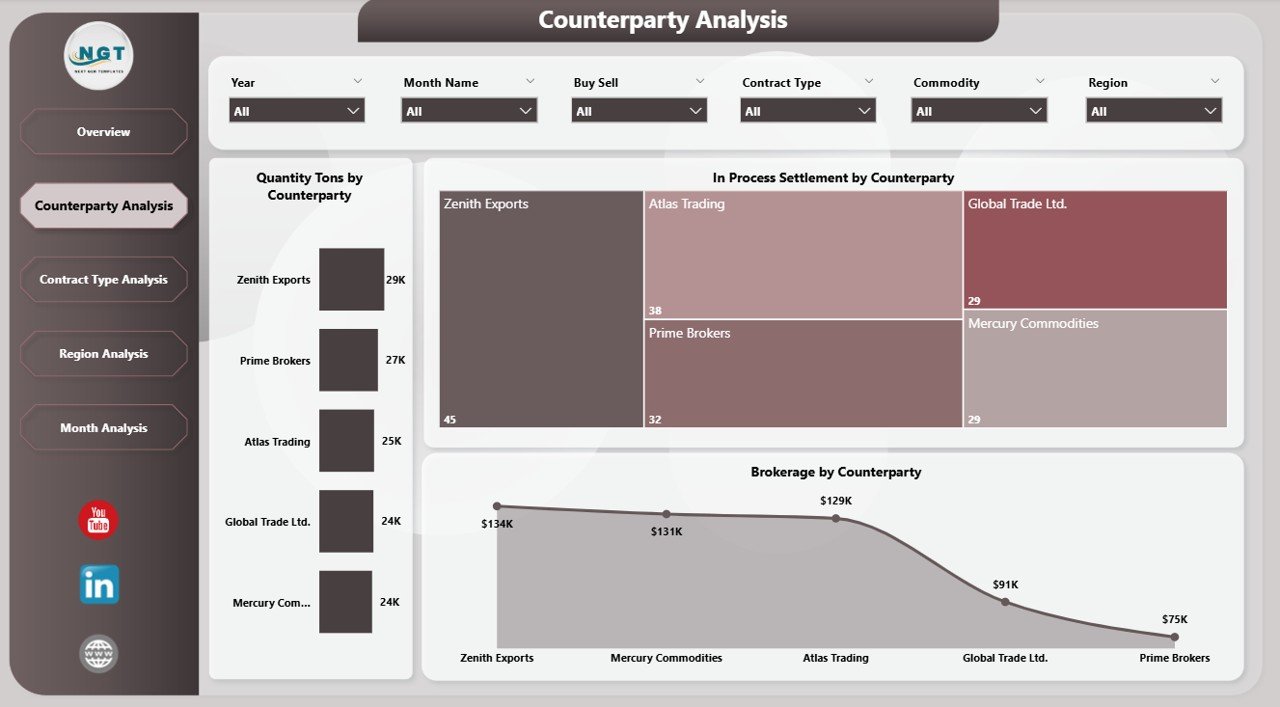
🔹 2. Counterparty Analysis – Trading Relationship Insights
This page analyzes partner performance.
Charts Included
Quantity (Tons) by Counterparty
In-Process Settlement by Counterparty
Brokerage by Counterparty
Helps organizations strengthen profitable partnerships and manage counterparty risks.
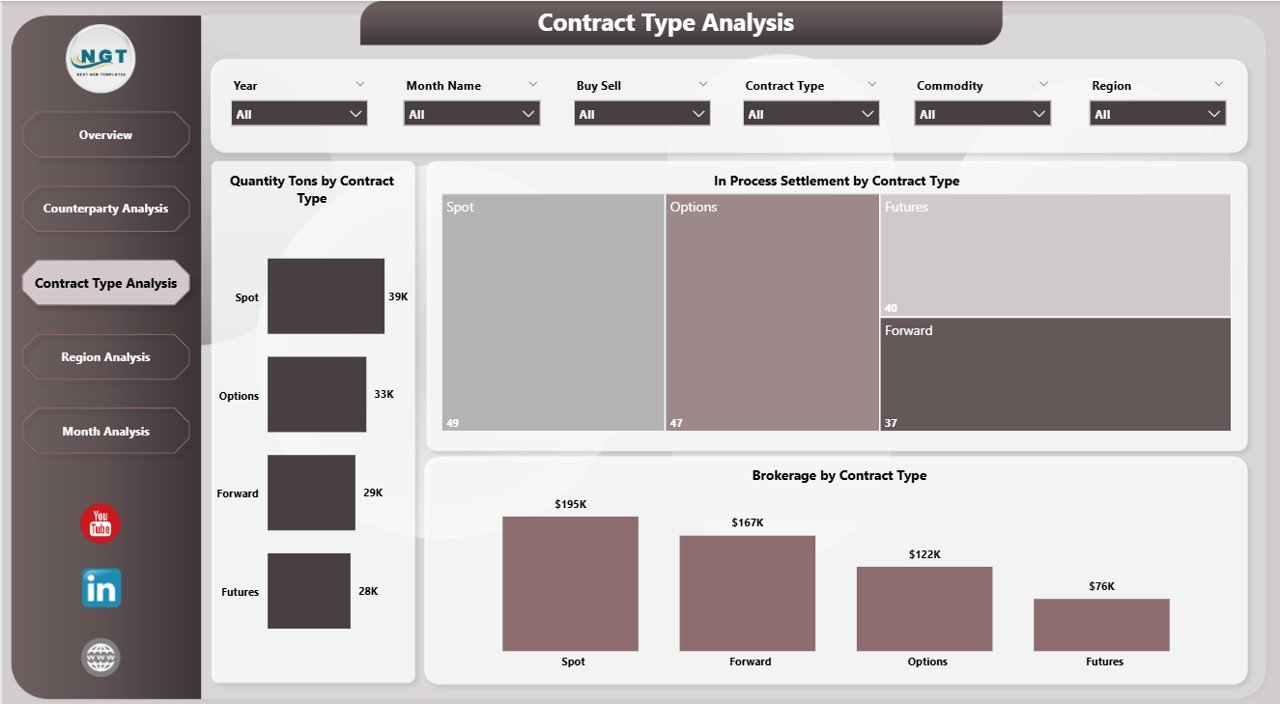
🔹 3. Contract Type Analysis – Trade Structure Performance
Evaluates performance across contract categories.
Visualizations
Quantity Tons by Contract Type
Settlement Status by Contract Type
Brokerage by Contract Type
Supports optimization of trading strategies and contract allocation.
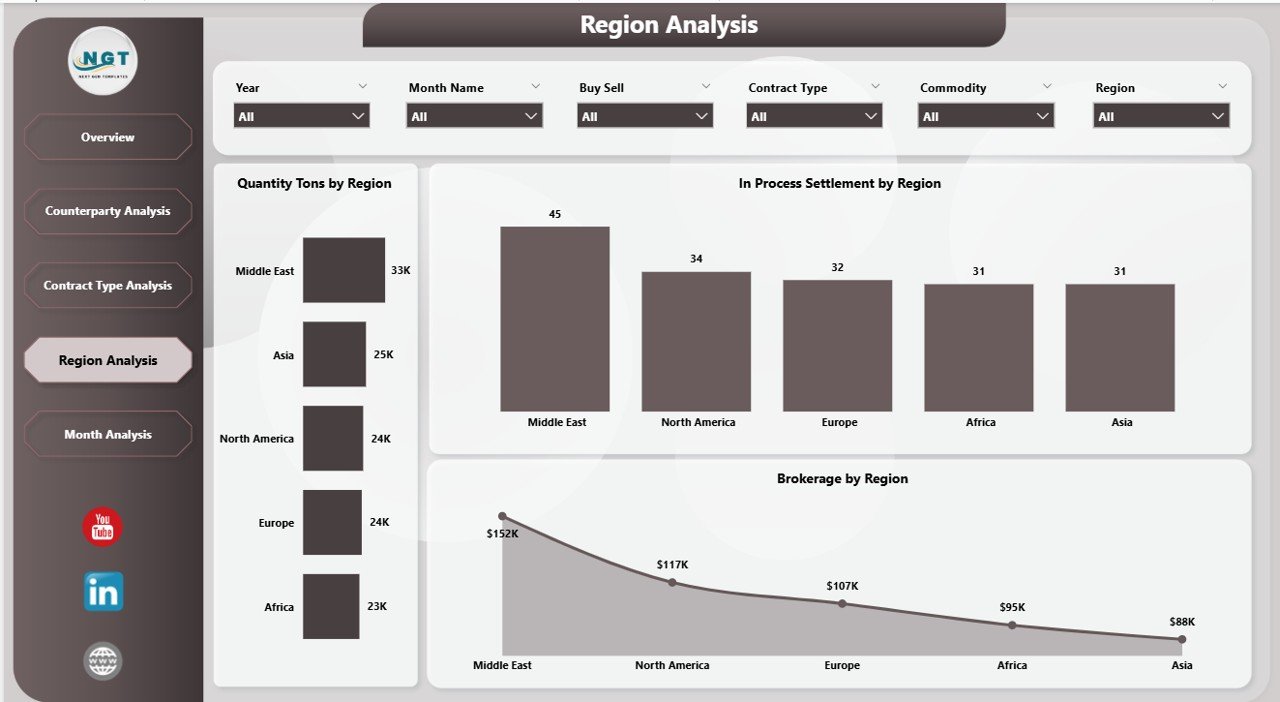
🔹 4. Region Analysis – Geographic Trading Intelligence
Provides regional trading insights.
Charts Included
Quantity Tons by Region
Settlement Status by Region
Brokerage by Region
Allows organizations to identify high-performing markets and improve regional strategies.
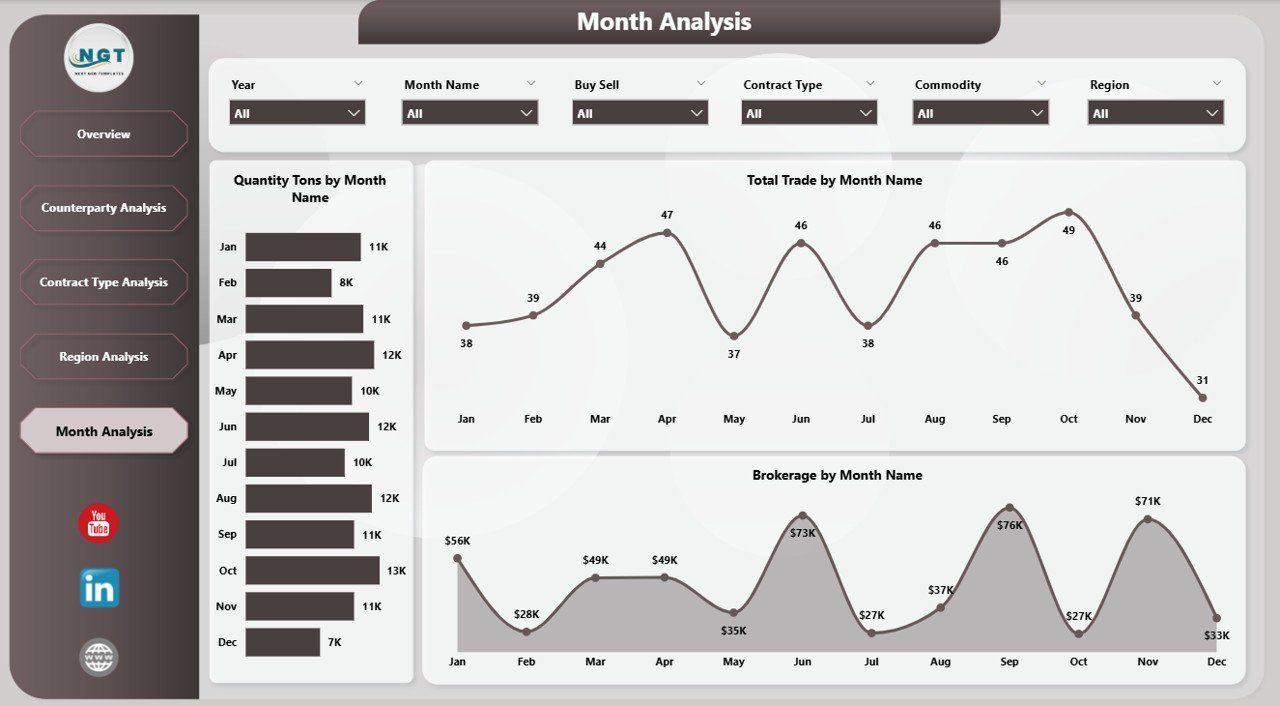
🔹 5. Month Analysis – Trend Monitoring Over Time
Tracks trading performance trends.
Metrics
Quantity Tons by Month
Total Trade by Month
Brokerage by Month
Enables forecasting and data-driven planning.
⚙️ How to Use the Commodities Trading Dashboard in Power BI
1️⃣ Import trading data into Power BI.
2️⃣ Structure datasets with exchanges, counterparties, and contracts.
3️⃣ Refresh the dashboard automatically.
4️⃣ Use slicers to filter analysis dynamically.
5️⃣ Review KPIs and visuals for insights.
The dashboard requires minimal technical expertise.
👥 Who Can Benefit from This Dashboard
Ideal users include:
✔ Commodity Traders
✔ Trading Analysts
✔ Brokerage Firms
✔ Risk Management Teams
✔ Financial Controllers
✔ Trading Operations Managers
Because of interactive visuals, both technical and non-technical users can analyze performance easily.
🚀 How This Dashboard Improves Trading Decisions
Organizations can:
✅ Monitor settlement efficiency continuously
✅ Track brokerage costs accurately
✅ Identify profitable trading patterns
✅ Detect operational risks early
✅ Improve collaboration using centralized reporting
Ultimately, trading teams move from reactive reporting to proactive decision-making.
### Click here to read the Detailed blog post
Visit our YouTube channel to learn step-by-step video tutorials
👉 https://youtube.com/@PKAnExcelExpert