
Derivatives trading operates in a fast-moving, high-risk environment where decisions must be taken quickly and accurately. When performance data is scattered across Excel files, emails, and static reports, it becomes difficult to track targets, identify risks, and understand trends. Derivatives Trading KPI Dashboard in Power BI That is exactly why the Derivatives Trading KPI Dashboard in Power BI is designed—to give trading teams complete clarity, control, and confidence from a single interactive dashboard.
This ready-to-use digital product transforms complex derivatives trading data into simple, visual, and actionable insights. By combining the flexibility of Excel with the powerful visualization capabilities of Power BI, Derivatives Trading KPI Dashboard in Power BI this dashboard enables users to monitor Month-to-Date (MTD), Year-to-Date (YTD), Target vs Actual, and Previous Year performance without manual reporting effort. As a result, teams move from reactive analysis to proactive decision-making.
Whether you manage a trading desk, oversee risk exposure, or track performance at a leadership level, this dashboard works as a real-time control panel for derivatives trading operations.
🚀 Key Features of Derivatives Trading KPI Dashboard in Power BI
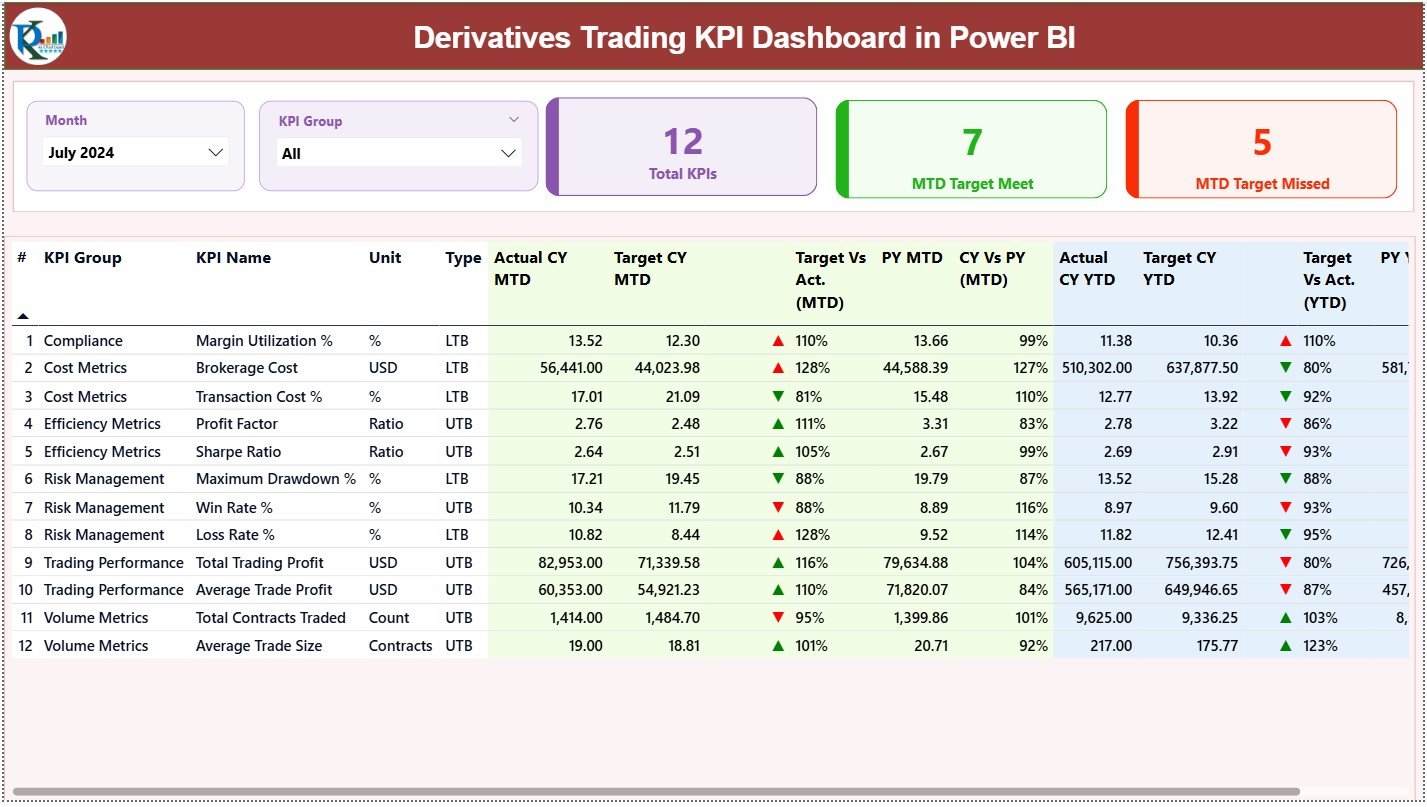
📊 Interactive Summary Page – Instantly view overall KPI health with Total KPIs, Target Met, and Target Missed cards
📅 Month & KPI Group Slicers – Dynamically filter performance with a single click
🎯 MTD & YTD Tracking – Monitor short-term and long-term performance in one dashboard
📈 Target vs Actual Analysis – Identify gaps and achievements clearly
📉 Previous Year Comparison – Analyze CY vs PY trends for both MTD and YTD
🔼 Visual KPI Indicators – Green and red arrows for quick performance signals
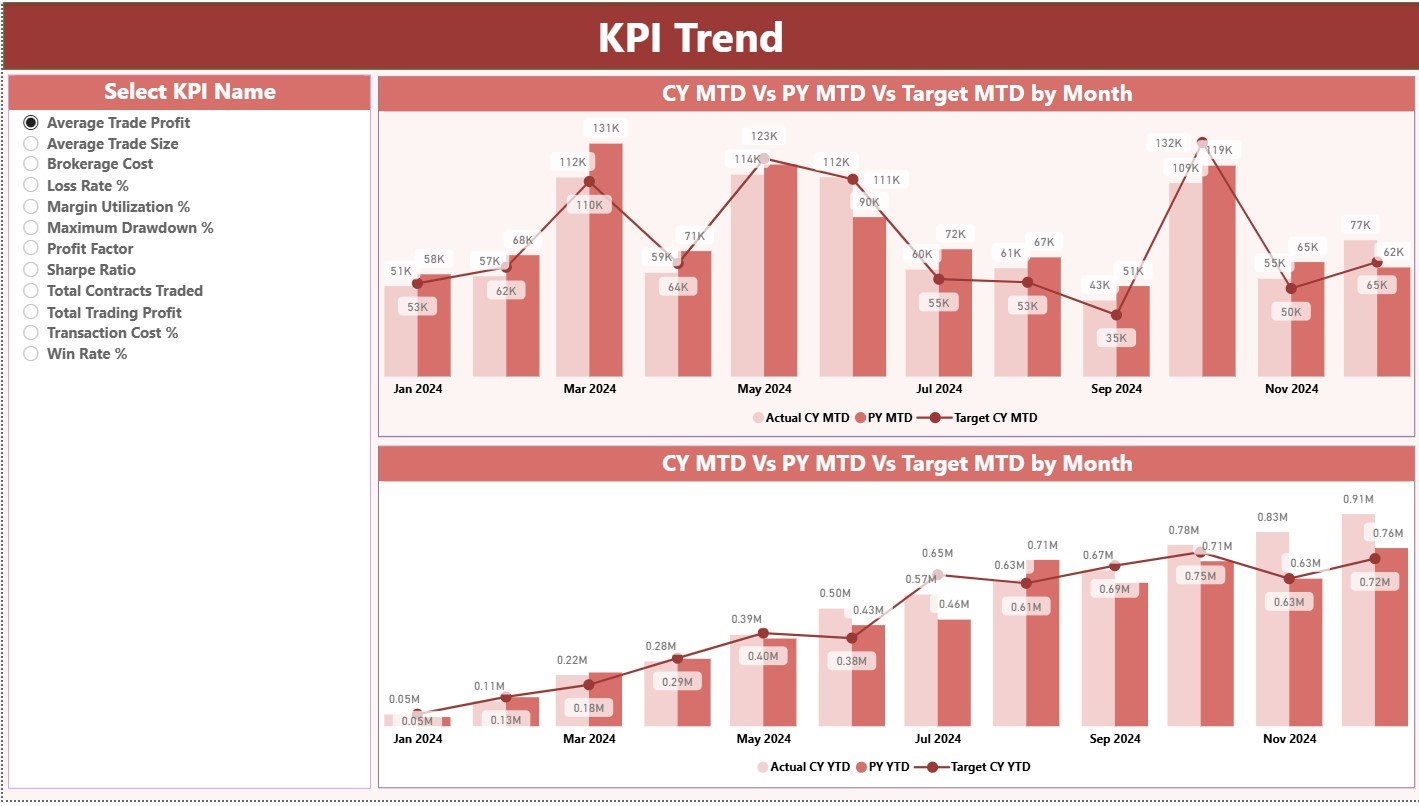
📊 Trend Analysis Page – Track KPI movement over time using combo charts
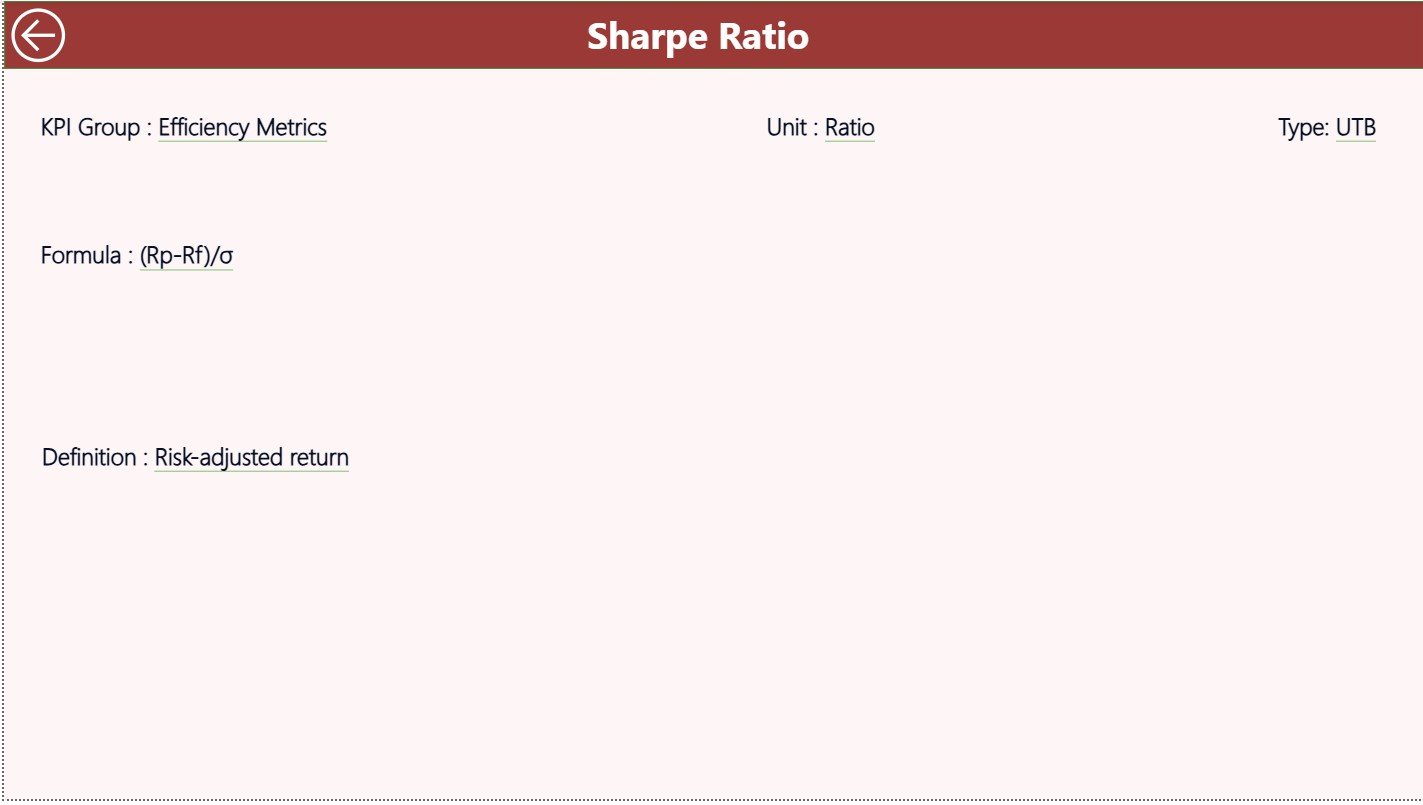
📘 KPI Definition Page – View KPI formula, unit, definition, and LTB/UTB logic
🔄 Excel-Driven Data Source – Easy updates without advanced Power BI skills
📦 What’s Inside the Derivatives Trading KPI Dashboard in Power BI
📁 Power BI Dashboard File (.pixy) with 3 structured pages
📄 Excel Input Template with:
-
Input Actual sheet
-
Input Target sheet
-
KPI Definition sheet
📊 Pre-built Calculations for: -
Target vs Actual (MTD & YTD)
-
CY vs PY (MTD & YTD)
📘 Well-structured KPI Framework with groups, units, formulas, and KPI types
🎯 Ready-to-Use Design that can be customized for any derivatives trading setup
🛠️ How to Use the Derivatives Trading KPI Dashboard in Power BI
1️⃣ Enter Actual performance data in the Input Actual Excel sheet
2️⃣ Enter Target values in the Input Target Excel sheet
3️⃣ Define KPIs clearly in the KPI Definition sheet
4️⃣ Open the Power BI file and refresh the data
5️⃣ Use slicers to analyze performance by Month and KPI Group
6️⃣ Drill into trends and KPI definitions for deeper insights
No advanced Power BI knowledge is required—simple Excel updates do the job.
👥 Who Can Benefit from This Derivatives Trading KPI Dashboard in Power BI
💼 Derivatives Traders – Track performance and trends with clarity
📊 Trading Desk Managers – Monitor targets and team efficiency
⚠️ Risk Management Teams – Identify underperformance and risk patterns early
📈 Portfolio Managers – Analyze trends and year-over-year movement
📑 Finance & Performance Analysts – Reduce manual reporting effort
🏢 Senior Management & Leadership – Gain instant visibility for strategic decisions
🔗 Click here to read the Detailed Blog Post
🎥 Visit our YouTube Channel to learn step-by-step video tutorials


Reviews
There are no reviews yet.