

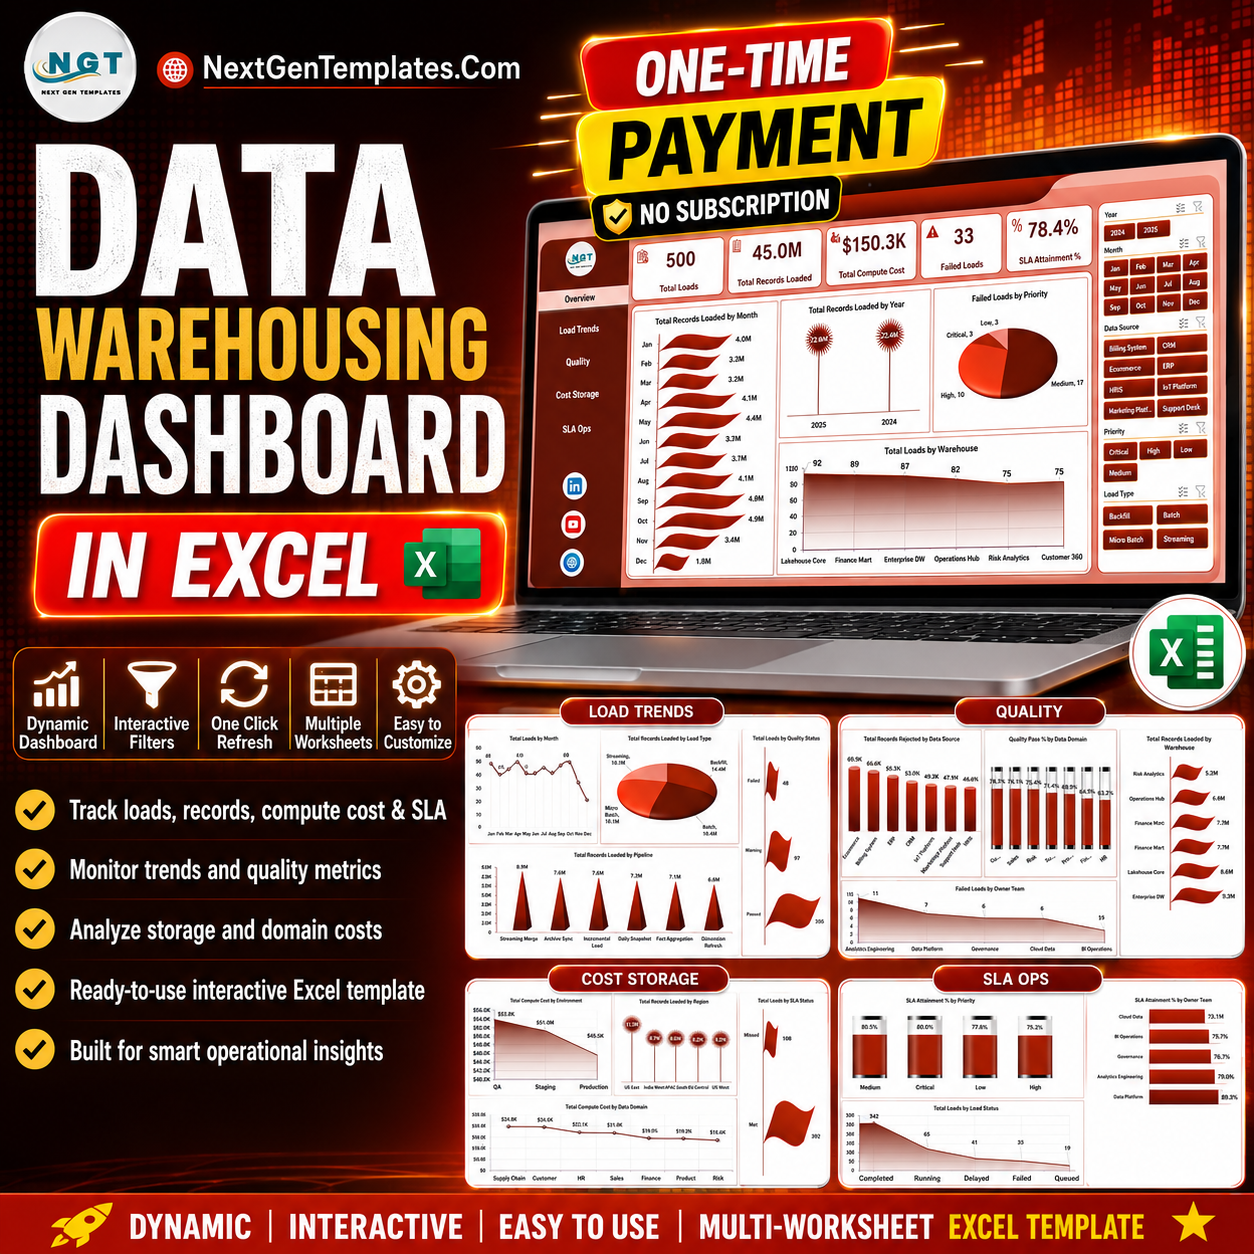

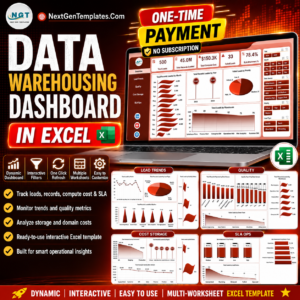
The Data Warehousing Dashboard in Excel tracks 5 core KPIs — Total Loads, Total Records Loaded, Total Compute Cost, Failed Loads, and SLA Attainment % — across 5 interactive report pages with 19 pre-built charts and native slicers. Setup takes under 10 minutes: paste your load logs into the Data sheet, click Refresh All, and every pivot, chart, and KPI updates automatically.
🌍 Join 8,400+ teams in 40+ countries using NextGenTemplates to replace paid SaaS tools with one-time-purchase Excel, Google Sheets, Power BI, and HTML templates.
✅ Instant download · One-time payment · No subscription · No per-user fees · Lifetime access
🔑 Key Features of the Data Warehousing Dashboard in Excel
📊 Five-KPI command center. The Overview page surfaces Total Loads, Total Records Loaded, Total Compute Cost, Failed Loads, and SLA Attainment % as cards, so data engineering leads read pipeline health in seconds without opening a single log file.
🔁 Refresh-and-go architecture. Every visual is driven by Excel PivotTables on a hidden Support sheet. Replace the sample rows in the Data sheet, press Data → Refresh All, and all 19 charts plus every KPI recalculate at once — no formulas to edit, no ranges to drag.
🎚️ Native slicers on every page. Filter the whole dashboard by warehouse, environment, data domain, priority, or owner team with one click. Slicers stay bound to the underlying pivots so filtered views remain accurate.
📈 19 ready-built charts across 5 pages. Load trends, data-quality pass rates, compute-cost breakdowns, and SLA attainment are visualized out of the box across monthly, yearly, by-warehouse, by-region, and by-team views.
💵 Cost visibility built in. Track Total Compute Cost by Environment and by Data Domain to spot which pipelines quietly burn your cloud budget — insight teams normally buy a separate observability tool to get.
🧩 Works fully offline in the Excel you already own. No add-ins, no logins, and no data leaving your laptop, which suits teams handling sensitive load metadata.
📦 What’s Inside the Data Warehousing Dashboard in Excel
Page 1: Overview
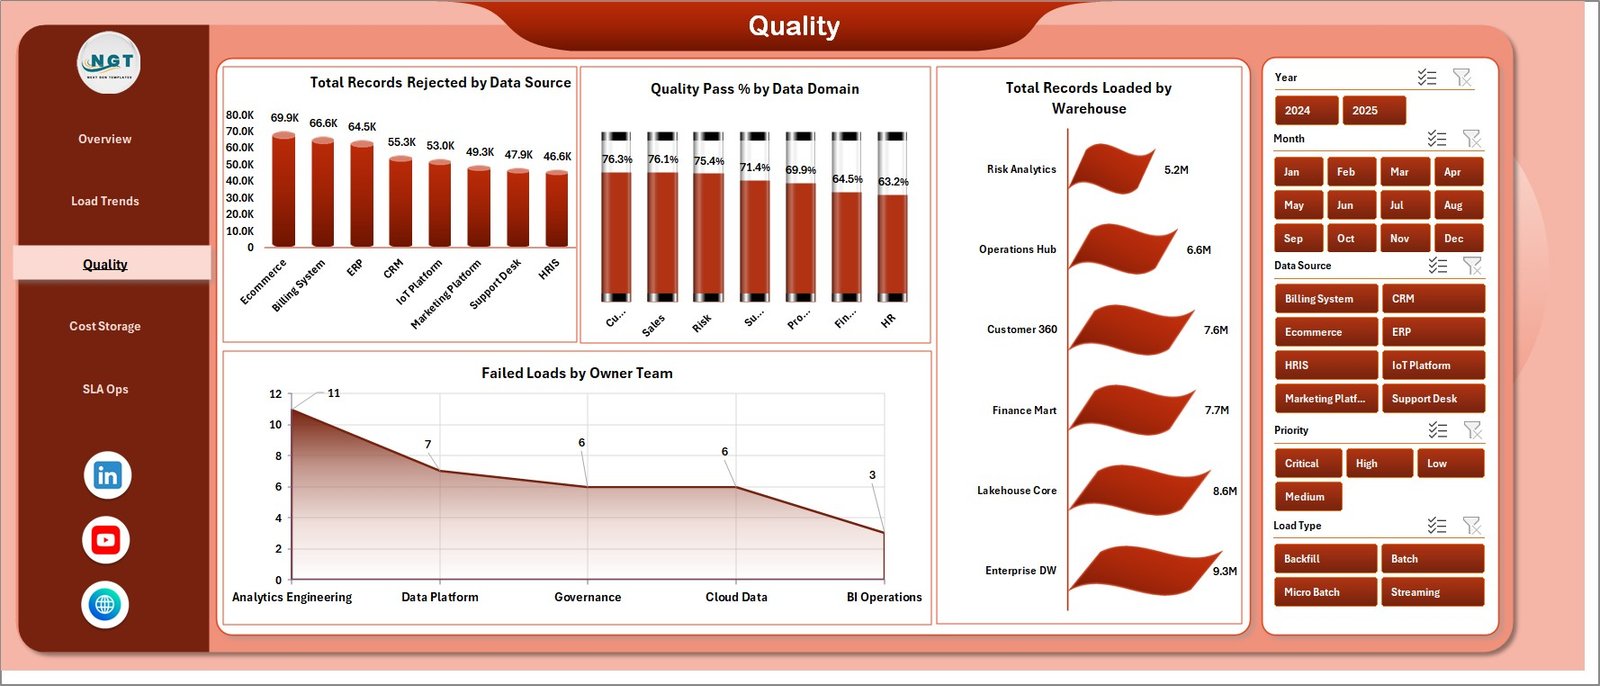
The landing page combines five KPI cards (Total Loads, Total Records Loaded, Total Compute Cost, Failed Loads, SLA Attainment %) with four charts and a row of slicers. Total Records Loaded by Month and Total Records Loaded by Year reveal volume trends over time, while Failed Loads by Priority shows where breakages cluster and Total Loads by Warehouse shows distribution across destinations.
Page 2: Load Trends
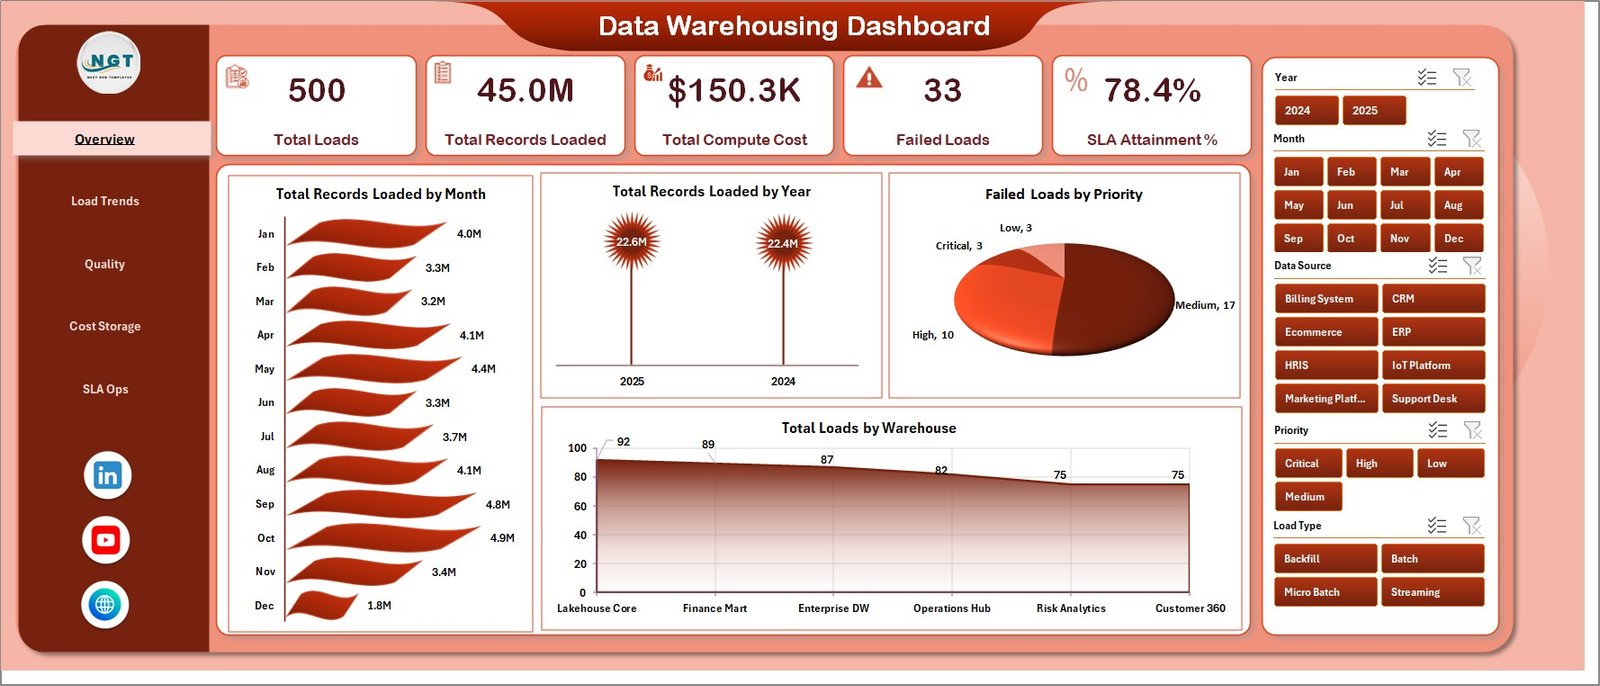
This page drills into how loads behave over time and by type. Total Loads by Month tracks run frequency, Total Records Loaded by Load Type compares full versus incremental volumes, Total Loads by Quality Status splits passed versus flagged runs, and Total Records Loaded by Pipeline shows which pipelines move the most data.
Page 3: Quality
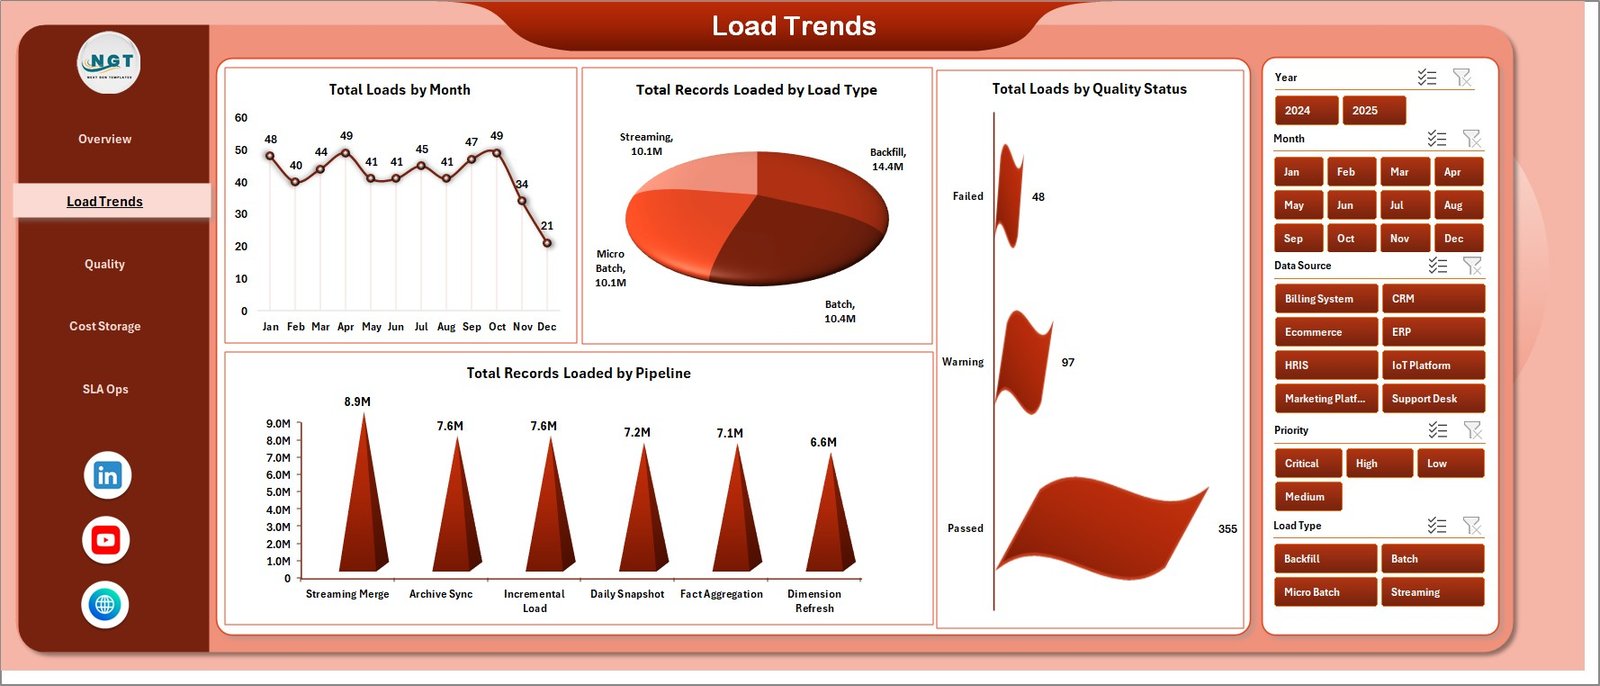
The Quality page focuses on data integrity. Total Records Rejected by Data Source exposes problem feeds, Quality Pass % by Data Domain scores reliability per subject area, Total Records Loaded by Warehouse confirms where clean data lands, and Failed Loads by Owner Team assigns accountability for breakages.
Page 4: Cost & Storage
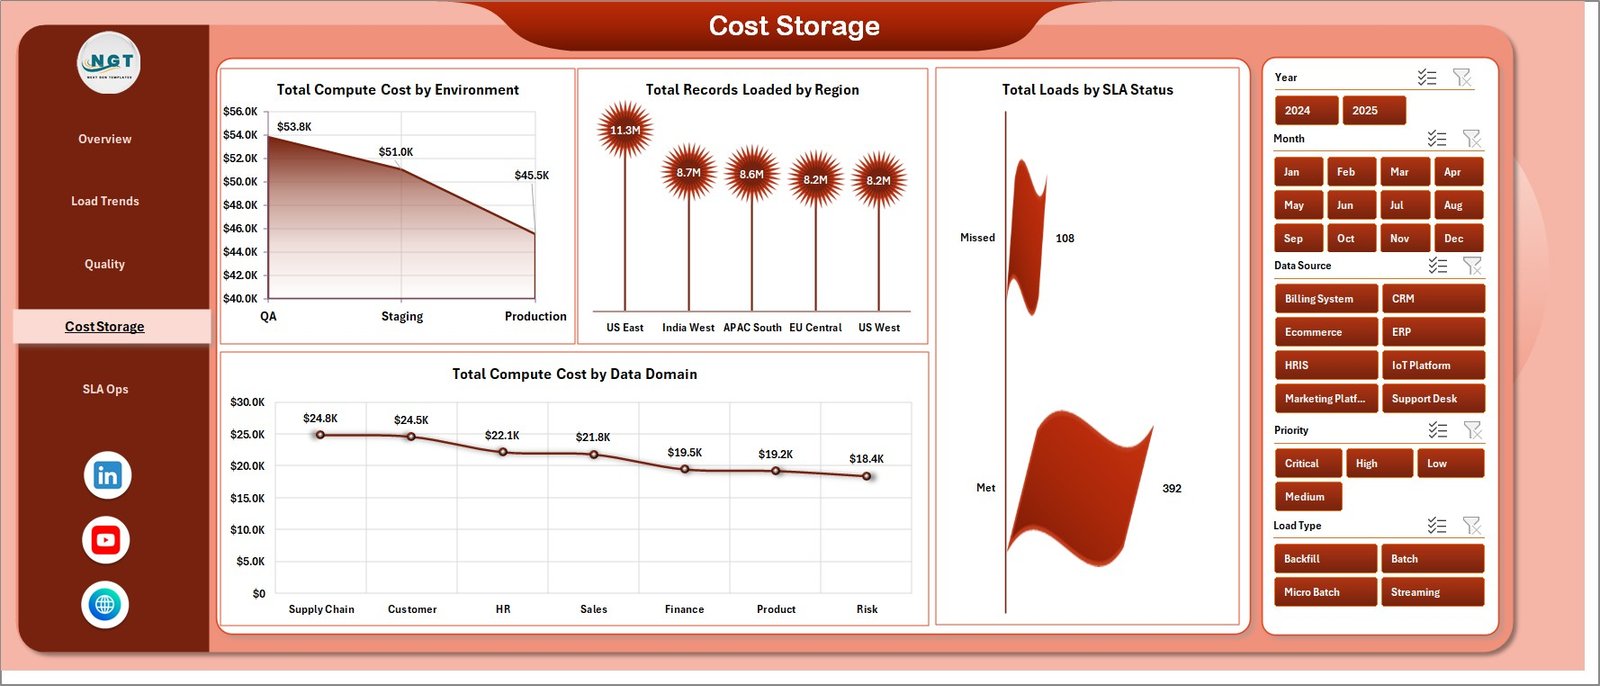
This page turns usage into dollars. Total Compute Cost by Environment compares dev, test, and prod spend, Total Records Loaded by Region maps volume geographically, Total Loads by SLA Status shows how many runs met their windows, and Total Compute Cost by Data Domain reveals which domains drive the bill.
Page 5: SLA Ops
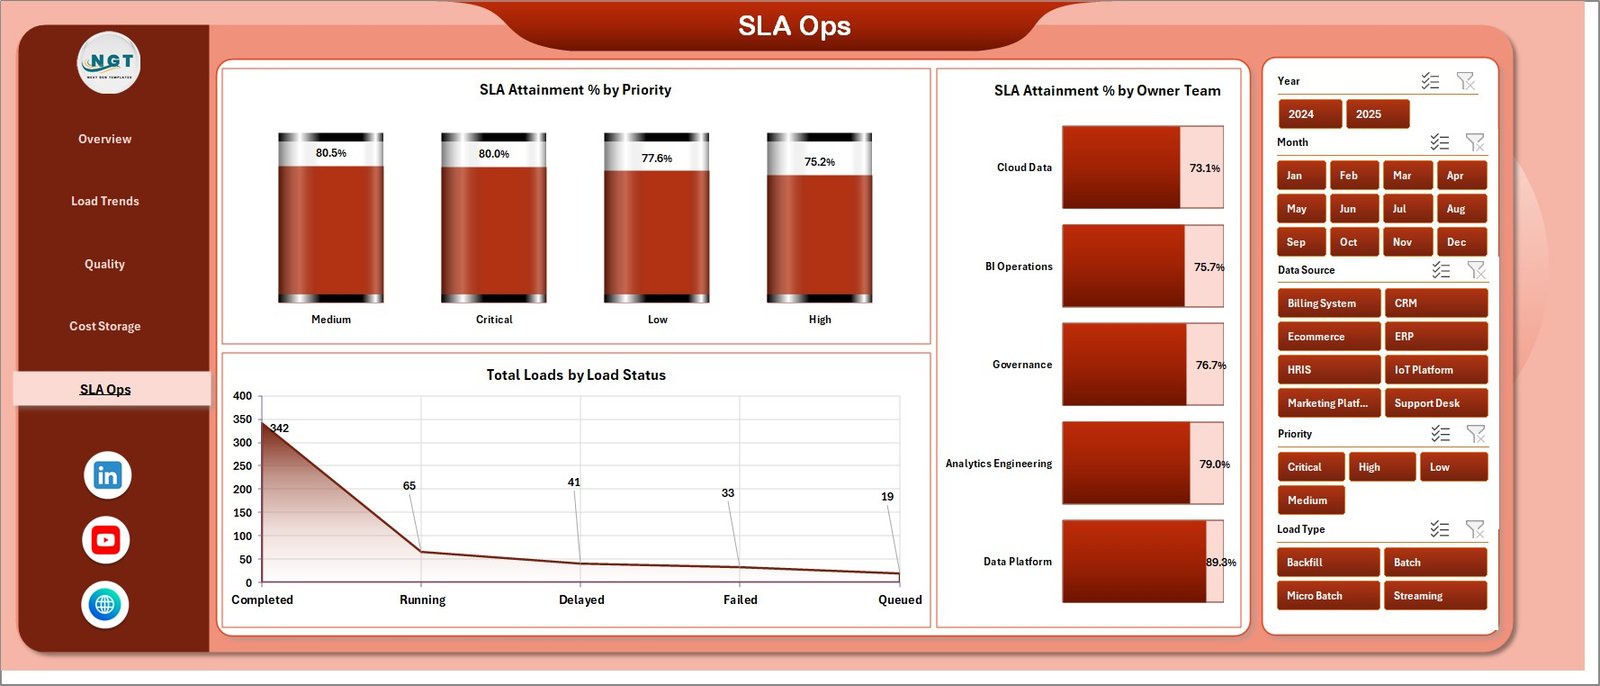
The SLA Ops page is the reliability scorecard. SLA Attainment % by Priority and SLA Attainment % by Owner Team show who is hitting targets, while Total Loads by Load Status summarizes succeeded, failed, and running jobs for a quick operational read.
Data Sheet Tab
The Data sheet is your single input surface. Paste your warehouse load records in the same column order as the sample data — load date, pipeline, warehouse, records, compute cost, quality status, priority, owner team, and SLA status — and the rest of the workbook reads from here.

Support Sheet Tab
The Support sheet holds every PivotTable that powers the dashboard. After updating the Data sheet, open the Data tab in the Excel ribbon and click Refresh All — all pivots and charts refresh together. You can keep this sheet hidden during normal use.

📊 Data Warehousing Dashboard in Excel vs. Power BI vs. Paid Data-Observability SaaS — Where This Fits
| Feature | Data Warehousing Dashboard in Excel | Power BI / BI Tool build | Datadog / Monte Carlo |
|---|---|---|---|
| Cost | $17.99 one-time | Free tier, but build time + Pro seats | $15–100+ / user / month |
| Platform | Microsoft Excel (offline) | Power BI Desktop + Service | Cloud SaaS only |
| Setup time | Under 10 minutes | Hours to model and publish | Days of connector setup |
| Pipeline & SLA monitoring | ✅ Built in | ✅ With custom DAX | ✅ Advanced |
| Compute-cost tracking | ✅ By environment & domain | ⚠️ Manual modeling | ✅ Add-on modules |
| Works offline | ✅ Yes | ⚠️ Service needs cloud | ❌ No |
| Customizable fields | ✅ Full control | ✅ Full control | ⚠️ Vendor-defined |
| Share with link | ⚠️ File-based | ✅ Yes | ✅ Yes |
| Year-1 cost at 5 users | $17.99 total | ~$600+ (Pro seats) | $900–6,000+ |
For data teams that want pipeline, quality, cost, and SLA visibility without standing up a BI stack or paying per-seat observability fees, the Data Warehousing Dashboard in Excel sits in the sweet spot.
👥 Who This Template Is For — and Who It’s Not For
✅ This template is built for:
- Data engineers and analytics leads who need a fast load-monitoring and SLA report without building one in Power BI
- Small and mid-size data teams (1–50 people) running ETL/ELT jobs across one or more warehouses
- Consultants and agencies who want a ready-made client deliverable for data-pipeline reporting
❌ This template is NOT for:
- Teams needing real-time, automated alerting on live pipelines — use a dedicated observability platform
- Organizations that require direct API connections to Snowflake, BigQuery, or Redshift instead of a manual data paste
- Anyone who does not have Microsoft Excel installed
⚙️ How to Use the Data Warehousing Dashboard in Excel
- Open the downloaded workbook in Microsoft Excel on desktop.
- Go to the Data sheet and paste your load records in the same column order as the sample data.
- Open the Data tab in the ribbon and click Refresh All to update every pivot and chart.
- Use the slicers on each page to filter by warehouse, environment, domain, priority, or owner team.
- Read the Overview for headline KPIs, then drill into Load Trends, Quality, Cost & Storage, and SLA Ops.
💼 Real-World Use Cases
Arjun leads a 6-person data engineering team at a fintech startup. Every Monday he pastes the week’s load logs into the Data sheet, clicks Refresh All, and walks leadership through SLA Attainment % by Owner Team and Failed Loads by Priority — a report he used to rebuild by hand for two hours.
Lena is a freelance analytics consultant. She ships the Data Warehousing Dashboard in Excel as a polished deliverable to clients who run dbt and Airflow but have no BI tool, charging for the insight without paying for a $900-a-year observability subscription herself.
Marcus manages cloud spend at a mid-size retailer. He uses Total Compute Cost by Environment and by Data Domain to discover that one staging pipeline drove 30% of monthly compute, then reschedules it to cut the bill.
❓ Frequently Asked Questions
What KPIs does the Data Warehousing Dashboard in Excel track?
The Data Warehousing Dashboard in Excel tracks five headline KPIs — Total Loads, Total Records Loaded, Total Compute Cost, Failed Loads, and SLA Attainment % — plus 19 supporting charts covering load trends, data quality, compute cost, and SLA performance.
How long does setup take?
Setup takes under 10 minutes. Paste your warehouse load records into the Data sheet using the sample column format, then click Data → Refresh All. Every PivotTable, chart, and KPI in the Data Warehousing Dashboard in Excel updates automatically.
Do I need any add-ins or an internet connection?
No. The Data Warehousing Dashboard in Excel runs entirely inside Microsoft Excel with no add-ins, plugins, or logins, and works fully offline so your load metadata never leaves your computer.
How does this compare to Datadog or Monte Carlo?
Paid observability tools like Datadog and Monte Carlo offer live alerting but cost $15–100+ per user monthly. The Data Warehousing Dashboard in Excel is a one-time $17.99 purchase for periodic reporting on loads, quality, cost, and SLA — ideal when you need insight, not real-time monitoring.
Can I customize the charts and fields?
Yes. Because the Data Warehousing Dashboard in Excel is built on standard Excel PivotTables and slicers, you can add fields, change groupings, and restyle charts with familiar Excel tools and no code.
Is this a one-time purchase?
Yes. The Data Warehousing Dashboard in Excel is a one-time payment with lifetime access, instant download, no subscription, and no per-user fees.
👤 About the Author
Built by PK — Microsoft Certified Professional with 15+ years of Excel, Google Sheets, and Power BI experience. Founder of NextGenTemplates, reaching 300K+ subscribers across YouTube channels (@PK-AnExcelExpert, @NextGenTemplates, @NeoTechNavigators). Every template is hand-built and tested before release.
🔗 Explore Related Templates
Pair this dashboard with other data and IT templates from NextGenTemplates:
- Clinical Data Management Dashboard in Excel — track data capture, queries, and reconciliation.
- Cybersecurity Operations Center Dashboard in Excel — monitor incidents, alerts, and response times.
- Cloud Hosting Services Dashboard in Excel — track uptime, usage, and hosting revenue.
- Data Privacy Office Dashboard in Excel — manage DSARs, consent, and compliance.
Browse the full library of Excel Dashboard Templates or explore Power BI Dashboards for connected, refreshable versions.
📖 Click here to read the Detailed Blog Post
🎥 Visit our YouTube channel for step-by-step video tutorials
👉 YouTube.com/@NextGenTemplates
📅 Last updated: June 2026































Reviews
There are no reviews yet.