

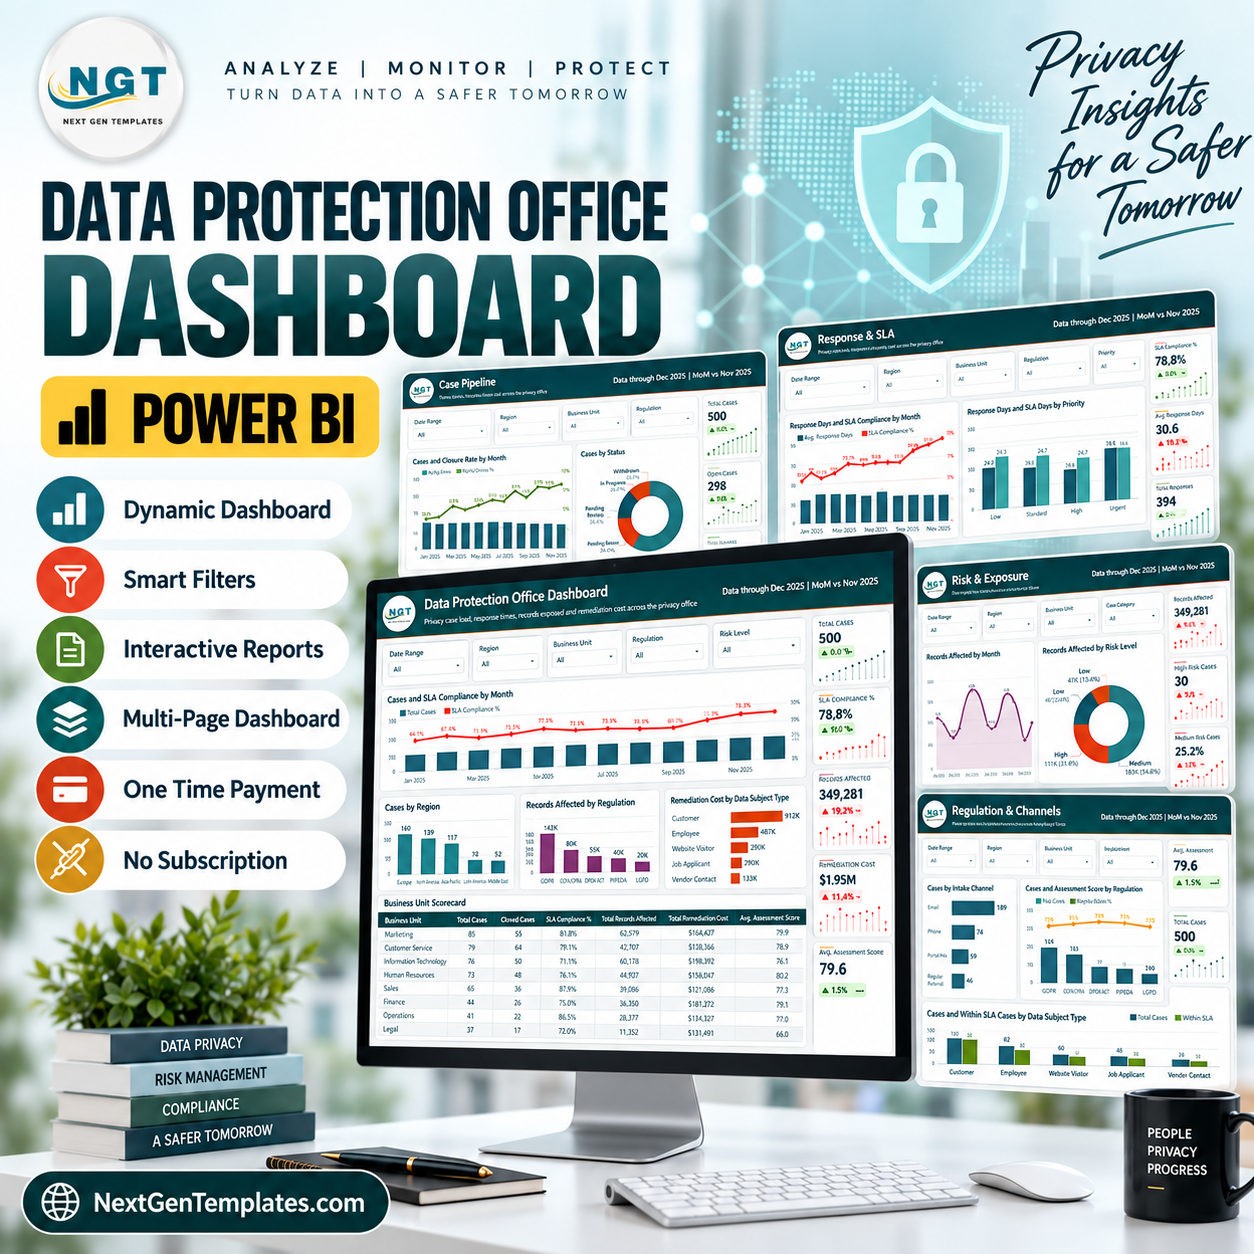

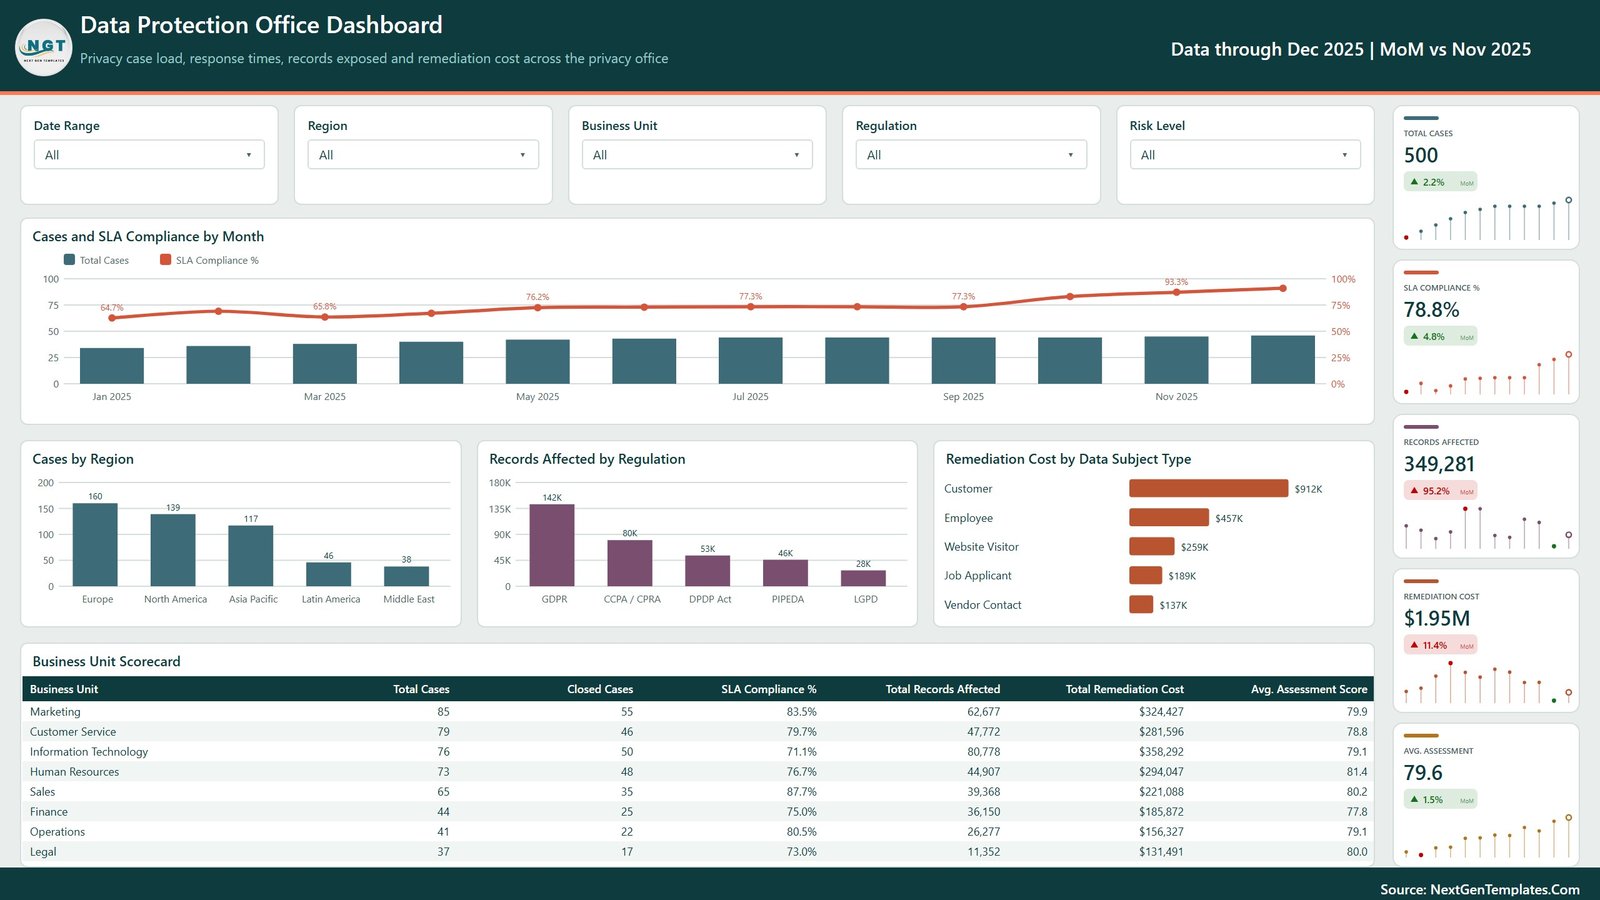
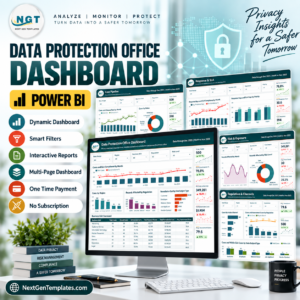
The Data Protection Office Dashboard in Power BI is a ready-to-open .pbix report that turns a privacy office’s case log into five analysis pages, a ten-field drillthrough and thirty named DAX measures. The sample model carries 500 privacy cases logged across the whole of 2025 – 8 business units, 5 regions, 8 case categories and 5 regulations – and it opens already showing 78.8% SLA compliance, 349,281 records affected and $1.95M in remediation cost. Swap the sample table for your own export and every visual, card and scorecard recalculates. One payment, no subscription, no per-seat licence, and the file is yours to rebrand.
Read this before you buy. This is an analytical Power BI report over a sample dataset. It is not a compliance system of record, not a DSAR intake or case-management workflow, not a consent platform, not a data-discovery or mapping tool, and not legal advice. It does not certify, attest or evidence compliance with GDPR, CCPA/CPRA, the DPDP Act, PIPEDA, LGPD or any other regime on your behalf. It reports on a case log that you maintain somewhere else.
Key Features of the Data Protection Office Dashboard in Power BI
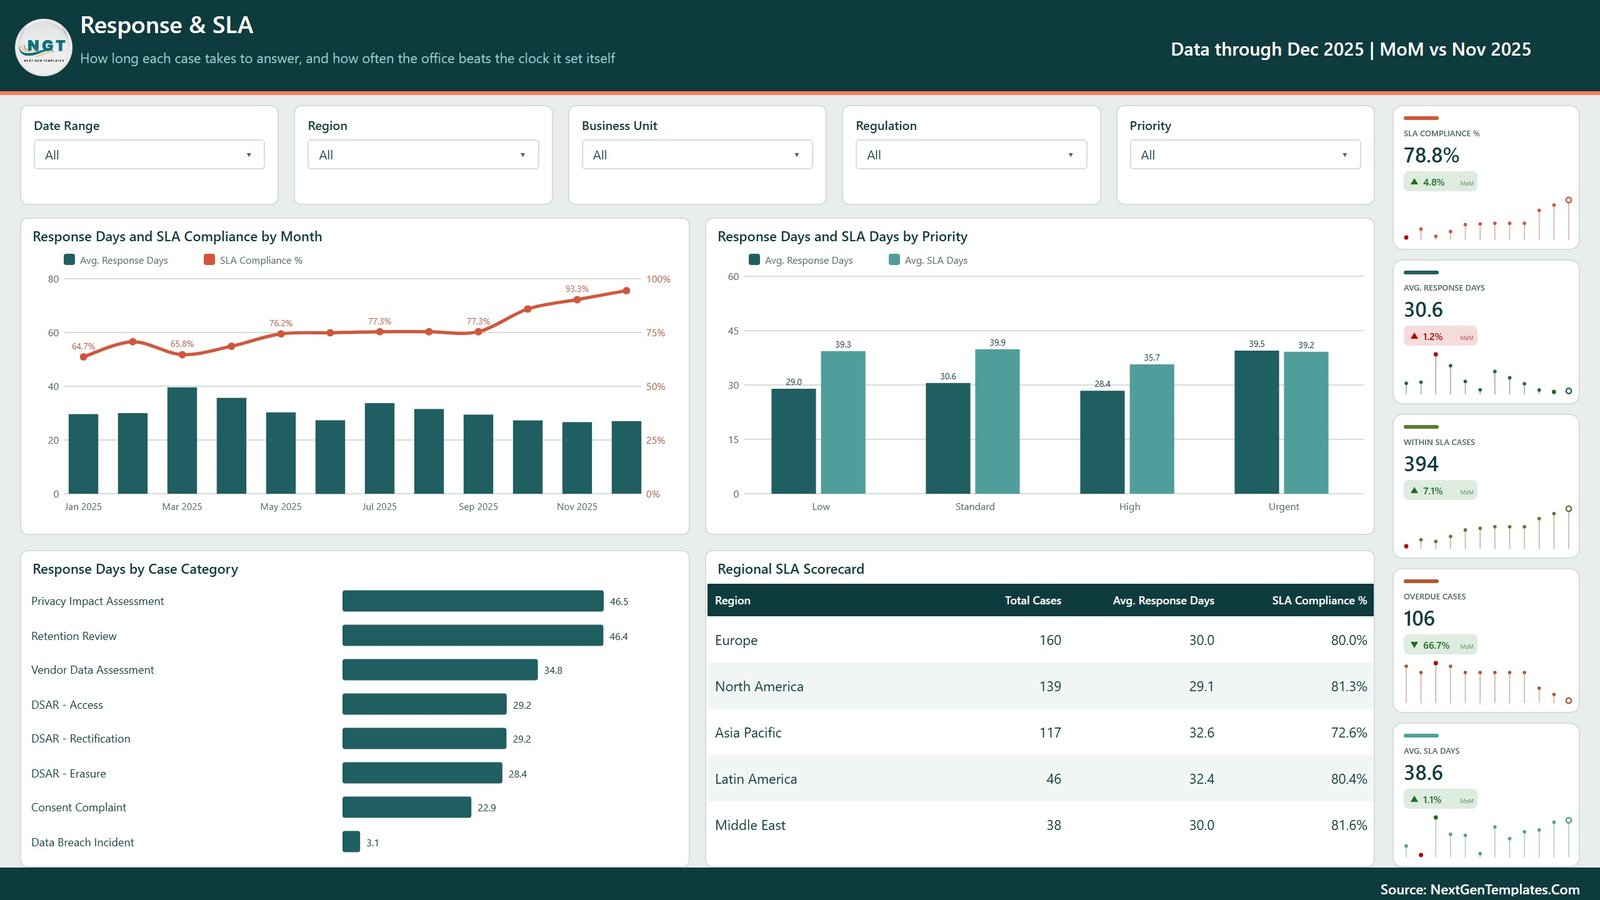
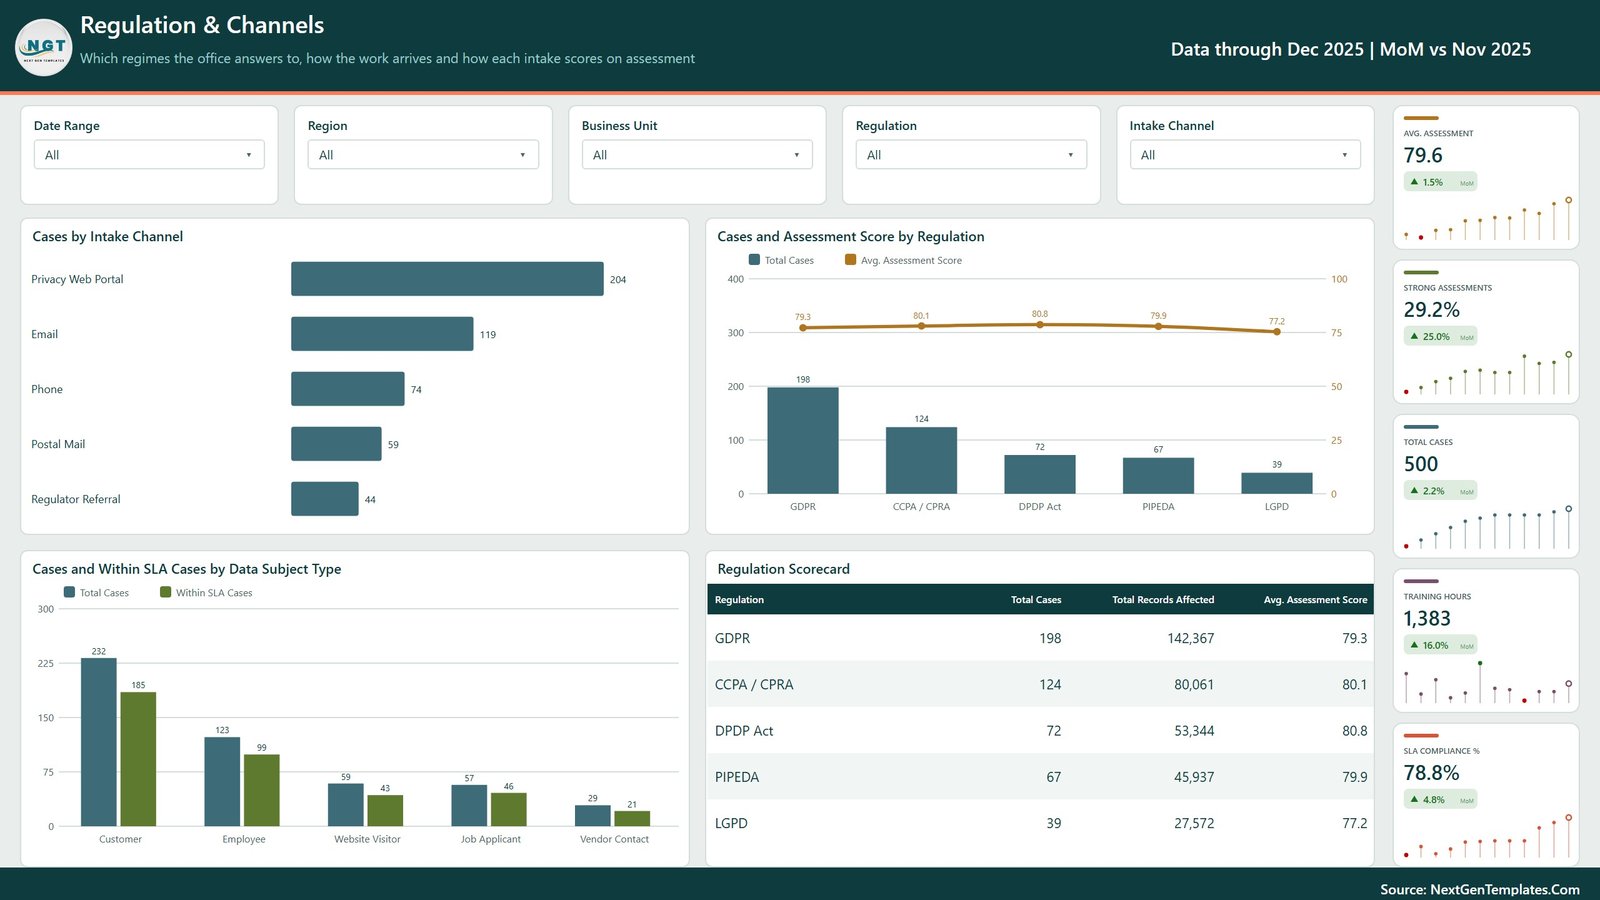
- Five analysis pages – Overview, Case Pipeline, Response & SLA, Risk & Exposure, and Regulation & Channels – each built on the same 500-row model.
- A real Details drillthrough defined on ten fields: Business Unit, Region, Case Category, Data Subject Type, Regulation, Intake Channel, Risk Level, Priority, Privacy Officer and Status. Right-click any bar or table row and you land on the underlying cases.
- Two hidden tooltip pages (Trend Detail and Category Detail, 280×360) that appear on hover instead of forcing a page change.
- Thirty named DAX measures behind the visuals – SLA Compliance %, Closure Rate %, Avg. Response Days, Within SLA Cases, Overdue Cases, Critical Risk Cases, High Risk Share %, Total Records Affected, Total Remediation Cost, Avg. Assessment Score and more.
- Five slicers per page, four of them synced across the report (Date Range, Region, Business Unit, Regulation) so a filter set on Overview follows you to Risk & Exposure.
- Month-on-month deltas on every KPI card, with a mini trend spark beneath each figure.
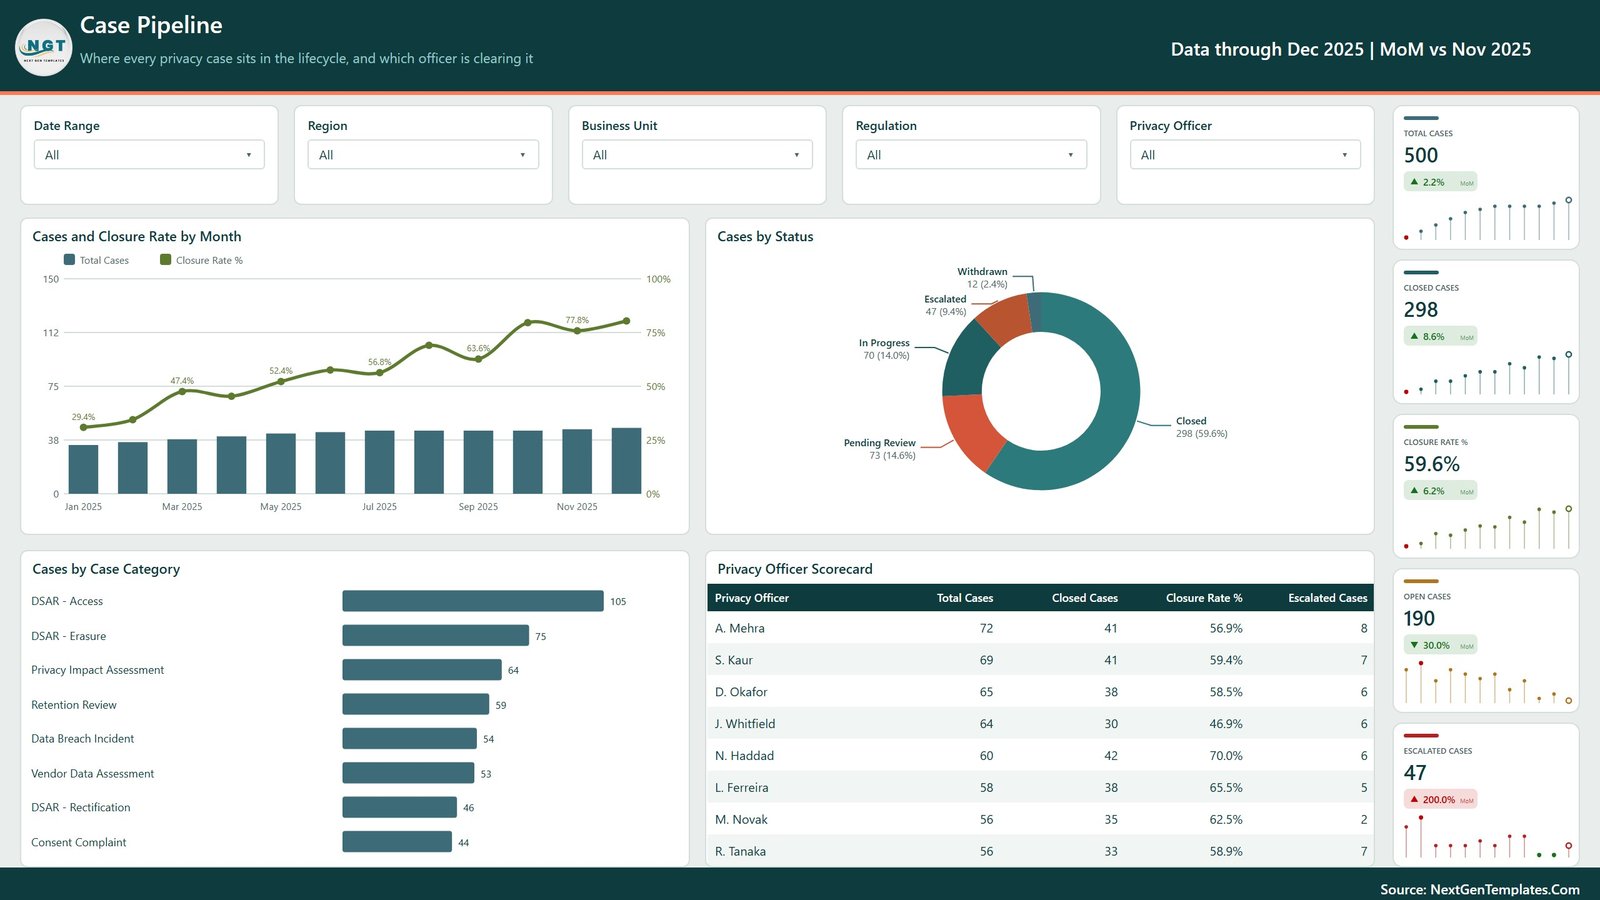
- Two scorecard tables that most privacy dashboards leave out: a Business Unit Scorecard (cases, closed, SLA %, records, cost, assessment score) and a Privacy Officer Scorecard (cases, closed, closure rate, escalations).
- Editable everything – colours, logo, page titles, measure names and the sample data itself.
What’s Inside the Download
The download is a single ZIP holding three files:
Data Protection Office Dashboard in Power BI.pbix– the report and its semantic model, 9 pages in total (5 analysis + 1 Details drillthrough + 2 hidden tooltips + a Get More Dashboards page you can delete).Data.xlsx– the 500-row sample table, 18 columns: Case ID, Date Logged, Business Unit, Region, Case Category, Data Subject Type, Regulation, Intake Channel, Risk Level, Priority, Privacy Officer, Status, SLA Days, Response Days, Records Affected, Remediation Cost, Training Hours and Assessment Score.Power BI Dashboard - User Manual.pdf– the setup and re-pointing guide.
What the sample data does and does not contain. Every row is a case, not a person. There are no data-subject names, email addresses, phone numbers, postal addresses, dates of birth, national identifiers, account numbers or free-text case notes anywhere in the file. “Data Subject Type” is a five-value category label (Customer, Employee, Job Applicant, Website Visitor, Vendor Contact), not an individual. The only person-shaped values are eight fictional internal privacy officers written as initial-plus-surname. That is a deliberate design choice, and it is worth keeping when you load your own data.
Data Protection Office Dashboard in Power BI vs. Tableau vs. Paid Privacy SaaS – Where This Fits
| This template (Power BI) | Tableau or Qlik build | Paid privacy SaaS (OneTrust, TrustArc tier) | |
|---|---|---|---|
| Cost | $17.99 once | Tableau Creator from ~$75/user/month | Five figures a year, commonly |
| Platform | Power BI Desktop (free) | Tableau Desktop / Qlik Sense | Vendor-hosted web app |
| Setup time | Open, re-point Power Query, done | Build the workbook from scratch | Weeks of implementation |
| Real-time team collaboration | Only if you publish to a Power BI workspace | Only with Tableau Server / Cloud | Yes, built in |
| Mobile access | Power BI mobile app after publishing | Vendor mobile app after publishing | Yes |
| Customisable fields | Fully – it is your model | Fully | Within the vendor’s schema |
| Share with a link | After publishing to a workspace | After publishing | Yes |
| Year-1 cost at 5 users | $17.99 (+$0 if you stay in Desktop) | ~$4,500 | Typically $20,000+ |
| DSAR intake and case workflow | No – reporting only | No | Yes |
| Article 30 register / RoPA | No | No | Yes |
Who This Template Is For – and Who It’s Not For
It fits a DPO or privacy lead who already tracks cases in a spreadsheet, a ticketing queue or a GRC export and needs a monthly board view of case load, response times, exposure and cost. It fits a compliance analyst who has to answer “which business unit is missing SLA, and by how much” in one screen. It fits a BI developer who wants a working privacy data model to adapt rather than a blank canvas.
It does not fit you if you need the tool to run the privacy programme: to receive and route DSARs, hold your Article 30 records, capture consent, discover personal data across systems, or file breach notifications. It does not fit if you have no case log to load – the dashboard reports history, it does not create it. And it does not fit if you need an auditable, access-controlled system of record; a .pbix file on a laptop is not that.
How to Use the Data Protection Office Dashboard in Power BI
- Unzip the download and open the
.pbixin Power BI Desktop (free from Microsoft). - Read
Power BI Dashboard - User Manual.pdf, then look atData.xlsxso you can see the 18 columns the model expects. - Export your own case log into that column layout. Keep the category columns to a controlled list – the slicers and scorecards depend on consistent spelling.
- In Power BI Desktop go to Transform data > Data source settings > Change Source and point the query at your file, then Refresh. Microsoft’s Power BI data sources documentation lists the alternatives if you move to SQL Server or SharePoint. If the shipped query still holds the build machine’s path, this is the step that fixes it.
- Check the KPI cards first. If a card is blank, a column name has drifted; rename it back and refresh.
- Rebrand: replace the logo, set your colours in the theme, and rename the pages. Delete the Get More Dashboards page before you circulate the file.
- Publish to a Power BI workspace if you want links, mobile and scheduled refresh – and set workspace permissions before you do, because your real version will contain case data.
Real-World Use Cases
Amara, DPO at a 900-person SaaS company. Her board pack question is always the same: are we answering in time? She opens Response & SLA, sees 78.8% compliance against a 38.6-day average clock, and the Regional SLA Scorecard tells her Asia Pacific is the outlier at 72.6%. Her ask changes from “hire more” to “resource one region”.
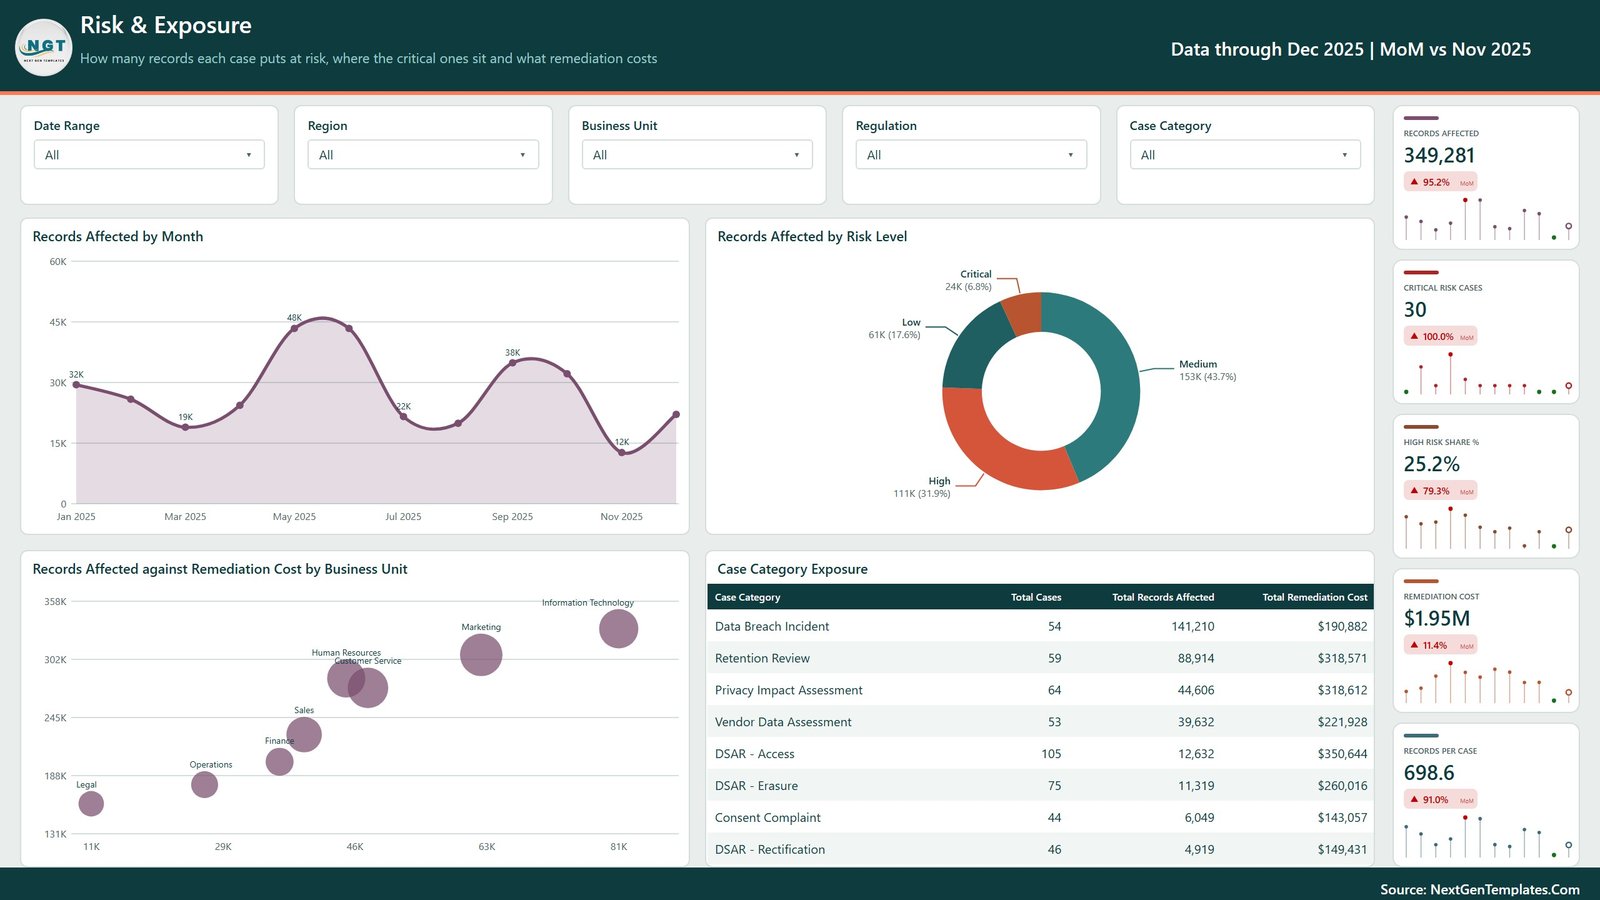
Daniel, compliance analyst in retail banking. He needs exposure, not volume. Risk & Exposure shows 54 breach incidents carrying 141,210 of the 349,281 affected records, so 11% of cases hold 40% of exposure. He right-clicks the bar, drills through to Details, and exports the case list for the incident review.
Priya, head of privacy operations. She uses the Privacy Officer Scorecard on Case Pipeline for one-to-ones – closure rates from 46.9% to 70.0% across eight officers, with escalations beside them – and treats the spread as a coaching signal rather than a ranking.
Frequently Asked Questions
Does this dashboard make my organisation GDPR compliant?
No. It reports on privacy cases you already log. Compliance depends on your policies, records, lawful bases and controls, none of which live in this file. Treat it as a management report, not evidence.
Is it a DSAR intake or case-management system?
No. There is no form, no queue, no routing and no status workflow. Cases arrive in the model because you exported them from wherever you actually manage them.
Does the sample data contain anyone’s personal data?
No. The 500 rows carry case attributes and numbers only – no names, emails, phone numbers, addresses, dates of birth, identifiers or notes. The eight privacy officers are fictional initials-and-surname labels. Once you load your own data that changes, so store and share the file accordingly.
Which regulations does it cover?
The Regulation column is a five-value label – GDPR, CCPA/CPRA, DPDP Act, PIPEDA and LGPD – used to slice and group your own cases. The model encodes no regulatory logic, deadlines or tests. Edit the list to match the regimes you answer to.
Do I need a Power BI licence?
Not to use it. Power BI Desktop is free. A Pro or PPU licence is only needed if you want to publish and share it in a workspace.
Can I connect it to a live source instead of Excel?
Yes. Replace the Excel query with SQL Server, SharePoint, Dataverse or anything else Power Query reads, as long as the output columns keep their names.
Is there an Excel version?
Yes – see Data Protection Office Dashboard in Excel, the same subject built as a workbook.
About the Author
Built by PK – Microsoft Certified Professional with 15+ years of Excel, Google Sheets, and Power BI experience. Founder of NextGenTemplates, reaching 300K+ subscribers across YouTube channels. Every template is hand-built and tested before release.
Explore Related Templates
- Data Protection Office Dashboard in Excel – the same analysis as a workbook, for teams without Power BI.
- Cyber Risk Management Dashboard in Power BI – risk register, severity mix and mitigation rates.
- Compliance Monitoring Dashboard in Power BI – control testing and findings across a framework.
- Digital Compliance Tools Dashboard in Power BI – adoption and coverage of compliance tooling.
- Digital Signature Services Dashboard in Excel – e-signature volumes, turnaround and cost.
- Browse the full Power BI and Power BI Dashboard catalogues.
Get this privacy reporting dashboard for $17.99 (regular $29.99) – one payment, instant download, yours to rebrand and reuse across every client and every year. Open it, point it at your own case log, and take a real answer to the next privacy review.
Watch the step-by-step video Demo:
Last updated: 6 September 2026.































Reviews
There are no reviews yet.