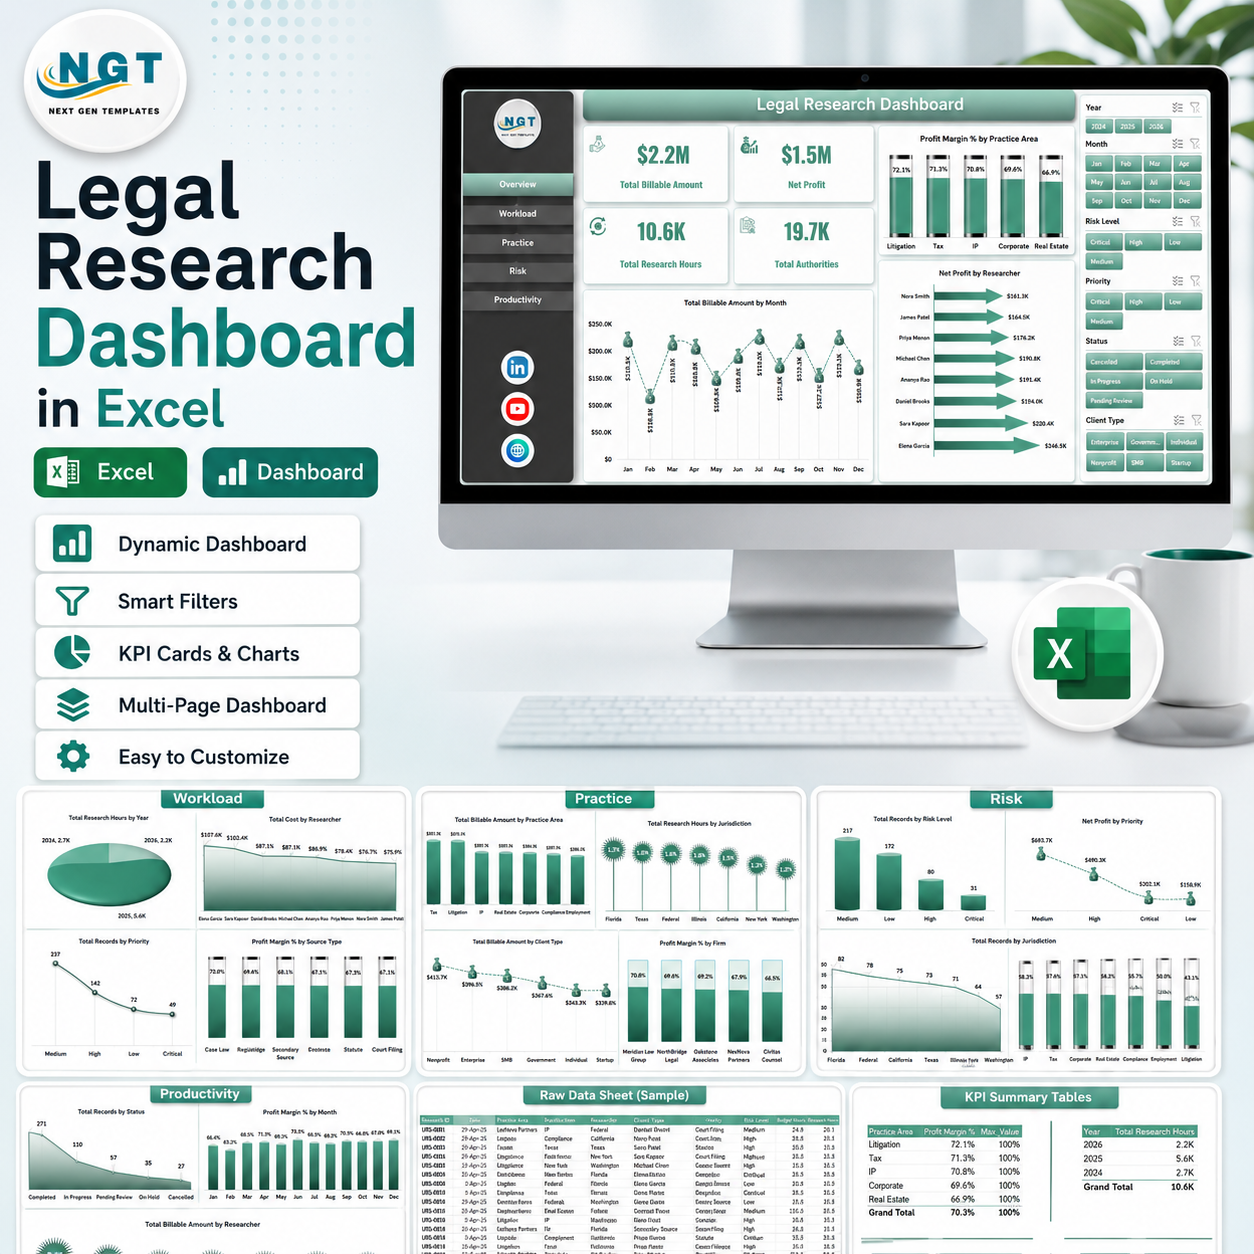
Legal Research Dashboard in Excel gives law firms, legal operations teams, research managers, compliance teams, and in-house counsel a ready Excel reporting workbook for billable amount, net profit, research hours, authorities, cost, priority, source type, practice area, jurisdiction, client type, firm, risk level, status, and completion performance. The template includes 7 worksheet tabs, 5 dashboard pages, 4 headline KPI cards, 17 chart views, multiple slicers, a Data Sheet, and a Support Sheet. Built by PK, trusted by 300K+ learners across YouTube channels, and sold as a one-time download with no recurring software subscription.
Key Features of Legal Research Dashboard in Excel
- 5 analytical dashboard pages: Overview, Workload, Practice, Risk, and Productivity.
- 4 high-level cards: Total Billable Amount, Net Profit, Total Research Hours, and Total Authorities.
- Legal research profitability views: Review billable amount, net profit, profit margin percentage, and cost by key research dimensions.
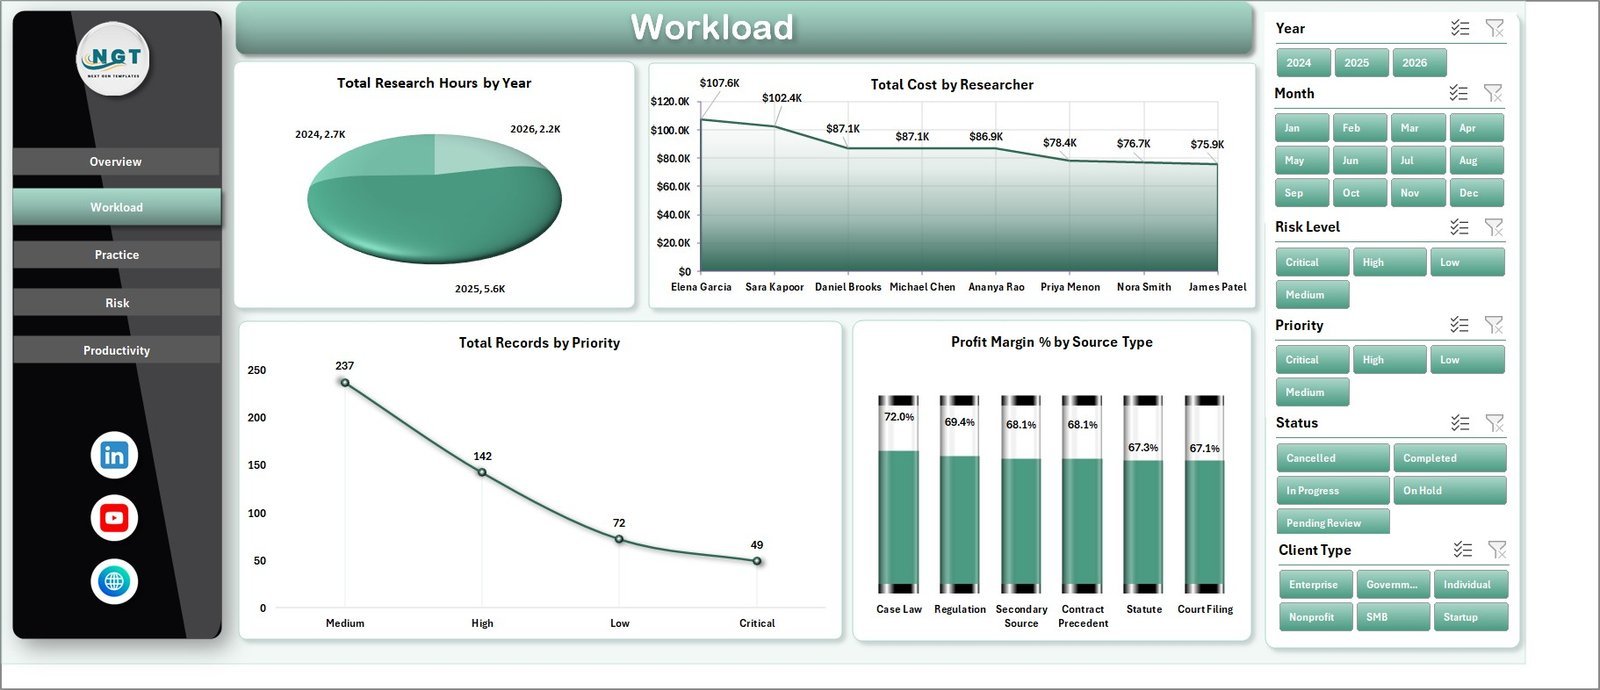
- Workload analysis: Track research hours by year, cost by researcher, records by priority, and margin by source type.
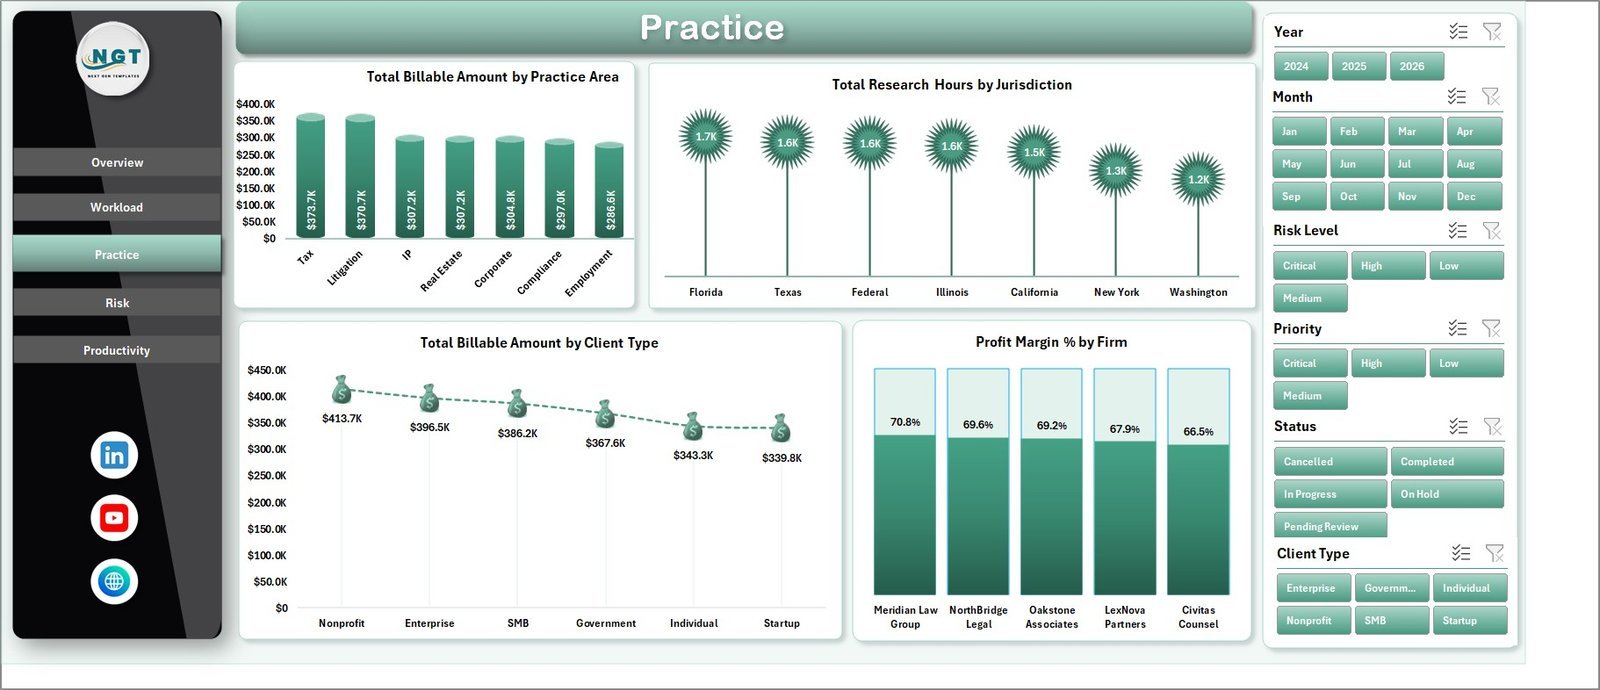
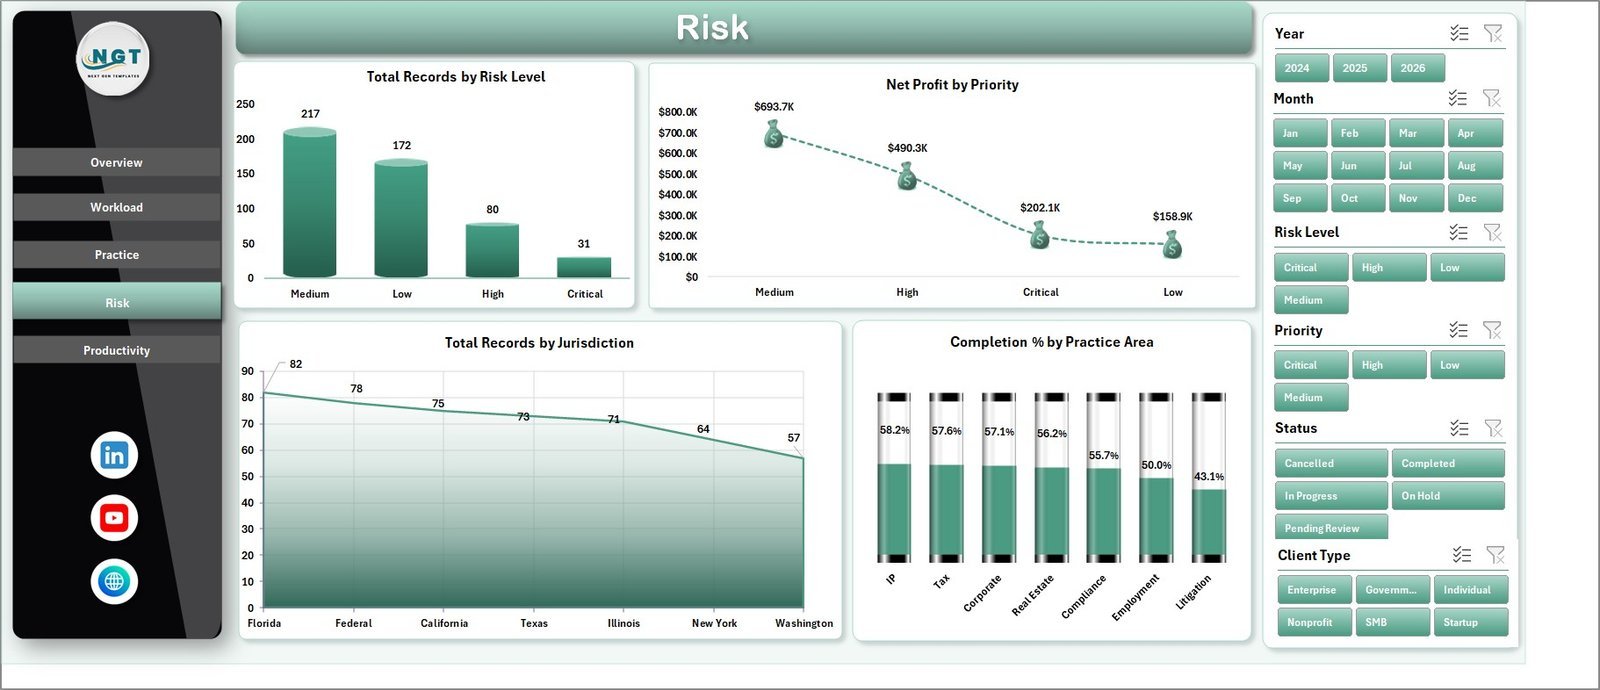
- Practice and risk review: Analyze practice area, jurisdiction, client type, firm, risk level, status, and completion percentage.
- Interactive slicers: Filter dashboard pages quickly without rebuilding charts or formulas.
- Refreshable Excel model: Update the Data Sheet, click Refresh All, and the support pivots refresh the workbook.
What’s Inside the Legal Research Dashboard in Excel
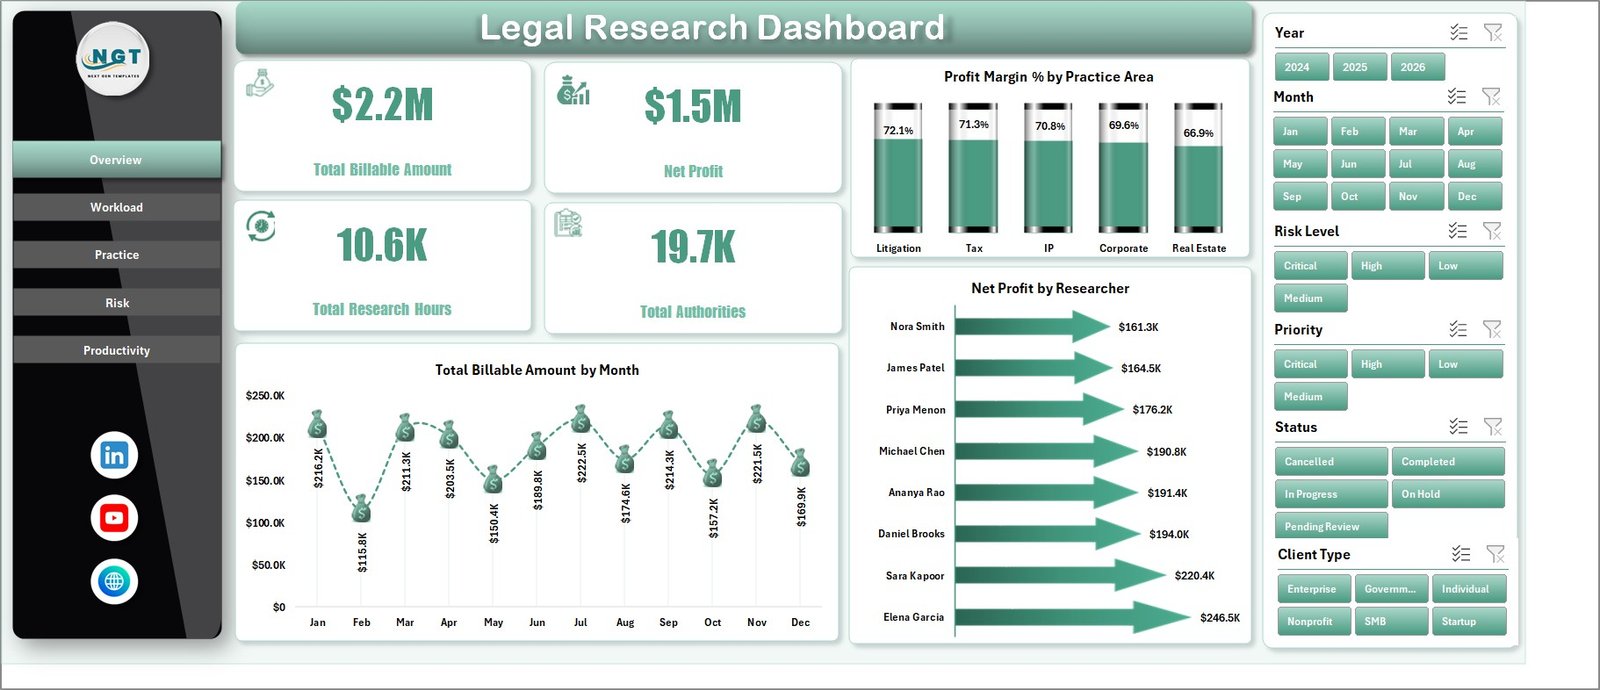
1. Overview Page
The Overview page gives leaders a high-level view of research economics and workload. Cards show Total Billable Amount, Net Profit, Total Research Hours, and Total Authorities, while slicers help users filter the dashboard quickly.
Total Billable Amount by Month: This chart shows monthly billable research value so partners can spot stronger and weaker billing periods. It is useful for understanding seasonality and monthly research demand.
Profit Margin % by Practice Area: This visual compares margin across legal practice areas. It helps teams identify which research categories create stronger profit after cost.
Net Profit by Researcher: This chart compares profit contribution by researcher. It helps managers review productivity, staffing balance, and training needs.
Legal Research Dashboard in Excel
2. Workload
The Workload sheet helps managers understand effort, cost, priority, and source mix. Total Research Hours by Year shows long-term demand. Total Cost by Researcher compares research expense by team member. Total Records by Priority highlights urgent work pressure. Profit Margin % by Source Type shows which authority or research source categories deliver better margins.
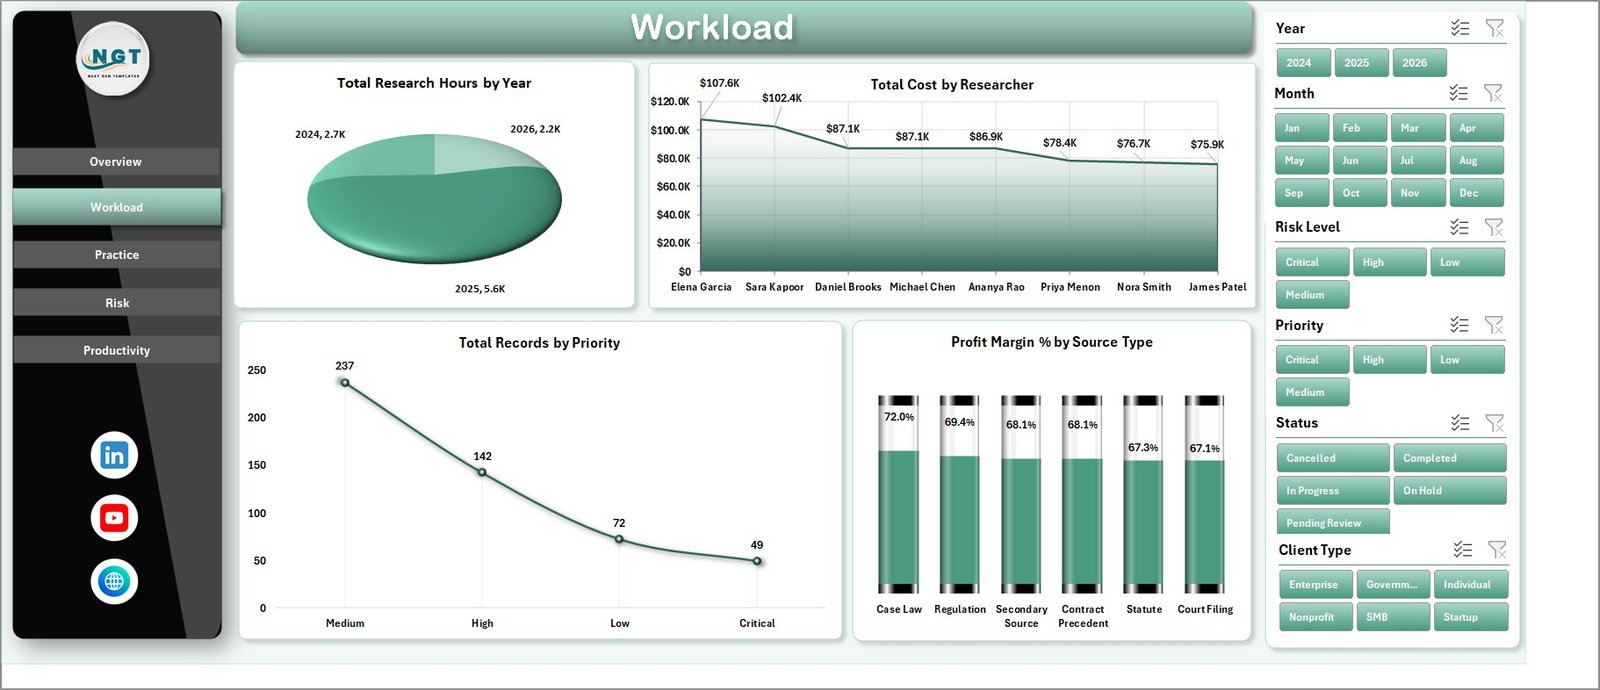
Workload
3. Practice
The Practice sheet reviews research value across practice areas, jurisdictions, client types, and firms. It includes Total Billable Amount by Practice Area, Total Research Hours by Jurisdiction, Total Billable Amount by Client Type, and Profit Margin % by Firm.

Practice
4. Risk
The Risk sheet helps legal teams connect research records with risk, priority, jurisdiction, and completion. Total Records by Risk Level shows exposure distribution. Net Profit by Priority connects urgency with financial outcome. Total Records by Jurisdiction helps identify jurisdictional concentration. Completion % by Practice Area highlights where research work is closing efficiently.
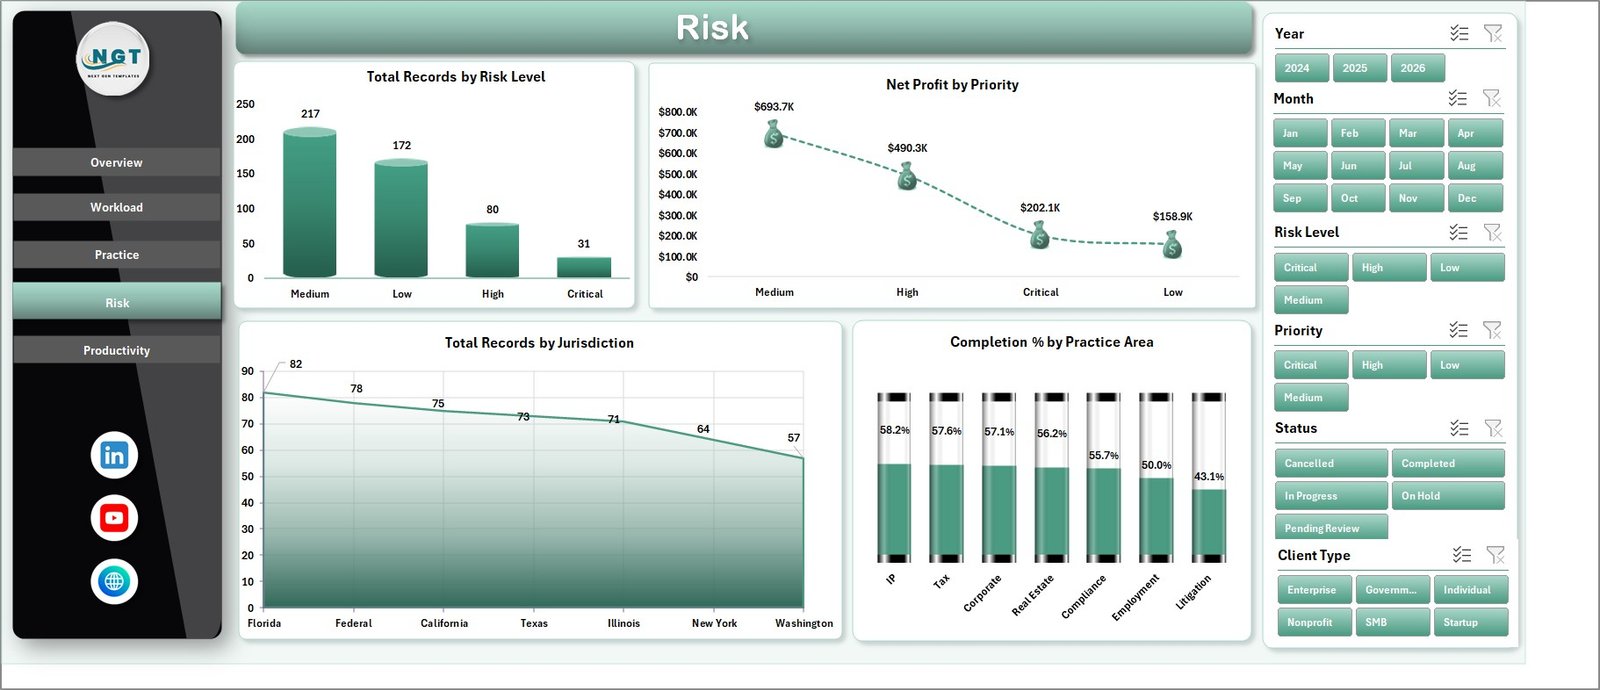
Risk
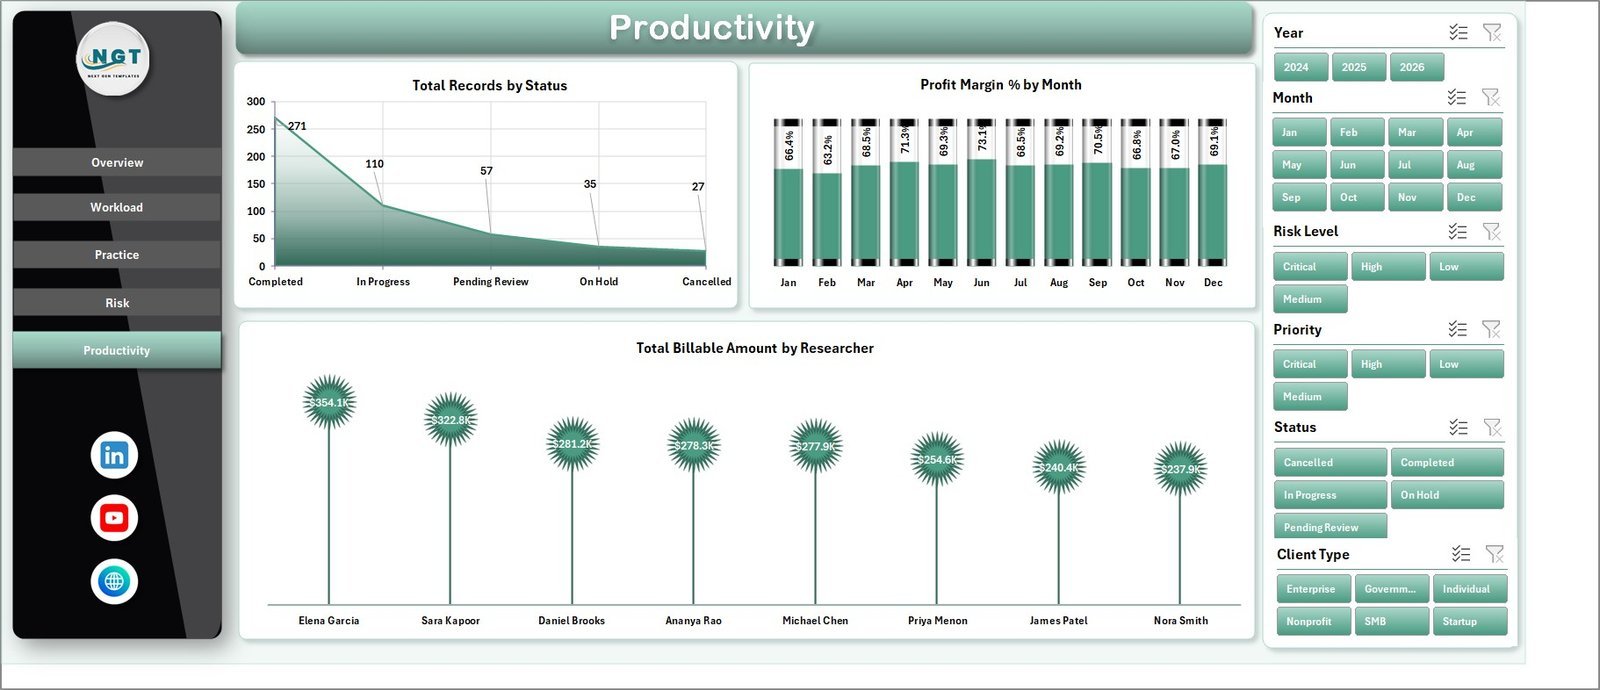
5. Productivity
The Productivity sheet focuses on status, margin trends, and researcher-level billing. Total Records by Status shows the research pipeline. Profit Margin % by Month tracks monthly profitability movement. Total Billable Amount by Researcher helps compare contribution across the team.
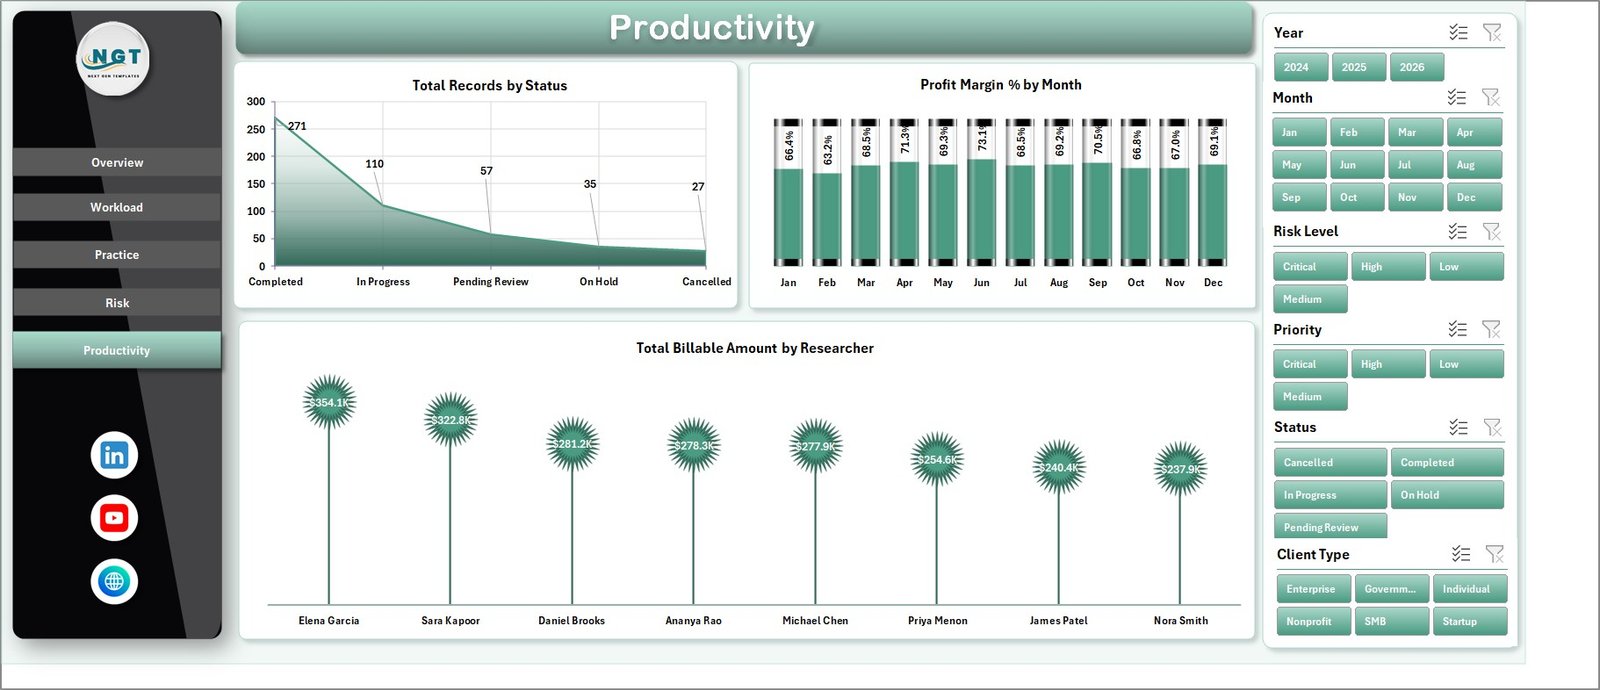
Productivity
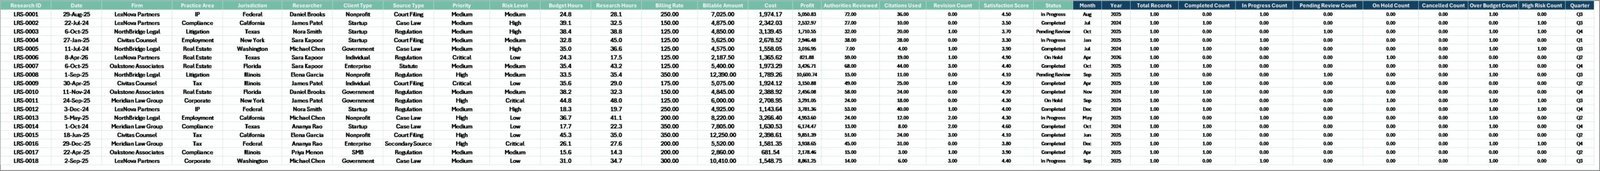
6. Data Sheet Tab
The Data Sheet is where users add or replace legal research records in the same format as the sample data. Keep the column structure consistent so cards, slicers, pivots, and charts stay connected.

Data Sheet tab
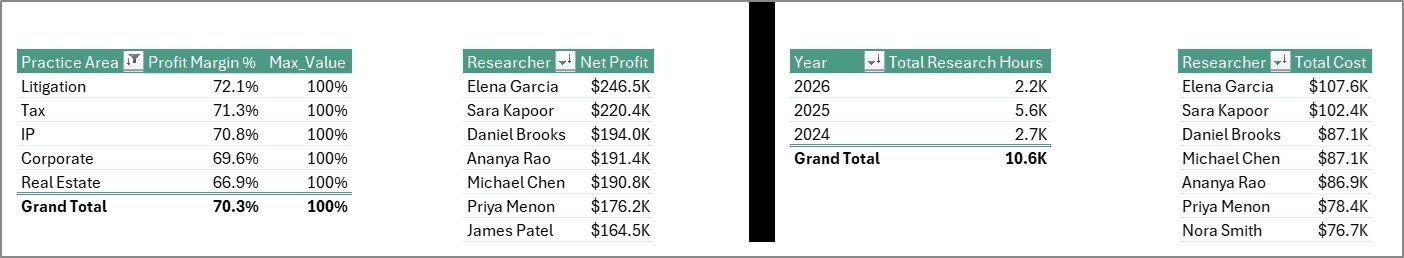
7. Support Sheet
The Support Sheet contains the pivot tables used to create the dashboard dynamically. After updating the Data Sheet, go to the Excel Data ribbon and click Refresh All. All pivots and related charts refresh together, and the sheet can be hidden for everyday users.
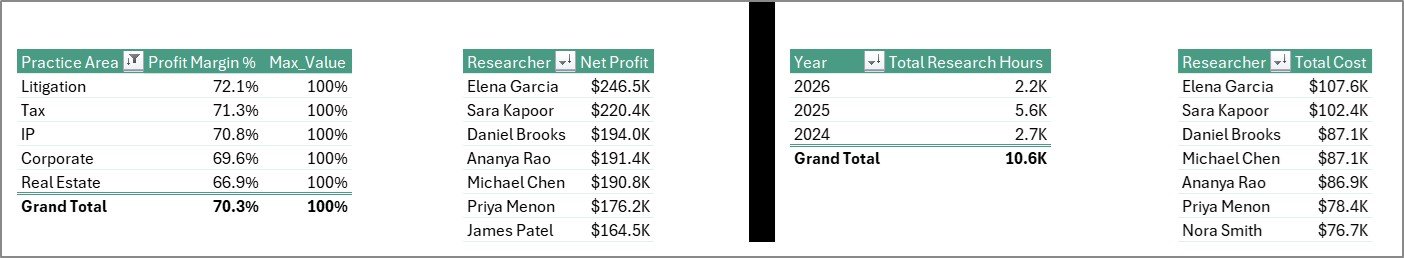
Support sheet tab
Legal Research Dashboard in Excel vs. Google Sheets vs. Paid Legal CRM/SaaS – Where This Fits
| Feature | This Excel Dashboard | Google Sheets Alternative | Paid Legal SaaS |
|---|---|---|---|
| Cost | $17.99 one-time | Template cost or custom build time | Monthly or annual subscription |
| Platform | Microsoft Excel | Browser-based spreadsheet | Vendor cloud platform |
| Setup time | Replace records and refresh pivots | Import data and adjust formulas | Implementation and onboarding |
| Real-time team collaboration | Available through OneDrive or SharePoint | Native collaboration | Usually included by plan |
| Mobile access | Excel mobile or web for light review | Google Sheets mobile app | Vendor app or browser |
| Customizable fields | Editable sheets, pivots, charts, and labels | Editable but needs careful formula control | Depends on vendor permissions |
| Year-1 cost at 5 users | $17.99 plus Microsoft licensing if needed | Low software cost plus setup time | Often hundreds or thousands |
| Legal research analytics | Billable amount, profit, hours, authorities, risk, workload, practice, and productivity views included | Must be built or adapted | May require premium reporting |
Who This Template Is For – and Who It’s Not For
This template is for law firms, legal research teams, in-house legal departments, compliance research teams, legal operations managers, and consultants who track research records and need an editable Excel dashboard.
It is not a legal research database, AI research engine, document repository, docketing platform, billing system, CRM, or secure client portal. It works best when your team already has structured research data and wants a cleaner reporting layer in Excel.
How to Use the Legal Research Dashboard in Excel
- Download and unzip the product file.
- Open the workbook in Microsoft Excel.
- Go to the Data Sheet and replace the sample rows with your own legal research records.
- Keep the same column structure so pivot tables and slicers stay connected.
- Open the Data tab in Excel and click Refresh All.
- Use slicers to filter by available fields such as month, year, practice area, researcher, jurisdiction, priority, source type, firm, risk level, and status.
- Hide the Support Sheet if you want a cleaner workbook for daily users.
Real-World Use Cases
Anika, legal research manager: reviews research hours, authorities, and completion patterns before assigning next-week workload.
Marcus, law firm partner: compares billable amount, net profit, and margin by practice area before a monthly leadership meeting.
Priya, legal operations analyst: filters by jurisdiction, priority, and risk level to explain where research effort is concentrated.
Frequently Asked Questions
What does this dashboard track?
It tracks billable amount, net profit, research hours, authorities, costs, records, priority, source type, practice area, jurisdiction, client type, firm, risk level, status, and completion percentage.
Can I replace the sample data?
Yes. Replace the sample rows in the Data Sheet with your own legal research records, then click Refresh All in Excel.
Do I need advanced Excel skills?
No. The workbook is designed for normal Excel users. More advanced users can customize charts, pivots, slicers, colors, and fields.
Can the Support Sheet be hidden?
Yes. The Support Sheet powers the dashboard and can be hidden after setup.
Is this a legal research tool?
No. This is an Excel analytics dashboard for tracking legal research work, not a legal database or AI research system.
Is this a subscription?
No. It is a one-time downloadable Excel template from NextGenTemplates.
About the Author
Built by PK – Microsoft Certified Professional with 15+ years of Excel, Google Sheets, and Power BI experience. Founder of NextGenTemplates, reaching 300K+ subscribers across YouTube channels. Every template is hand-built and tested before release.
Explore Related Templates
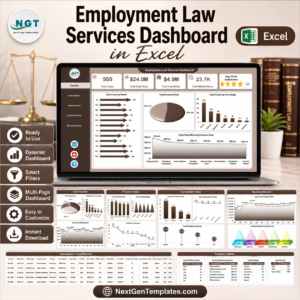
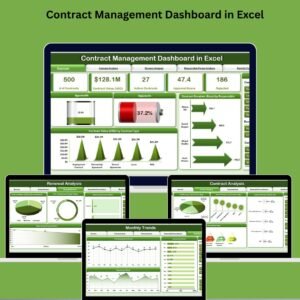
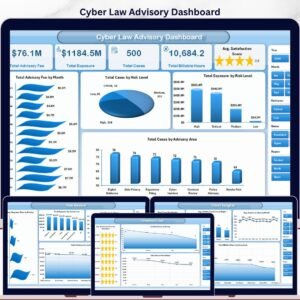
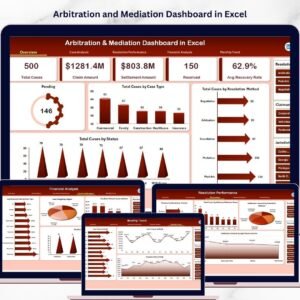
You may also like Legal Research KPI Dashboard in Excel, Intellectual Property Law Firms Dashboard in Excel, International Arbitration Panels Dashboard in Excel, and Employment Law Services Dashboard in Excel. Browse more Excel Dashboard templates and MS Excel templates.
Download the Legal Research Dashboard in Excel today and start reviewing billable amount, profit, research hours, authorities, workload, practice areas, risk, and productivity from one editable workbook.
Watch the step-by-step video tutorial:


Reviews
There are no reviews yet.