
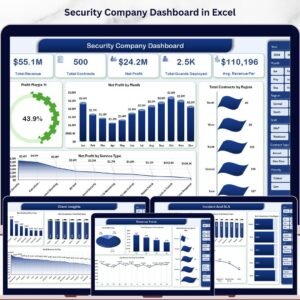
The Security Company Dashboard in Power BI tracks 5 critical business KPIs — Total Staff Cost, Total Guards Deployed, Total Service Revenue, Net Profit, and Total Contracts — across 5 interactive pages with 12+ pre-built charts and region, shift, and contract-type slicers. Security companies using manual spreadsheets spend 6–10 hours per month compiling reports that this dashboard generates in under 15 minutes. Setup is simple: open the .pbix file in Power BI Desktop, connect your data source, and every visual refreshes automatically.
🌍 Join 8,400+ teams in 40+ countries using NextGenTemplates to replace costly SaaS subscriptions with one-time-purchase Power BI Dashboard Templates.
✅ Instant download · One-time payment · No subscription · No per-user fees · Lifetime access
🔑 Key Features of Security Company Dashboard in Power BI
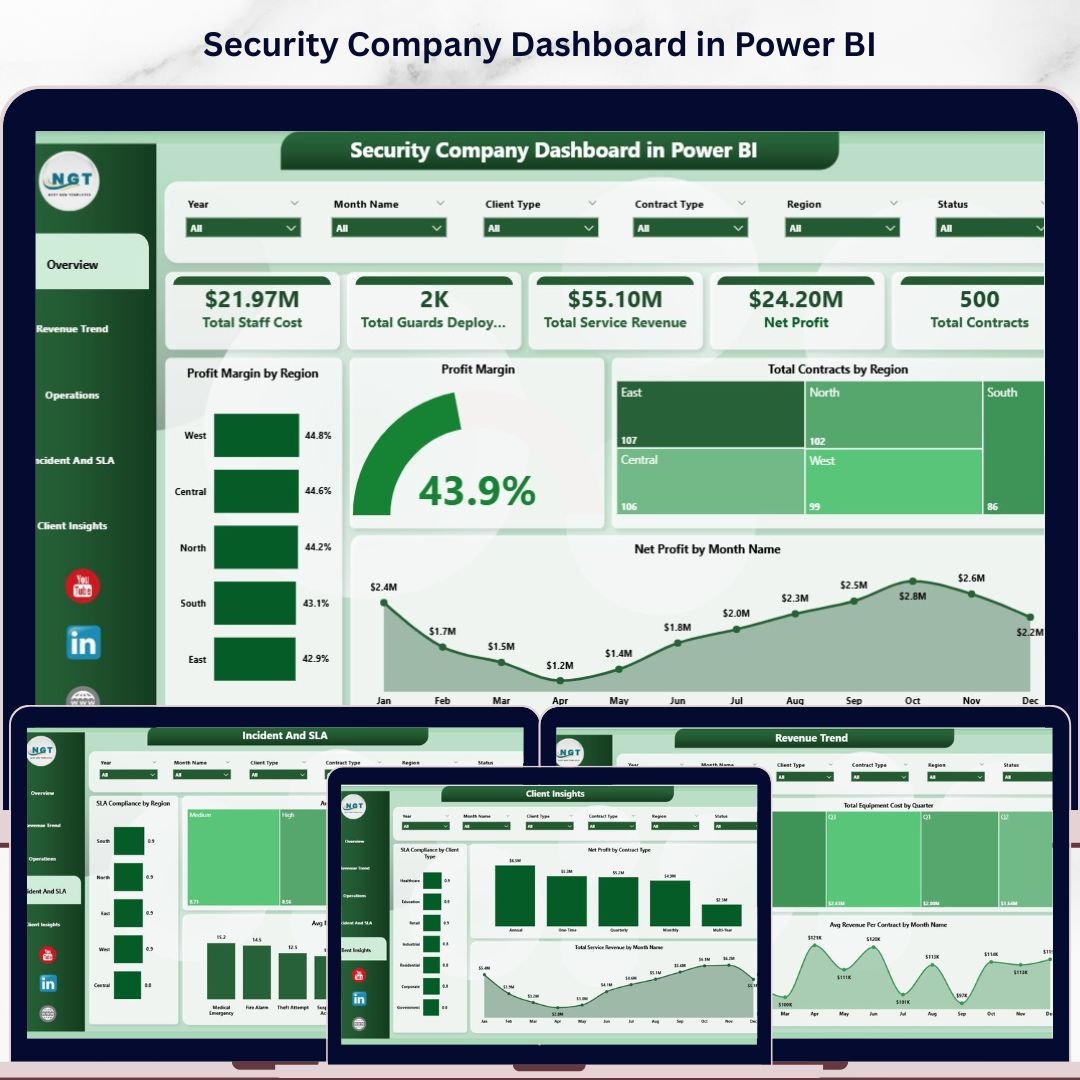
🔹 5 Executive KPI Cards (Overview Page) – Instantly shows Total Staff Cost, Total Guards Deployed, Total Service Revenue, Net Profit, and Total Contracts — giving leadership a full business snapshot at one glance.
🔹 Profit Margin Analysis by Region – The Overview page includes Profit Margin by Region and an overall Profit Margin chart, so regional managers can immediately see which territories are underperforming and where to reallocate guards.
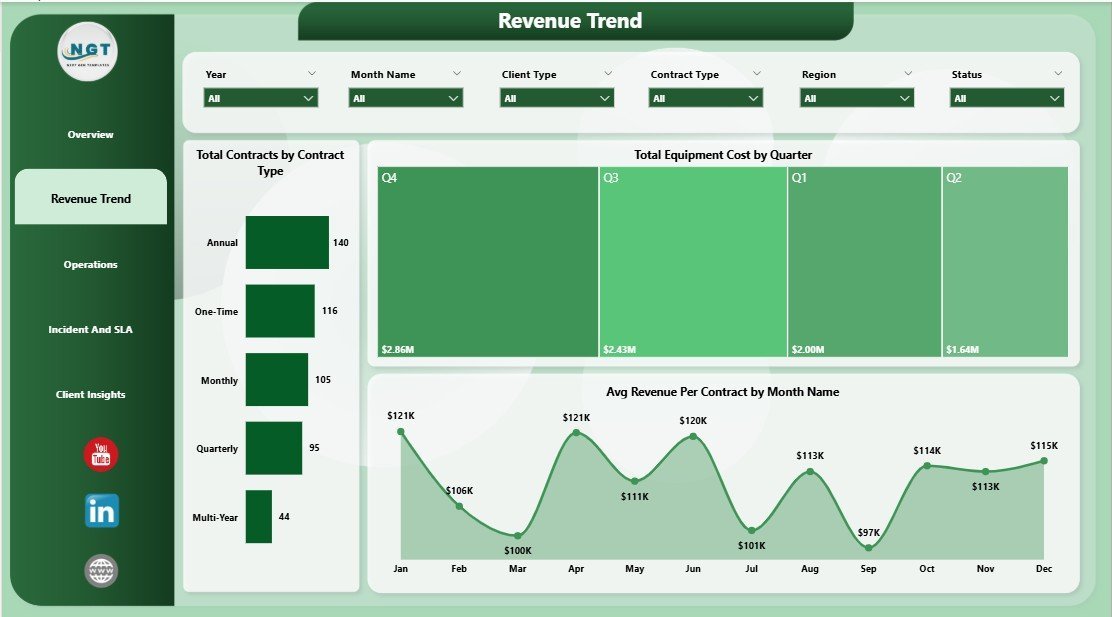
🔹 Revenue Trend Page – Tracks Total Contracts by Contract Type, Total Equipment Cost by Quarter, and Avg Revenue Per Contract by Month Name — giving finance leads the data needed to forecast quarterly revenue accurately.
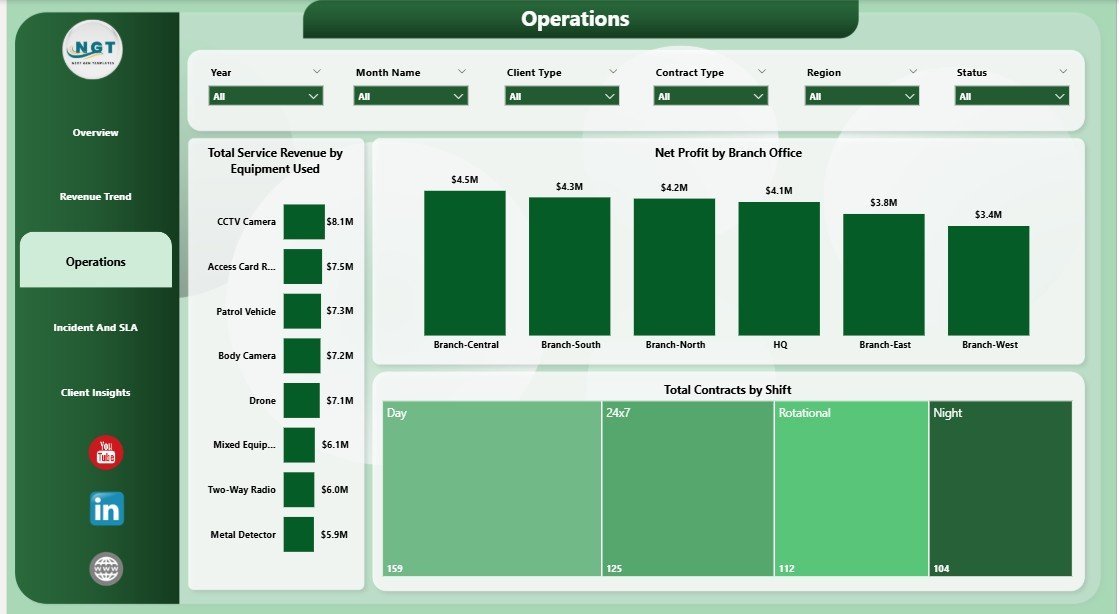
🔹 Operations Page – Visualizes Total Service Revenue by Equipment Used, Net Profit by Branch Office, and Total Contracts by Shift, making it easy to compare branch profitability and identify high-cost shifts.
🔹 Incident & SLA Compliance Tracking – Displays SLA Compliance by Region, Avg Response Time by Priority, and Avg Response Time by Incident Type — the three metrics security operations managers need most to satisfy client contracts and pass audits.
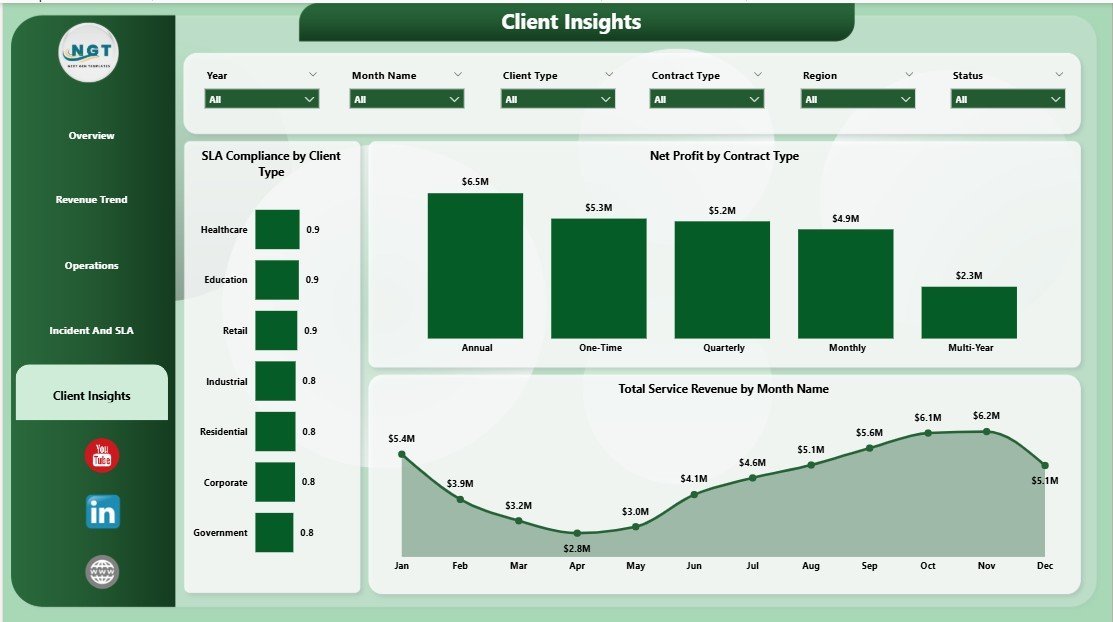
🔹 Client Insights Page – Breaks down SLA Compliance by Client Type, Net Profit by Contract Type, and Total Service Revenue by Month Name — valuable for account managers preparing client review meetings.
🔹 Interactive Slicers – Filter every page by region, contract type, branch office, shift, and more for instant segmented analysis without rebuilding reports.
📦 What’s Inside the Security Company Dashboard in Power BI
Download includes one .pbix file with 5 fully designed pages, pre-loaded with realistic security operations sample data:
📄 Page 1 — Overview: KPI cards (Total Staff Cost, Total Guards Deployed, Total Service Revenue, Net Profit, Total Contracts); charts for Profit Margin by Region, Profit Margin, Total Contracts by Region, Net Profit by Month Name; multi-field slicers.
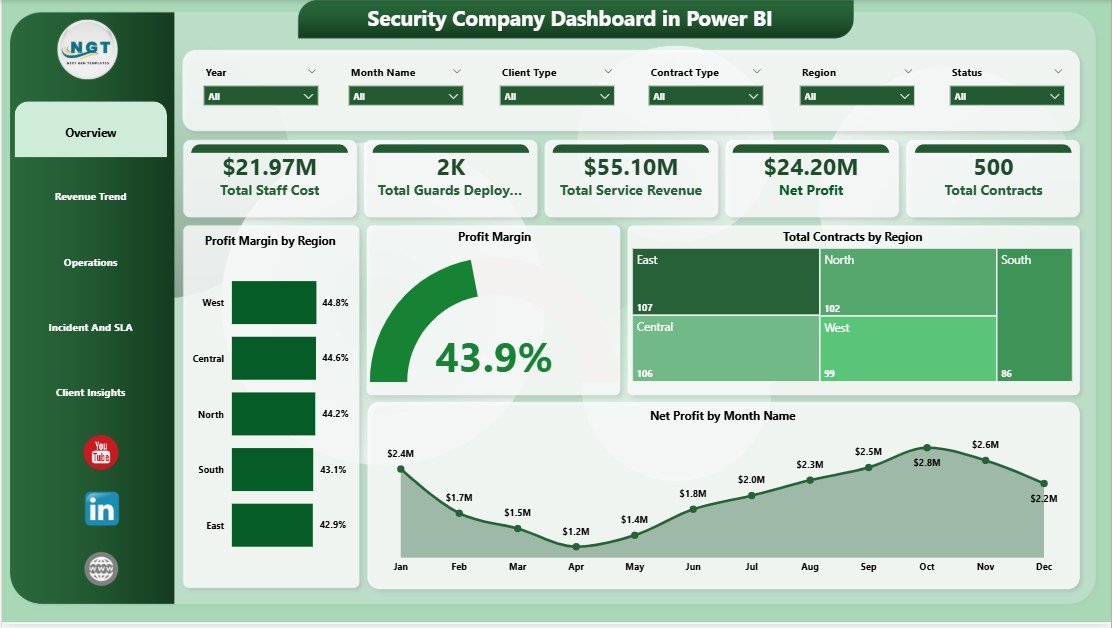
Security Company Dashboard in Power BI – Overview Page
📄 Page 2 — Revenue Trend: Total Contracts by Contract Type, Total Equipment Cost by Quarter, Avg Revenue Per Contract by Month Name — the key revenue pattern visuals for quarterly planning.

Security Company Dashboard in Power BI – Revenue Trend Page
📄 Page 3 — Operations: Total Service Revenue by Equipment Used, Net Profit by Branch Office, Total Contracts by Shift — branch-level profitability and shift analysis.
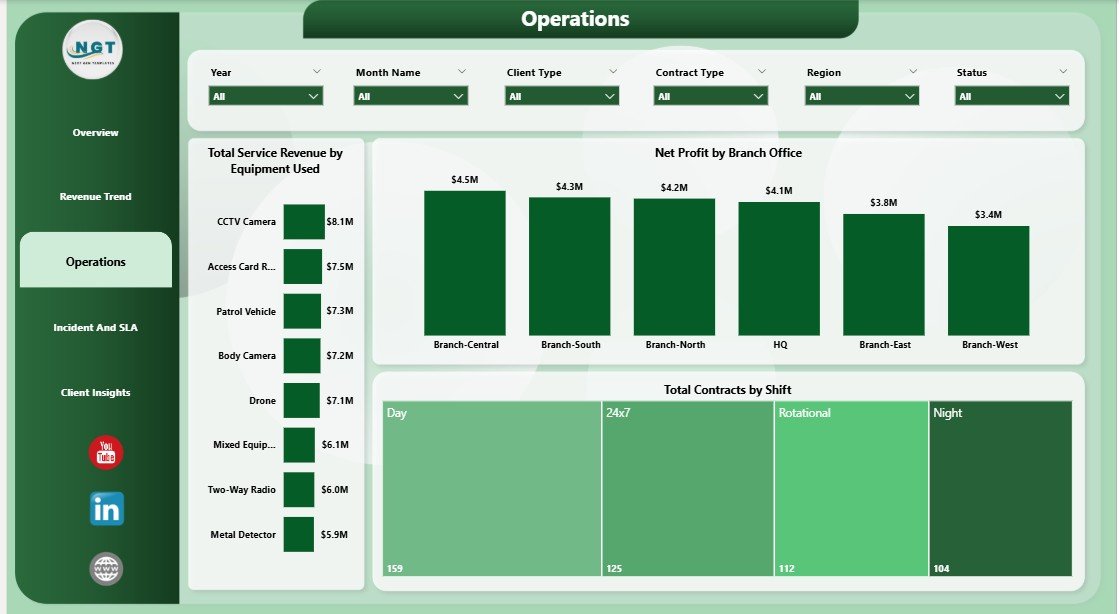
Security Company Dashboard in Power BI – Operations Page
📄 Page 4 — Incident & SLA: SLA Compliance by Region, Avg Response Time by Priority, Avg Response Time by Incident Type — audit-ready compliance metrics.
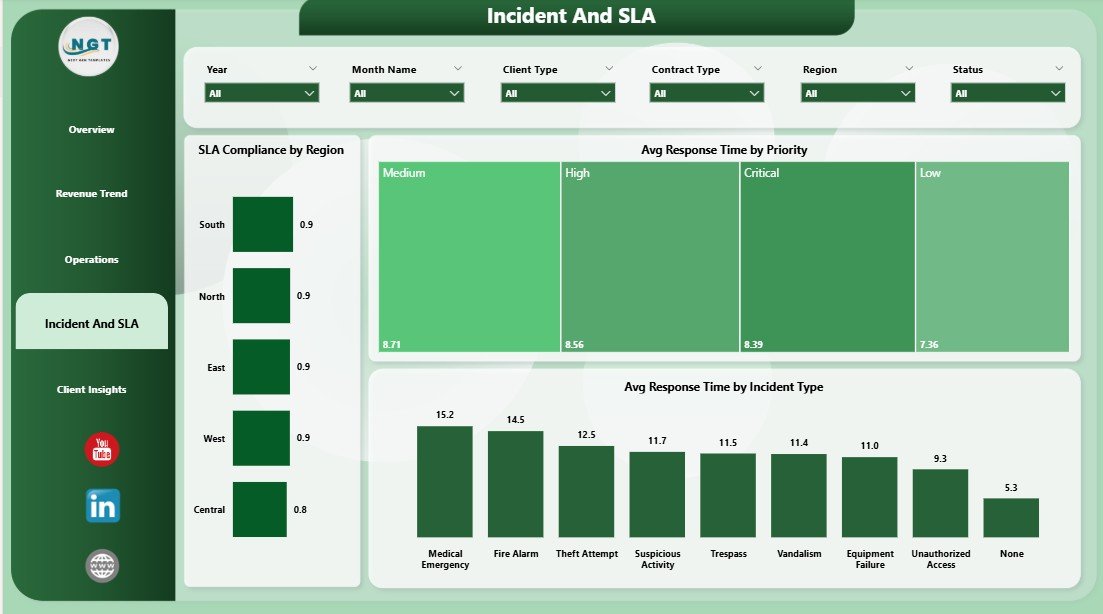
Security Company Dashboard in Power BI – Incident & SLA Page
📄 Page 5 — Client Insights: SLA Compliance by Client Type, Net Profit by Contract Type, Total Service Revenue by Month Name — ideal for client review presentations.
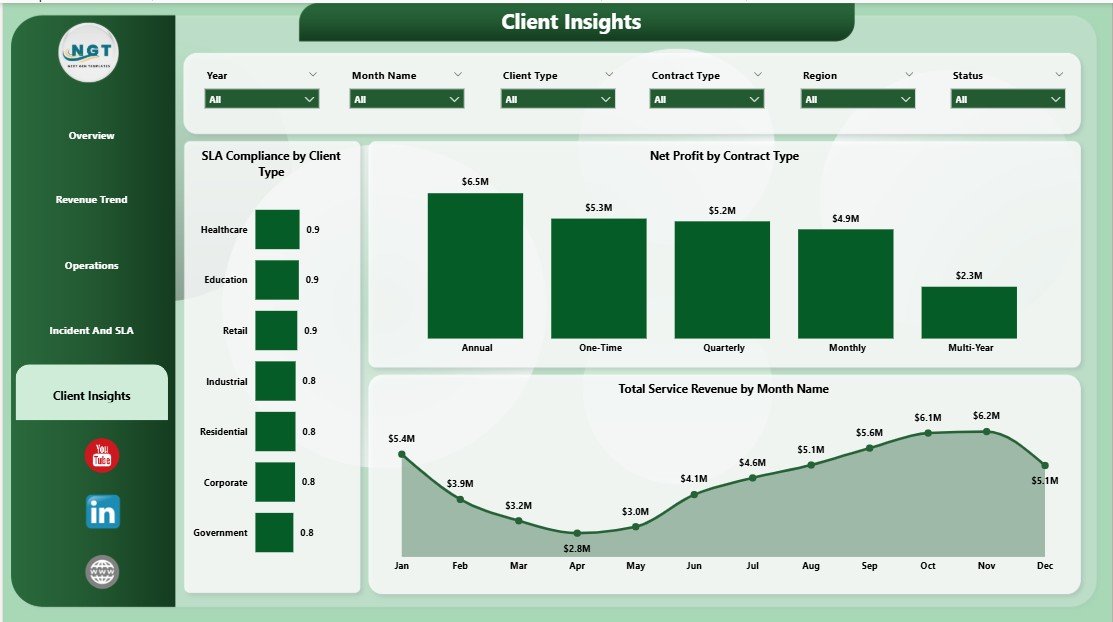
Security Company Dashboard in Power BI – Client Insights Page
📊 Security Company Dashboard in Power BI vs. Tableau vs. Trackforce Valiant — Where This Fits
| Feature | Security Company Dashboard in Power BI | Tableau Desktop | Trackforce Valiant |
|---|---|---|---|
| Cost | $17.99 one-time ✅ | $70/user/month | $50–100+/user/month |
| Platform | Power BI Desktop (free) ✅ | Requires Tableau license | Cloud SaaS |
| Setup time | Under 15 minutes ✅ | Hours of configuration | Days of onboarding |
| Security-specific pages | 5 pages (Overview, Revenue, Operations, SLA, Clients) ✅ | Build from scratch | Partial — guard-focused |
| SLA & Incident tracking | Built-in ✅ | Custom build required | ✅ Advanced |
| Profit Margin by Region | Built-in ✅ | Custom build required | ❌ Not included |
| Customizable fields | Full Power BI flexibility ✅ | ✅ | Limited |
| Year-1 cost (5 users) | $17.99 total ✅ | $4,200 | $3,000–6,000 |
| No per-user fees | ✅ | ❌ | ❌ |
For security companies that need clear KPI visibility across revenue, operations, and SLA without paying $50–100+/user/month, the Security Company Dashboard in Power BI is the practical one-time solution.
👥 Who This Template Is For — and Who It’s Not For
✅ This template is built for:
- Security company owners and operations managers at 10–500 guard businesses who need monthly performance reporting
- Finance leads tracking staff costs, equipment expenses, and profit margins across multiple regions or branch offices
- Operations supervisors monitoring SLA compliance, incident response times, and shift-level contract performance
- Account managers preparing client review presentations with revenue and SLA data by contract type
❌ This template is NOT for:
- Enterprise security firms needing real-time IoT guard-tracking integrations or SOC-2 compliance tooling
- Teams without Power BI Desktop (free download from Microsoft — but requires a Windows or Mac computer)
- Companies needing live streaming data from access-control hardware (this template works with data refreshed via Excel/CSV input)
⚙️ How to Use the Security Company Dashboard in Power BI
- Download the .pbix file from your purchase confirmation email.
- Open in Power BI Desktop (free from Microsoft’s website).
- Connect your data by replacing the sample Excel/CSV data with your own security operations records.
- Refresh the dashboard — all 5 pages and 12+ visuals update automatically.
- Use slicers to filter by region, shift, contract type, and branch office as needed.
- Share via Power BI Service or export pages to PDF for stakeholder reporting.
💼 Real-World Use Cases
Marcus manages operations for a 120-guard regional security firm. Every Monday he opens the Security Company Dashboard in Power BI, filters by branch office, and reviews the Net Profit by Branch Office chart to identify which location underperformed last week — without waiting for a manual report from accounting. What used to take two days now takes ten minutes.
Priya is the finance director at a multi-site contract security provider. She uses the Revenue Trend page to track Avg Revenue Per Contract by Month and Total Equipment Cost by Quarter during quarterly board presentations — showing management exactly where margins are tightening and which contract types drive the most profit.
James runs the SLA compliance team for a mid-sized security company. Before client renewal meetings, he pulls up the Client Insights page to show SLA Compliance by Client Type and Net Profit by Contract Type — giving account managers the data to justify pricing increases or flag at-risk contracts before they churn.
❓ Frequently Asked Questions
What KPIs does the Security Company Dashboard in Power BI track?
The Security Company Dashboard in Power BI tracks 5 executive KPIs: Total Staff Cost, Total Guards Deployed, Total Service Revenue, Net Profit, and Total Contracts. Across 5 pages it also monitors Profit Margin by Region, SLA Compliance, Avg Response Time by Incident Type, and Net Profit by Branch Office — 12+ metrics in total.
Do I need a paid Power BI license to use this dashboard?
No. The Security Company Dashboard in Power BI runs on Power BI Desktop, which is free to download from Microsoft. A paid Power BI Pro license is only needed if you want to publish the dashboard to Power BI Service for team sharing — not required for single-user reporting.
How long does setup take?
Most users are up and running in under 15 minutes. Download the .pbix file, open it in Power BI Desktop, replace the sample data with your own Excel or CSV data, and click Refresh. All 5 pages and every visual update automatically with no formula or chart rebuilding needed.
How does this compare to Trackforce Valiant or similar guard management software?
Guard management platforms like Trackforce Valiant typically cost $50–100+/user/month and focus on scheduling and patrol tracking. The Security Company Dashboard in Power BI costs $17.99 once and focuses on financial KPIs — profit margins, revenue trends, SLA compliance — that guard scheduling software doesn’t provide. They complement each other rather than compete.
Can I customize the dashboard for my specific regions and contract types?
Yes. Since the Security Company Dashboard in Power BI is a standard .pbix file, you can edit visuals, rename fields, add new pages, and adjust slicers in Power BI Desktop. The template is designed as a starting point — most teams customize it within an hour to match their own territory and contract structure.
Is the Excel version of this dashboard also available?
Yes. The Security Company Dashboard in Excel is available separately if your team prefers working directly in Excel without Power BI Desktop. Both templates cover the same 5 pages and KPI set.
What file is included in the download?
The download includes one .pbix Power BI Desktop file with 5 pre-built pages, sample security operations data, and all DAX measures pre-configured. No additional software or plugins are required beyond free Power BI Desktop.
👤 About the Author
Built by PK — Microsoft Certified Professional with 15+ years of Excel, Google Sheets, and Power BI experience. Founder of NextGenTemplates, reaching 300K+ subscribers across YouTube channels (@PK-AnExcelExpert, @NextGenTemplates, @NeoTechNavigators). Every template is hand-built and tested before release.
🔗 Explore Related Templates
🔹 Security KPI Dashboard in Power BI — MTD/YTD KPI tracking for incidents, patrols, access control, and compliance.
🔹 Security Company Dashboard in Excel — The Excel version of this dashboard for teams that prefer working in spreadsheets.
🔹 Browse all Power BI Dashboard Templates for industry-specific reporting solutions.
📖 Click here to read the Detailed Blog Post
🎥 Visit our YouTube channel for step-by-step video tutorials
Watch the step-by-step video tutorial:


Reviews
There are no reviews yet.