


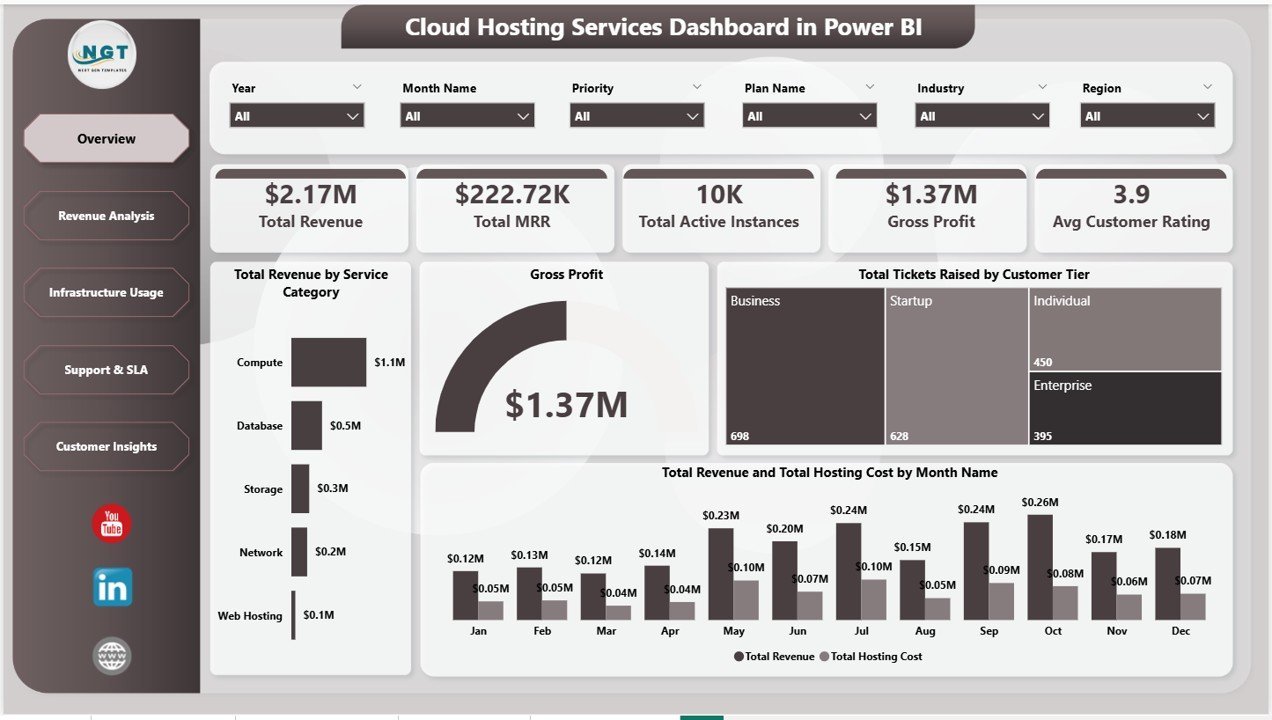



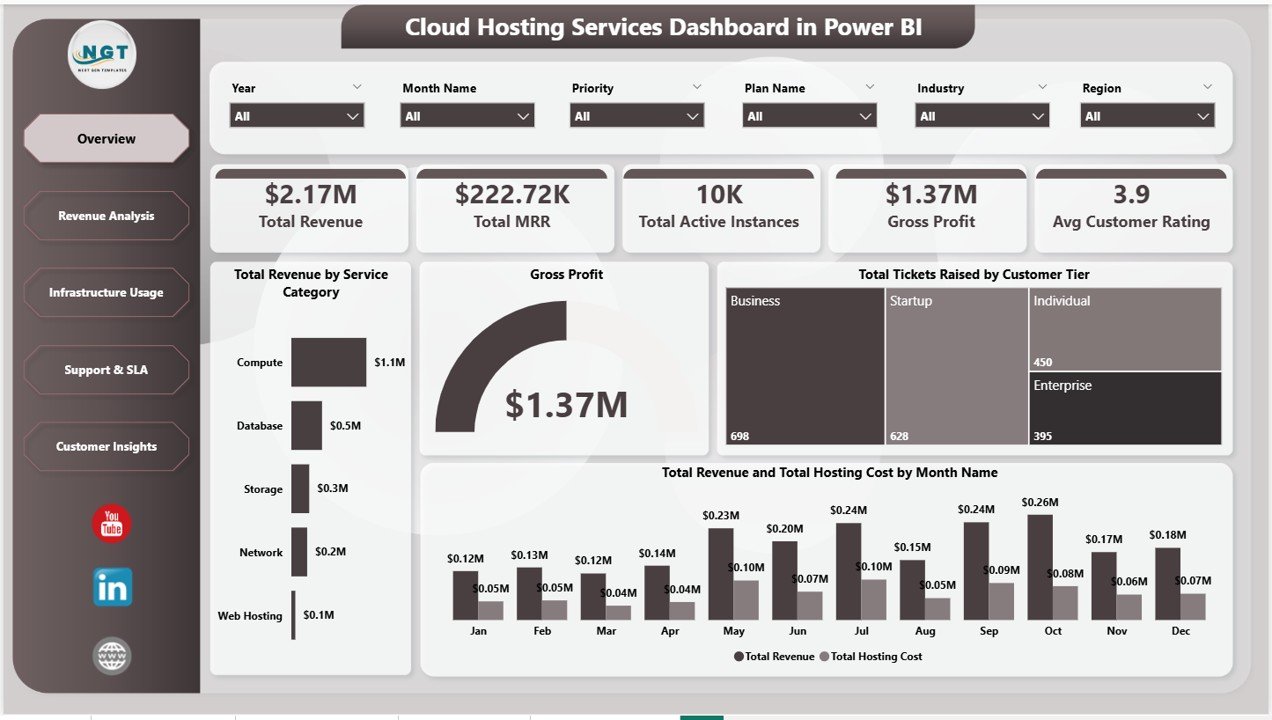
The Cloud Hosting Services Dashboard in Power BI tracks 5 mission-critical KPIs — Total Revenue, Total MRR, Total Active Instances, Gross Profit, and Avg Customer Rating — across 4 interactive analysis pages with 12 pre-built charts and multi-dimension slicer filters. Open the .pbix file in Power BI Desktop, connect your data source, and every visualization updates automatically. Setup takes under 10 minutes.
🌍 Join 8,400+ teams in 40+ countries using NextGenTemplates to replace expensive cloud monitoring SaaS tools with one-time-purchase Power BI, Excel, and Google Sheets templates.
✅ Instant download · One-time payment · No subscription · No per-user fees · Lifetime access
🔑 Key Features of Cloud Hosting Services Dashboard in Power BI
🔹 5 KPI Summary Cards — Total Revenue, Total MRR, Total Active Instances, Gross Profit, and Avg Customer Rating on the Overview page, giving instant hosting performance visibility. All five metrics update automatically whenever the data source is refreshed.
🔹 12 Pre-built Charts Across 4 Pages — This dashboard covers revenue breakdown by service category, billing cycle, customer tier, and industry; infrastructure utilization by data center and service type; and SLA performance by region and support agent. Every chart is pre-configured and refreshes with one click in Power BI Desktop.
🔹 Multi-Dimension Slicer Filters — Apply filters across all charts simultaneously using slicers for Service Category, Customer Tier, Billing Cycle, Industry, Data Center, Region, and Priority. One slicer click changes every visual on the page instantly.
🔹 Revenue vs. Hosting Cost Analysis — The Overview page includes a combined monthly chart showing Total Revenue and Total Hosting Cost side-by-side, giving instant gross margin visibility without any manual calculations.
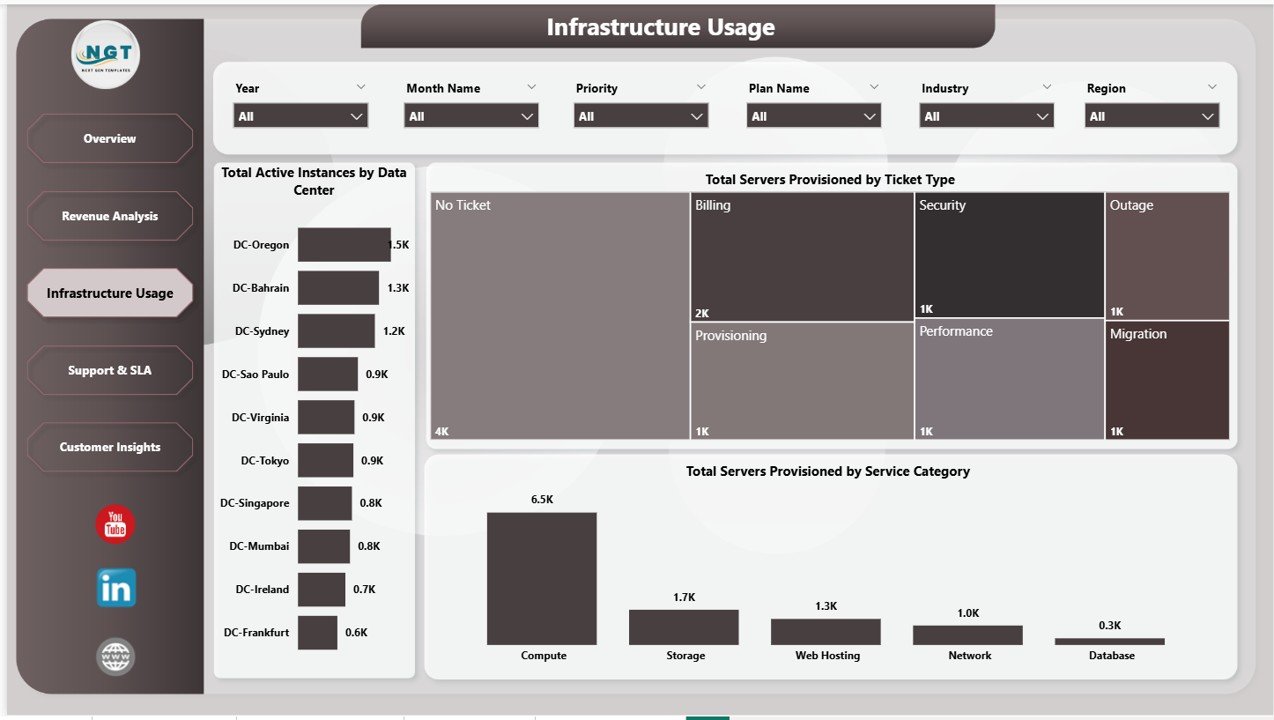
🔹 Infrastructure Usage Tracking — Monitor active instances and server provisioning across data centers, service categories, and ticket types to identify capacity bottlenecks and underutilized resources before they affect SLA performance.
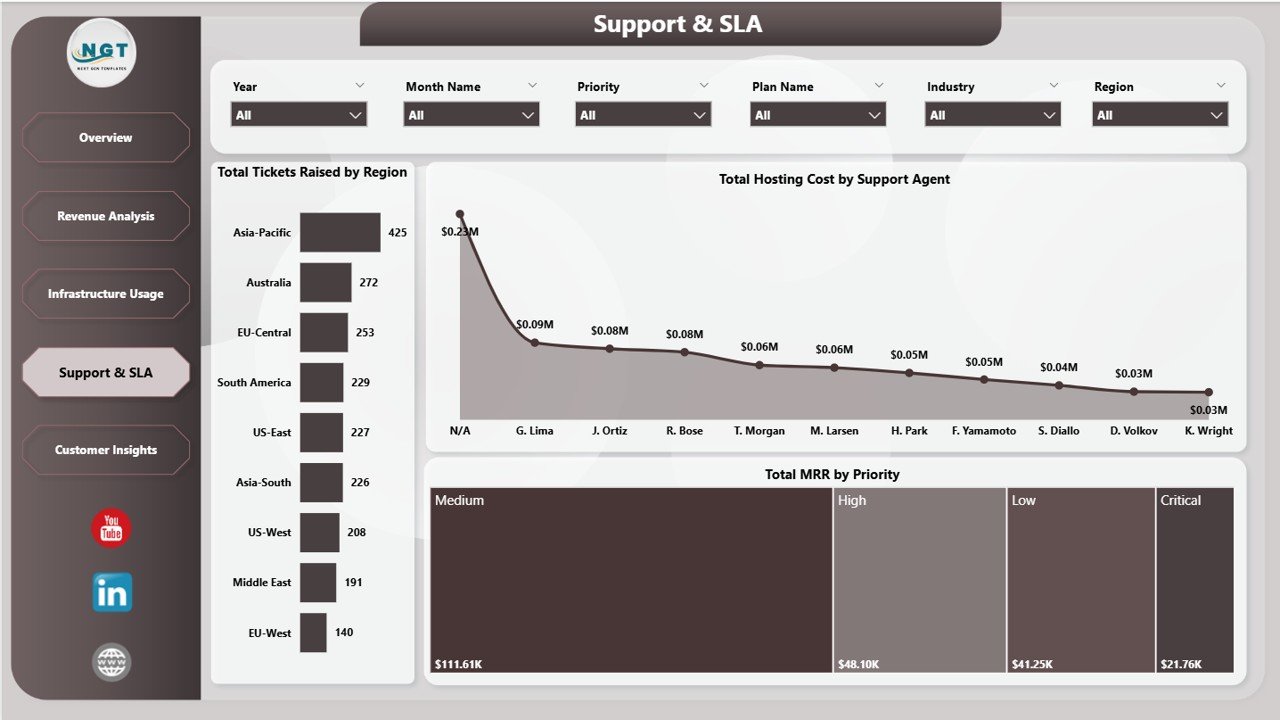
🔹 Support and SLA Intelligence — Track ticket volumes by region, hosting costs by support agent, and MRR by priority level to manage service delivery quality and optimise support team allocation.
🔹 Power BI Desktop Compatible — Built as a .pbix file. Requires Power BI Desktop, which is free to download from Microsoft. Works with any Excel or CSV data source via Power Query. Compatible with all current Power BI Desktop versions.
📦 What’s Inside the Cloud Hosting Services Dashboard in Power BI
Page 1: Overview
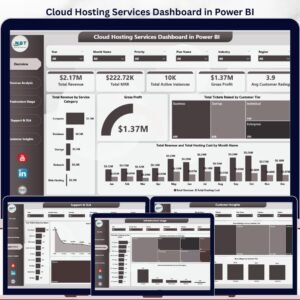
The Overview page displays 5 high-level KPI cards — Total Revenue, Total MRR, Total Active Instances, Gross Profit, and Avg Customer Rating — alongside charts for Total Revenue by Service Category, Gross Profit, Total Tickets Raised by Customer Tier, and Total Revenue and Total Hosting Cost by Month Name. Multiple slicers enable instant filtered views across all charts simultaneously.
Page 2: Revenue Analysis
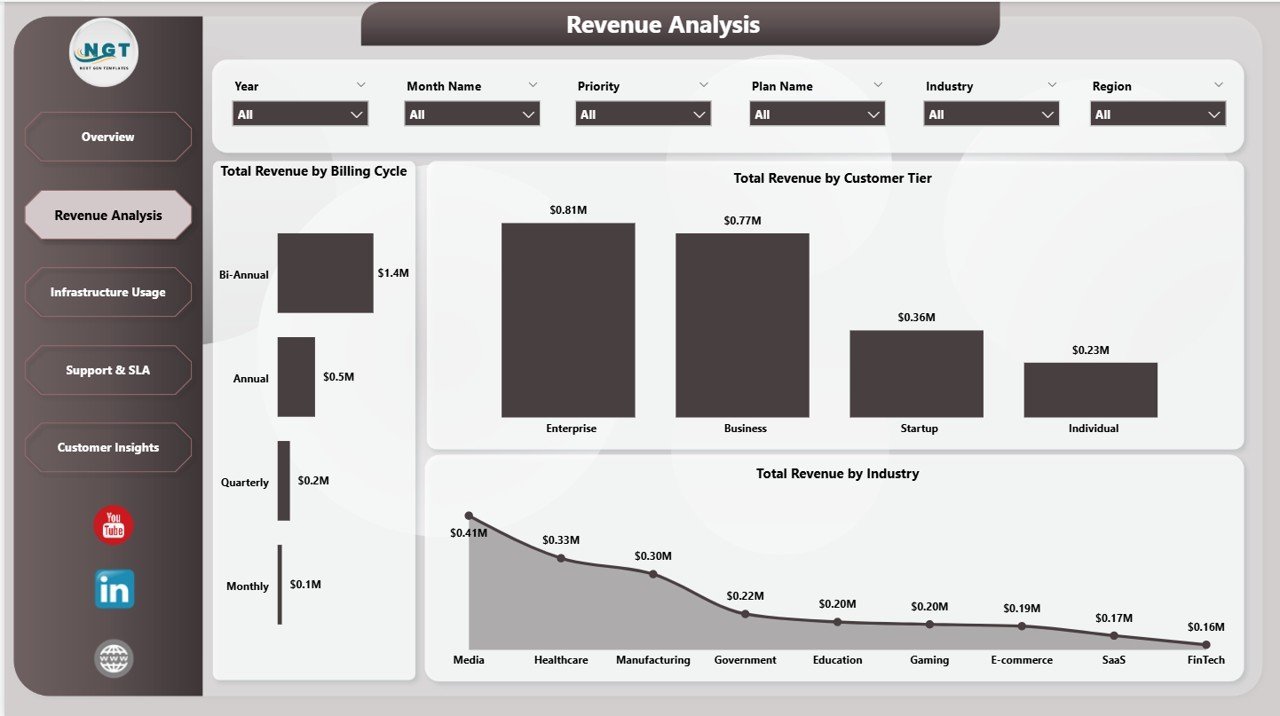
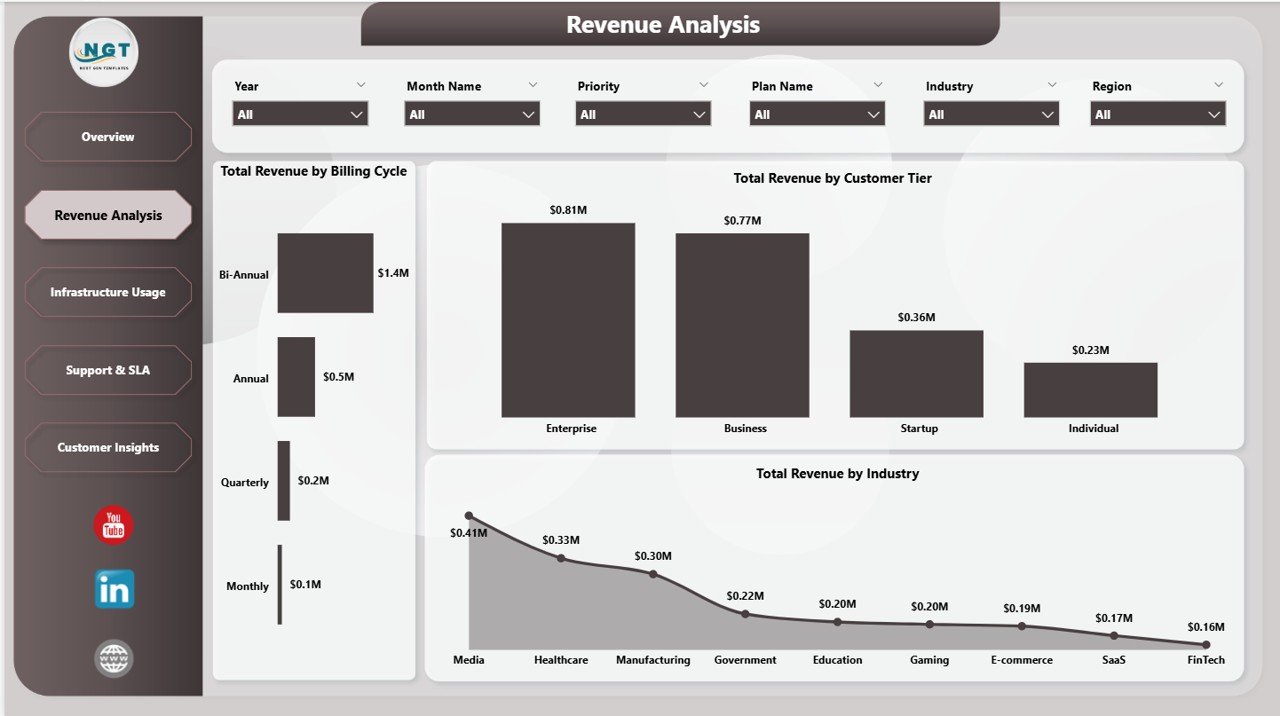
The Revenue Analysis page breaks down revenue streams across three dimensions: Total Revenue by Billing Cycle, Total Revenue by Customer Tier, and Total Revenue by Industry. Use this page to identify which subscription models, customer segments, and vertical industries generate the highest recurring revenue for your hosting business.
Page 3: Infrastructure Usage
The Infrastructure Usage page tracks server and instance deployment across three charts: Total Active Instances by Data Center, Total Servers Provisioned by Ticket Type, and Total Servers Provisioned by Service Category. Operations teams use this page to spot under-provisioned or over-utilised data centers and service tiers before capacity issues escalate.
Page 4: Support and SLA
The Support and SLA page maps service delivery performance through three charts: Total Tickets Raised by Region, Total Hosting Cost by Support Agent, and Total MRR by Priority. This page helps support managers identify high-cost agents, high-ticket regions, and where SLA pressure correlates with recurring revenue most at risk of churn.
📊 Cloud Hosting Services Dashboard in Power BI vs. Tableau/Qlik vs. Paid Cloud Monitoring SaaS — Where This Fits
| Feature | Cloud Hosting Services Dashboard in Power BI | Tableau / Qlik | Datadog / New Relic |
|---|---|---|---|
| Cost | $17.99 one-time ✅ | $70–$115/user/month | $15–$69/host/month |
| Platform | Power BI Desktop (free) ✅ | Tableau Desktop / Qlik Sense | Browser-based SaaS |
| Setup time | Under 10 minutes ✅ | Hours of data modeling | Hours of agent config |
| Revenue & MRR tracking | ✅ Built-in | Requires custom build | ❌ Infrastructure only |
| No recurring subscription | ✅ | ❌ | ❌ |
| Fully customizable | ✅ Edit any visual | Yes (complex scripting) | Limited presets |
| SLA & support analytics | ✅ | Requires custom build | Partial |
| Year-1 cost (5 users) | $17.99 total ✅ | $4,200–$6,900 | $900–$4,140 |
For cloud hosting providers that need revenue, infrastructure, and SLA analytics in one place without paying per-seat or per-host SaaS fees, the Cloud Hosting Services Dashboard in Power BI sits in the sweet spot.
👥 Who This Template Is For — and Who It’s Not For
✅ This template is built for:
- Cloud hosting companies and managed service providers (MSPs) tracking revenue, MRR, and infrastructure KPIs in Power BI
- IT managers and operations analysts monitoring data center utilization and server provisioning across service categories
- Support team leads tracking SLA compliance, ticket volumes, and agent-level hosting cost efficiency
- Finance teams at hosting companies who need gross profit and MRR visibility without expensive BI tools
- Anyone replacing a per-seat cloud monitoring subscription with a one-time-purchase Power BI dashboard template
❌ This template is NOT for:
- Teams that need real-time server uptime monitoring — this dashboard is for business KPI reporting, not infrastructure alerting or incident response
- Enterprise teams requiring SOC 2 compliance, SSO, or centralized Power BI workspace governance (consider Power BI Premium for those needs)
- Users without Power BI Desktop — the .pbix file requires the free Power BI Desktop app from Microsoft to open and edit
⚙️ How to Use the Cloud Hosting Services Dashboard in Power BI
- Download and unzip the file. Open the .pbix file in Power BI Desktop (free download from Microsoft).
- In the Power Query Editor, replace the sample data source path with your own Excel or CSV hosting data file.
- Click Close & Apply — all 12 charts, 5 KPI cards, and slicers refresh automatically with your data.
- Use the slicers on each page to filter by Service Category, Customer Tier, Billing Cycle, Region, Data Center, Industry, or Priority.
- Navigate between Overview, Revenue Analysis, Infrastructure Usage, and Support & SLA pages using the page tabs at the bottom.
- Publish to Power BI Service to share filtered, interactive reports with your team or leadership via a browser link.
💼 Real-World Use Cases
Arun manages operations at a mid-size cloud VPS hosting provider. He uses the Cloud Hosting Services Dashboard in Power BI to compare gross profit across service categories, track active instance trends by data center, and present monthly MRR reports to the leadership team — all without paying $69/host/month for Datadog.
Priya is a finance analyst at a SaaS-hosting startup. She connects the dashboard to their billing data CSV and monitors Total Revenue by Billing Cycle and Customer Tier every month. The Revenue Analysis page helped her identify that annual-billed enterprise customers generate 3× the MRR of monthly-billed SMB accounts — a finding that shifted their sales team’s focus.
James leads a support team at a dedicated server hosting company. He uses the Support and SLA page to identify which regions generate the highest ticket volumes and which support agents have the highest associated hosting costs, helping him reallocate team resources and reduce per-ticket cost measurably quarter over quarter.
❓ Frequently Asked Questions
What KPIs does the Cloud Hosting Services Dashboard in Power BI track?
The Cloud Hosting Services Dashboard in Power BI tracks 5 KPIs: Total Revenue, Total MRR, Total Active Instances, Gross Profit, and Avg Customer Rating. These are displayed as KPI cards on the Overview page and broken down further across Revenue Analysis, Infrastructure Usage, and Support & SLA pages with 12 charts total.
Do I need Power BI Pro or Premium to use this dashboard?
No. The Cloud Hosting Services Dashboard in Power BI works with Power BI Desktop, which is free from Microsoft. You only need Power BI Pro or Premium if you want to publish and share reports through Power BI Service — for personal or team use on a local machine, the free Desktop version is sufficient.
How long does setup take?
Setup takes under 10 minutes. Download the .pbix file, open it in Power BI Desktop, replace the sample data source with your own Excel or CSV file in Power Query, and click Close & Apply. All 12 charts, 5 KPI cards, and slicer filters refresh automatically with your data.
How does this compare to Datadog or New Relic for cloud monitoring?
The Cloud Hosting Services Dashboard in Power BI is a business KPI reporting tool — it tracks revenue, MRR, gross profit, and SLA performance analytics. Datadog and New Relic focus on real-time infrastructure monitoring and cost $15–$69/host/month. This template costs $17.99 once and covers the business performance layer those tools don’t provide.
Can I add more pages or charts to this dashboard?
Yes. The .pbix file is fully editable in Power BI Desktop. You can add new report pages, create additional visuals, write custom DAX measures, or modify existing charts. The data model is completely open — nothing is locked or protected.
Is there an Excel version of this dashboard?
Yes. The Cloud Hosting Services Dashboard in Excel is also available — a fully pivot-driven, macro-free Excel dashboard with the same 5 KPI cards and 4 analysis pages, ideal for teams that prefer Excel over Power BI.
What data format does this dashboard support?
The Cloud Hosting Services Dashboard in Power BI connects to Excel (.xlsx) and CSV data sources via Power Query. The sample data includes columns for Service Category, Billing Cycle, Customer Tier, Industry, Data Center, Region, Priority, Support Agent, Revenue, MRR, Hosting Cost, Gross Profit, Active Instances, and Ticket counts.
👤 About the Author
Built by PK — Microsoft Certified Professional with 15+ years of Excel, Google Sheets, and Power BI experience. Founder of NextGenTemplates, reaching 300K+ subscribers across YouTube channels (@PK-AnExcelExpert, @NextGenTemplates, @NeoTechNavigators). Every template is hand-built and tested before release.
🔗 Explore Related Templates
Also available: Cloud Hosting Services Dashboard in Excel — same 5 KPI cards and 4 analysis pages built on Excel pivot tables, for teams that prefer Excel over Power BI.
🔹 Business Travel Services Dashboard in Power BI — track travel bookings, spend, and compliance KPIs in Power BI.
🔹 Cybersecurity Report in Excel — monitor security incidents, vulnerability trends, and compliance metrics.
🔹 IT Hardware Upgrade Request Tracker in Excel — manage hardware requests, approvals, and IT asset upgrades efficiently.
Browse all Power BI Dashboard Templates in our catalog.
📖 Click here to read the Detailed Blog Post
🎥 Visit our YouTube channel for step-by-step video tutorials
👉 YouTube.com/@NextGenTemplates
📅 Last updated: May 2026
Watch the step-by-step video tutorial:
YouTube
































Reviews
There are no reviews yet.