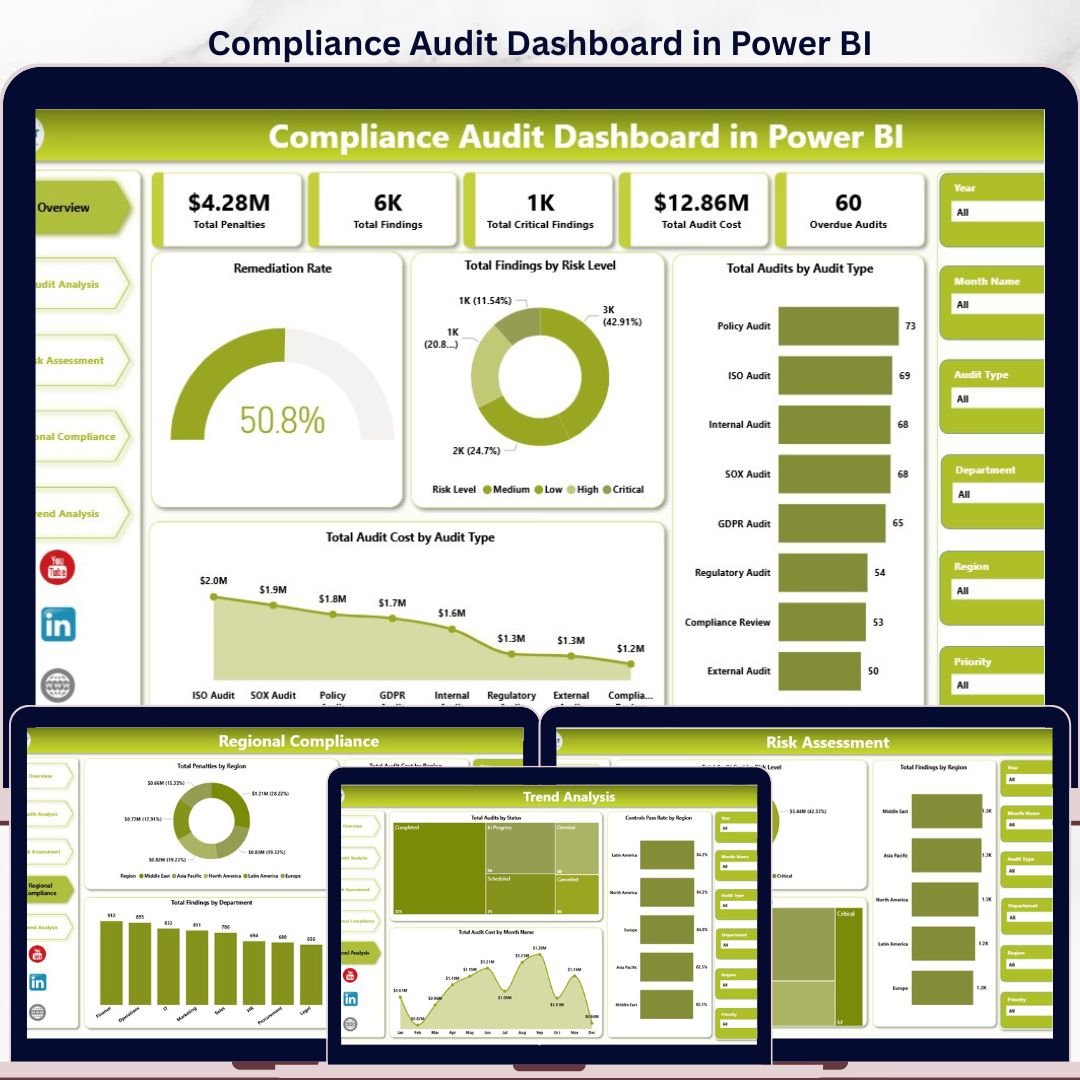

Compliance Audits Dashboard in Power BI gives compliance, internal audit, and GRC teams a 5-page audit reporting model with 5 executive KPI cards, 15 analysis visuals, and interactive slicers for audit type, department, region, risk level, priority, status, and month. Audit teams often spend 6 to 12 hours preparing monthly committee reports from spreadsheets and GRC exports. This .pbix template turns those records into a refreshable Power BI dashboard for a one-time $17.99 purchase, with no subscription and no per-user reporting fee.
Use it to monitor Total Penalties, Total Findings, Total Critical Findings, Total Audit Cost, and Overdue Audits in one place. The dashboard is built for Power BI Desktop, so you can replace the sample data, refresh the report, and customize the visuals for your own audit framework.
Key Features of Compliance Audits Dashboard in Power BI
- 5 executive KPI cards covering penalties, findings, critical findings, audit cost, and overdue audits.
- 5 Power BI report pages for Overview, Audit Analysis, Risk Assessment, Regional Compliance, and Trend Analysis.
- 15 ready-made visuals covering remediation, risk level, audit type, department, region, priority, status, and month trends.
- Interactive slicers help leaders filter the dashboard during audit reviews without rebuilding charts.
- Editable .pbix file lets you change colors, labels, measures, pages, and data connections in Power BI Desktop.
- One-time purchase for teams that want reporting visibility before investing in a full GRC platform.
What’s Inside the Compliance Audits Dashboard in Power BI
The download includes one Power BI Desktop file with five analysis pages and sample compliance audit data. The Overview page shows Total Penalties, Total Findings, Total Critical Findings, Total Audit Cost, and Overdue Audits at the top. It also includes Remediation Rate, Total Findings by Risk Level, Total Audits by Audit Type, and Total Audit Cost by Audit Type.
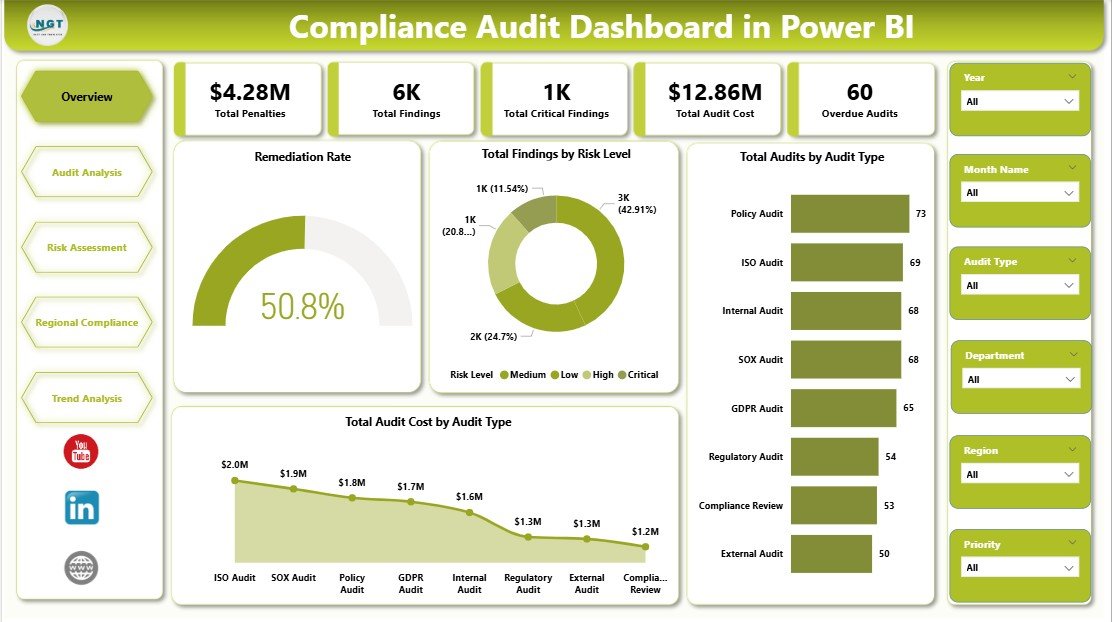
Compliance Audits Dashboard in Power BI
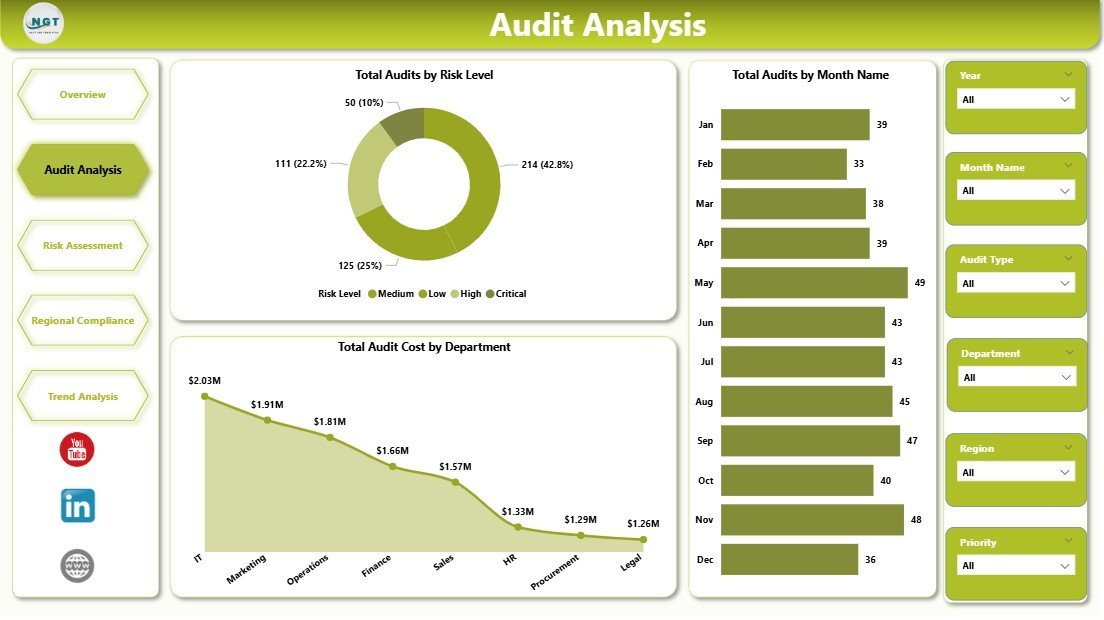
The Audit Analysis page compares Total Audits by Risk Level, Total Audits by Month Name, and Total Audit Cost by Department. It is useful for audit managers who need to understand whether audit load is concentrated in specific periods, business functions, or risk categories.

Audit Analysis
The Risk Assessment page focuses on Total Audit Cost by Risk Level, Total Findings by Region, and Total Audits by Priority. Risk officers can use this page to spot where critical or high-priority audits are creating the most cost and exposure.
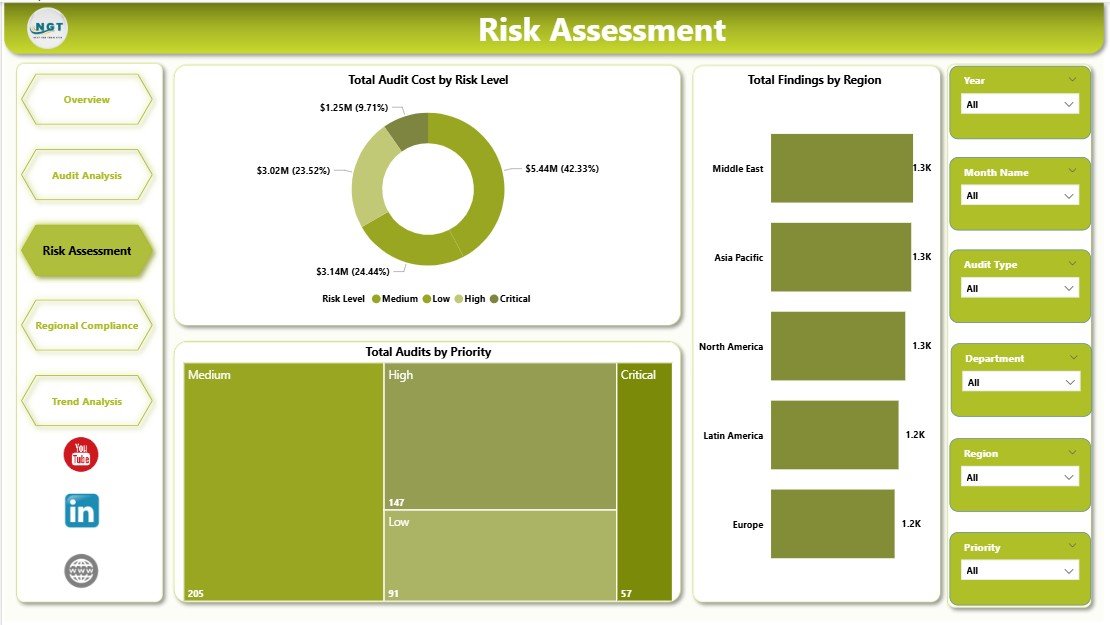
Risk Assessment
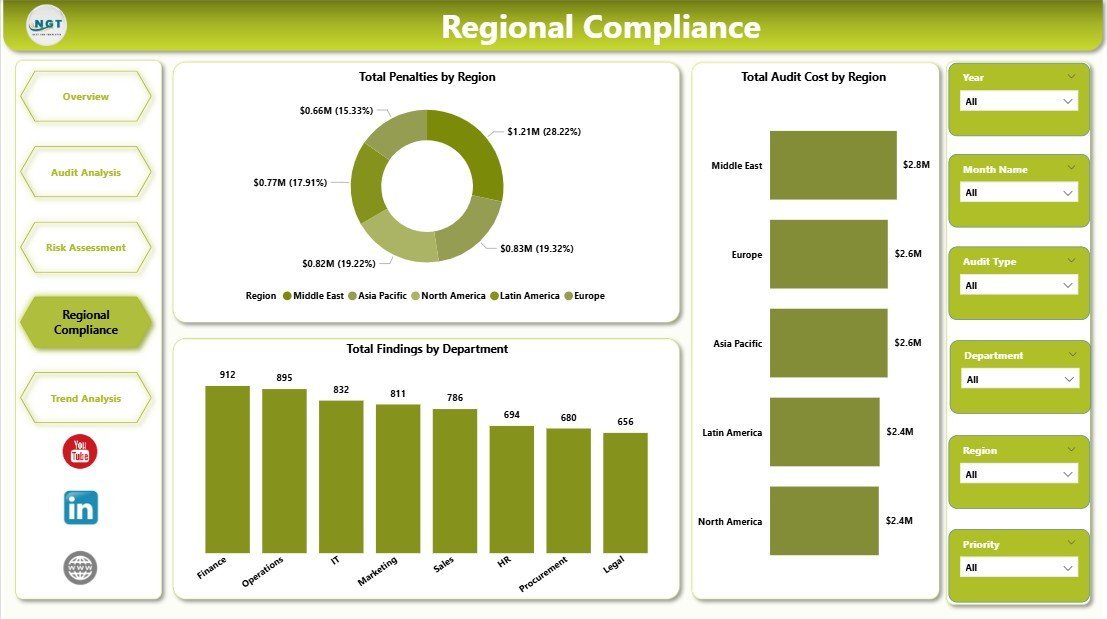
The Regional Compliance page shows Total Penalties by Region, Total Audit Cost by Region, and Total Findings by Department. This is the page for multi-location teams that need to compare compliance performance across offices, geographies, or legal entities.
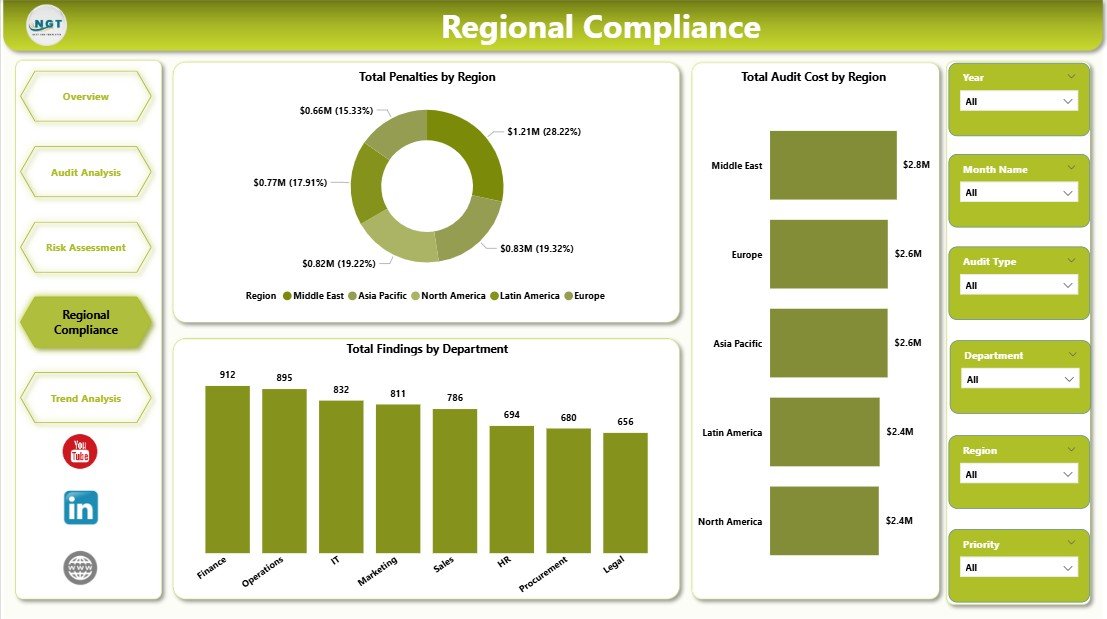
Regional Compliance
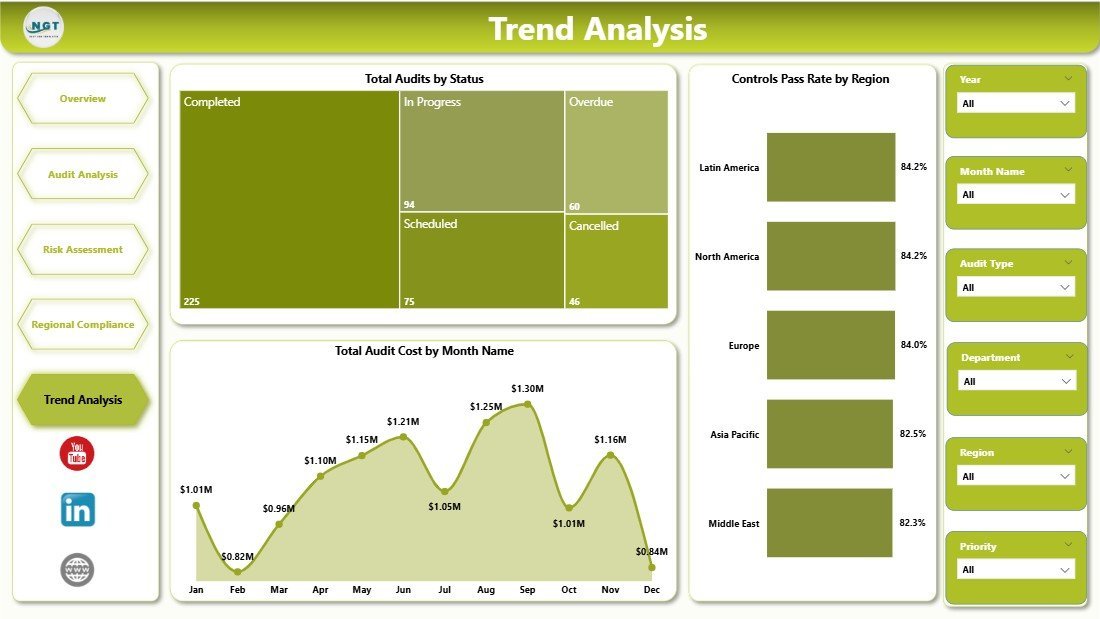
The Trend Analysis page tracks Total Audits by Status, Controls Pass Rate by Region, and Total Audit Cost by Month Name. It helps audit committees understand whether audits are closing on time, controls are improving, and monthly cost is moving in the right direction.

Trend Analysis
Compliance Audits Dashboard in Power BI vs. Tableau vs. Paid GRC SaaS – Where This Fits
| Feature | Compliance Audits Dashboard in Power BI | Tableau or Qlik Build | Paid GRC SaaS |
|---|---|---|---|
| Cost | $17.99 one-time | $70+ per user per month | Often $30,000+ per year |
| Platform | Power BI Desktop | Tableau or Qlik | Vendor cloud platform |
| Setup time | Under 15 minutes with clean data | Hours or days to build | Weeks or months of onboarding |
| Audit visuals | 15 pre-built visuals | Custom build required | Built in, but vendor-controlled |
| Customizable fields | Editable in Power BI | Editable with BI skills | Limited by plan and configuration |
| Year-1 cost at 5 users | $17.99 total | About $4,200+ before build time | Often $30,000 to $250,000+ |
Who This Template Is For – and Who It’s Not For
This template is for compliance managers, internal audit teams, risk officers, SOX program leads, GRC analysts, and consultants who already export audit data to Excel, CSV, SharePoint, or a GRC system and want a clean Power BI reporting layer.
It is not a replacement for workflow-heavy GRC software. If you need evidence collection, automated control testing, approvals, SSO, audit trails, or live ServiceNow/SAP integration, a full GRC platform may be the better fit.
How to Use the Compliance Audits Dashboard in Power BI
- Download and unzip the file after purchase.
- Open the .pbix file in free Power BI Desktop.
- Replace the sample audit table with your own data source.
- Refresh the report so all cards, visuals, and slicers update.
- Customize fields, colors, and pages if your audit program needs extra views.
- Publish to Power BI Service or export to PDF for leadership reporting.
Real-World Use Cases
Anita, Head of Internal Audit: uses the Overview and Trend Analysis pages before every audit committee meeting to explain overdue audits, critical findings, and monthly cost in a single view.
Marco, SOX Program Manager: filters by audit type and department to identify where total findings and audit cost are rising before external auditors arrive.
Priya, GRC Consultant: creates a separate copy for each client engagement and uses Regional Compliance to compare penalties, findings, and control pass rates by location.
Frequently Asked Questions
Do I need Power BI Pro?
No. You can open and edit the template in Power BI Desktop, which is free. Power BI Pro is only needed if you want to publish and share the dashboard through Power BI Service.
What KPIs are included?
The dashboard includes Total Penalties, Total Findings, Total Critical Findings, Total Audit Cost, and Overdue Audits, plus supporting visuals for risk, region, department, audit type, status, and trends.
Can I customize the report?
Yes. The .pbix file is editable. You can update data connections, rename fields, change visuals, add pages, and adjust the report theme in Power BI Desktop.
What data do I need?
You need audit-level records with fields such as audit date, audit type, department, region, risk level, priority, status, findings, penalties, audit cost, and control pass rate.
Is this suitable for SOX, ISO, HIPAA, GDPR, or internal audits?
Yes. The visuals are framework-neutral, so you can use the dashboard for SOX, ISO, HIPAA, GDPR, PCI, internal control, operational, IT, or regulatory audit reporting.
Does it connect live to my GRC system?
The template is a Power BI Desktop file. You can connect it to supported Power BI data sources, but direct live integration depends on your GRC system and available connectors.
About the Author
Built by PK – Microsoft Certified Professional with 15+ years of Excel, Google Sheets, and Power BI experience. Founder of NextGenTemplates, reaching 300K+ subscribers across YouTube channels. Every template is hand-built and tested before release.
Explore Related Templates
Explore more Power BI Dashboard Templates, including Compliance and Audit Dashboard in Power BI, Corporate Governance Dashboard in Power BI, and Security Company Dashboard in Power BI.
Download the Compliance Audits Dashboard in Power BI today and turn audit records into a clear, filterable Power BI report.
Last updated: May 18, 2026


Reviews
There are no reviews yet.