
In today’s competitive digital world, running marketing campaigns is easy—but tracking their performance effectively is the real challenge. 🤔 Businesses invest heavily in ads, content, and campaigns, yet many struggle to understand what’s actually working.
What if you could track your entire marketing funnel—from leads to conversions and revenue—in one powerful dashboard? 🚀
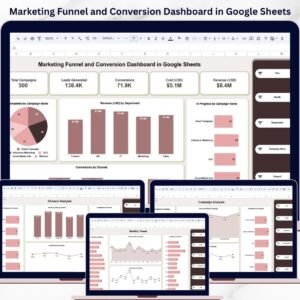
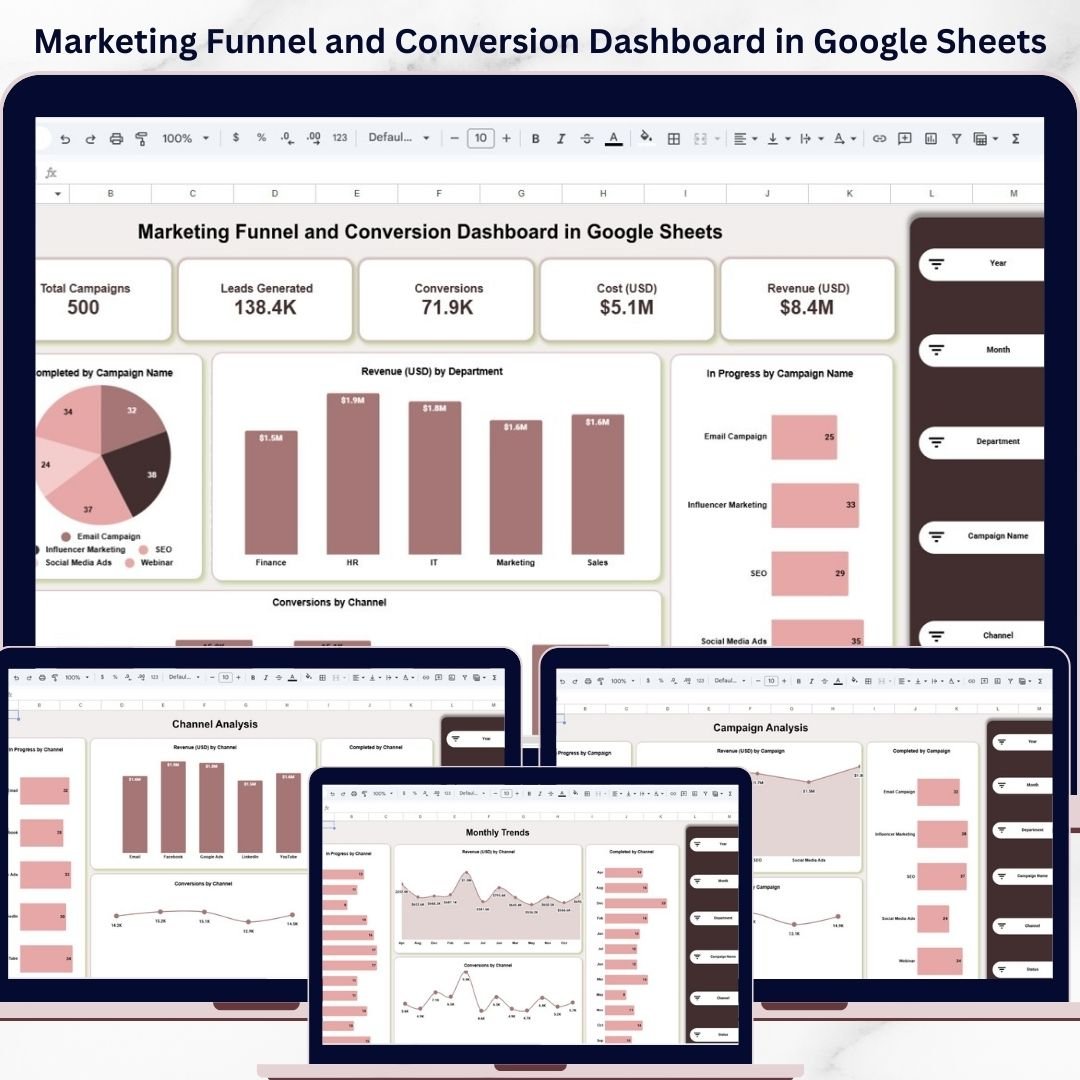
Introducing the Marketing Funnel and Conversion Dashboard in Google Sheets — a smart, interactive, and ready-to-use solution designed to help you monitor campaigns, analyze conversions, and maximize ROI effortlessly.
This dashboard eliminates the confusion of scattered spreadsheets and disconnected reports. Instead, it gives you a centralized platform where all your marketing data is organized, visualized, and updated in real time.
Whether you are managing multiple campaigns or analyzing channel performance, this dashboard helps you make faster, data-driven decisions.
💡 Key Features of Marketing Funnel and Conversion Dashboard in Google Sheets
📊 All-in-One Marketing Dashboard – Track campaigns, leads, conversions, and revenue in one place.
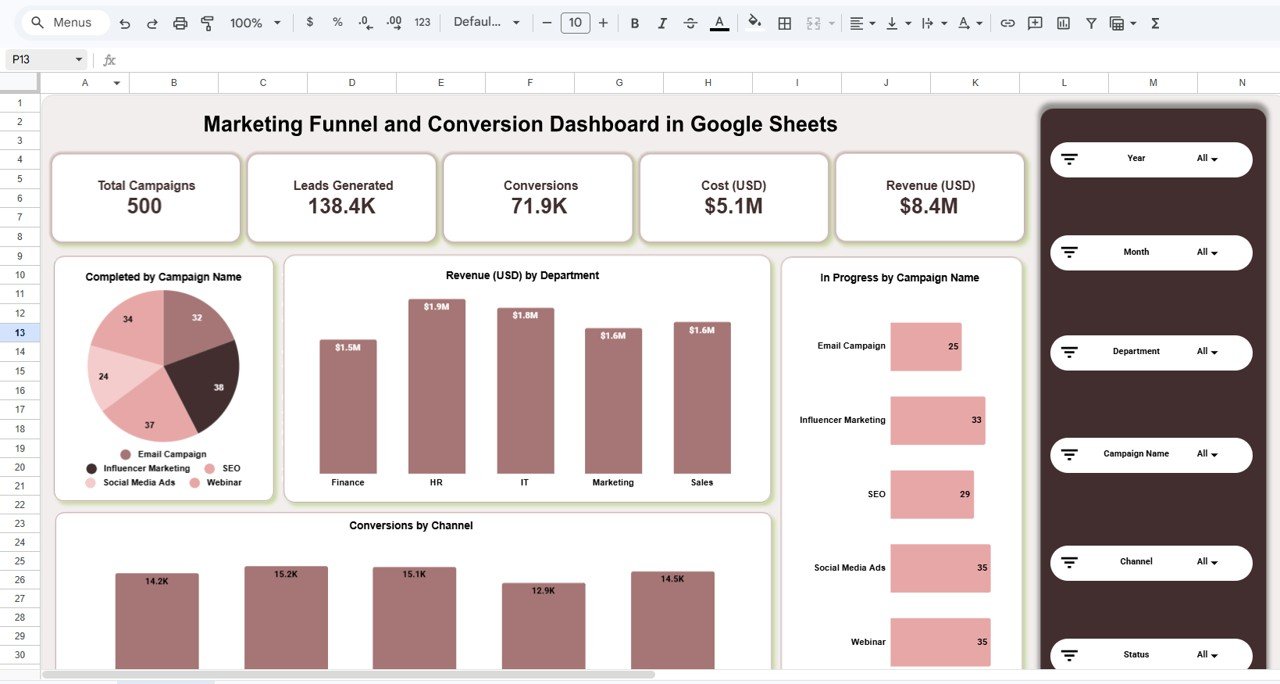
📅 Dynamic Filters & Slicers – Analyze data by year, month, department, campaign, and channel.
📈 Funnel Performance Tracking – Monitor every stage from lead generation to conversion.
💰 Revenue & Cost Analysis – Measure campaign profitability and ROI effectively.
📊 Channel Performance Insights – Identify top-performing marketing channels.
📉 Campaign Progress Tracking – Monitor campaign completion and performance status.
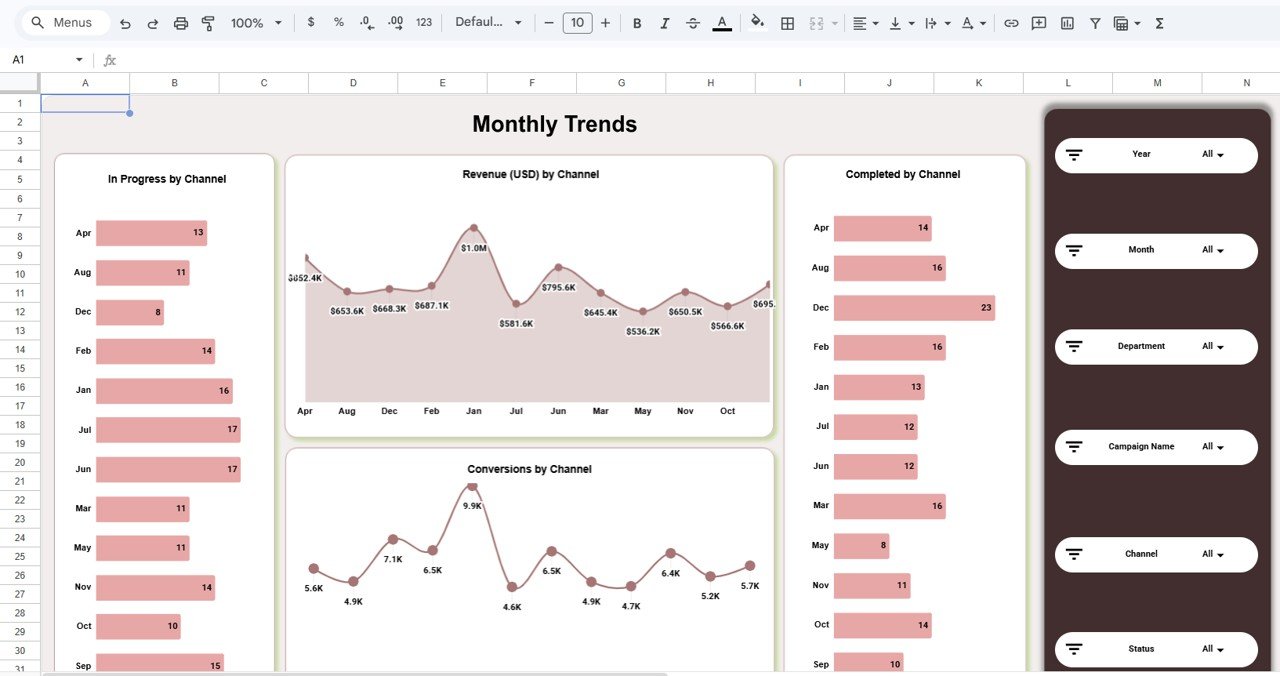
📈 Monthly Trend Analysis – Track revenue and conversion trends over time.
🧾 Automated Calculations – All KPIs update automatically with data changes.
🌐 Real-Time Collaboration – Work with your team seamlessly in Google Sheets.
📦 What’s Inside the Marketing Funnel and Conversion Dashboard in Google Sheets
This powerful template includes multiple sheets designed for deep marketing insights:
📌 Overview Dashboard
A complete snapshot of campaigns, leads, conversions, cost, and revenue with dynamic filters.
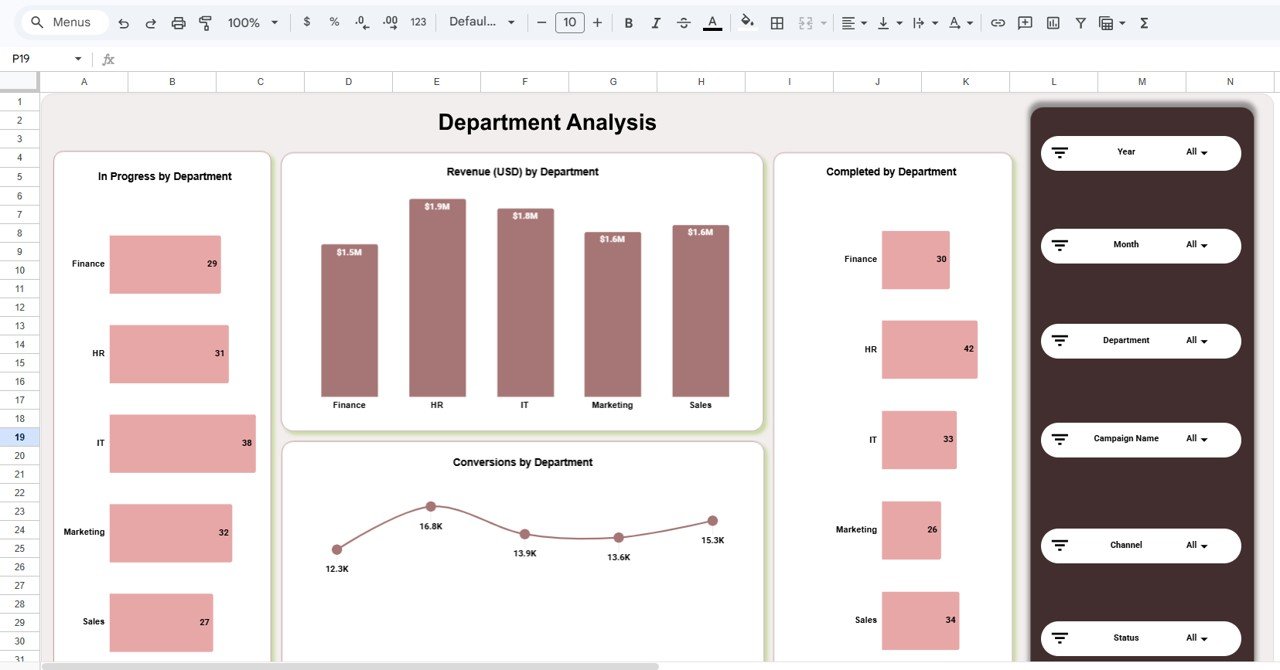
📌 Department Analysis Page
Analyze revenue, conversions, and campaign performance by department.
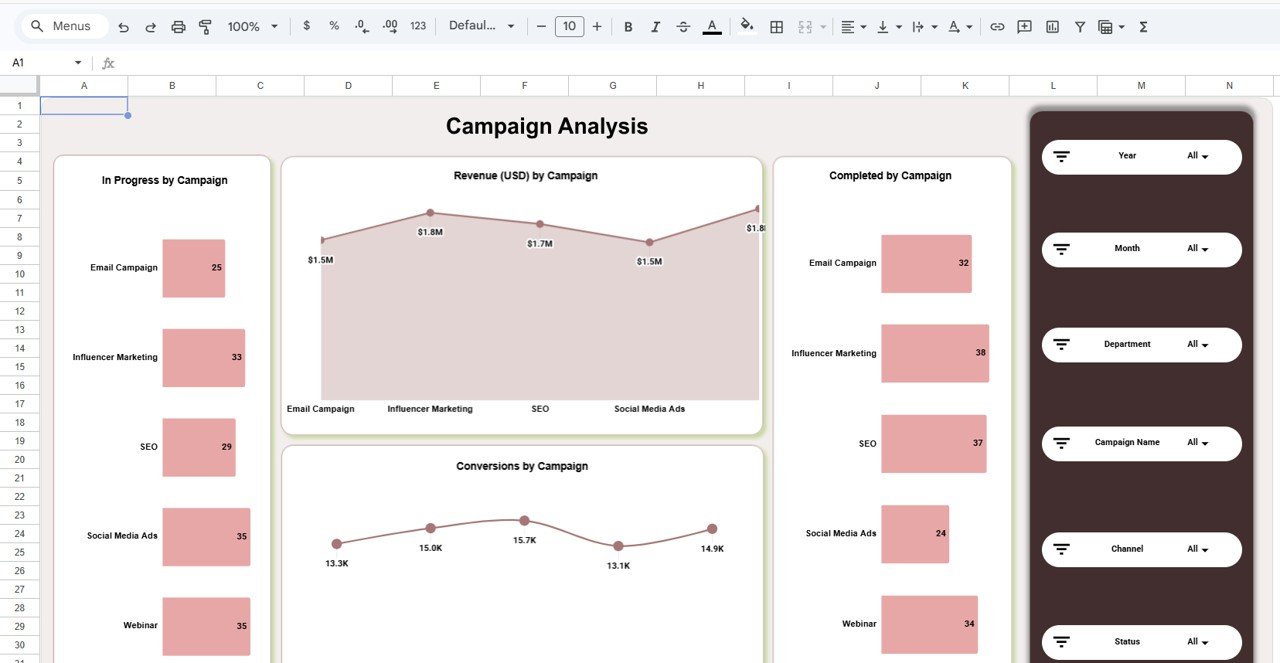
📌 Campaign Analysis Page
Evaluate individual campaign performance and optimize strategies.
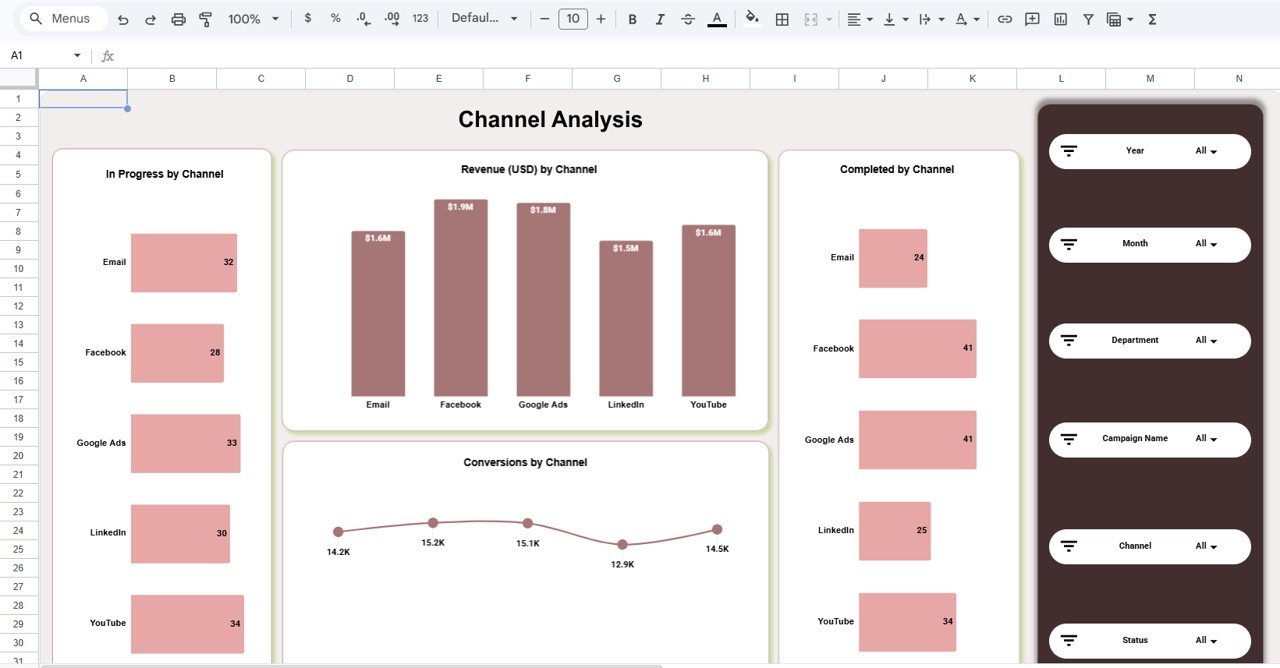
📌 Channel Analysis Page
Track performance across channels like Email, Google Ads, Facebook, LinkedIn, and YouTube.
📌 Monthly Trends Page
Monitor revenue and conversion trends over time.
Each sheet works together to provide a complete marketing analytics ecosystem.
⚙️ How to Use the Marketing Funnel and Conversion Dashboard in Google Sheets
You can start using this dashboard in just a few simple steps:
👉 Step 1: Enter Campaign Data
Input campaign details, leads, conversions, cost, and revenue in the data sheet.
👉 Step 2: Apply Filters
Use slicers to filter data by time, channel, department, or campaign.
👉 Step 3: Analyze Funnel Performance
Track how leads move through the funnel and convert into revenue.
👉 Step 4: Evaluate Channels & Campaigns
Identify which channels and campaigns deliver the best results.
👉 Step 5: Monitor Trends
Use the Monthly Trends page to analyze performance over time.
Within minutes, you’ll gain complete visibility into your marketing performance.
👥 Who Can Benefit from This Marketing Funnel and Conversion Dashboard in Google Sheets
📊 Marketing Teams – Track campaign performance and optimize strategies.
📢 Digital Marketing Agencies – Manage multiple client campaigns efficiently.
💼 Business Owners – Monitor ROI and improve profitability.
📈 Sales Teams – Understand lead conversion patterns.
🚀 Startups – Scale marketing efforts with data-driven insights.
If you want to improve campaign performance, optimize marketing spend, and increase conversions—this dashboard is your ultimate tool.
This is not just a dashboard—it’s your marketing command center. It helps you uncover hidden insights, improve strategies, and maximize ROI.
💥 Stop guessing your marketing results.
💥 Start tracking them with clarity and confidence.
📖 Click here to read the Detailed blog post
Watch the step-by-step video tutorial:
🎥 Visit our YouTube channel to learn step-by-step video tutorials
👉 https://www.youtube.com/@PKAnExcelExpert
Compatibility and Requirements
- Works in Google Sheets. You need a free Google account and a web browser.
- You filter the dashboard by year, month, department, campaign and channel. Google explains how charts work in Add and edit a chart or graph.
Frequently Asked Questions
Which pages are included?
Five pages: Overview Dashboard, Department Analysis, Campaign Analysis, Channel Analysis and Monthly Trends.
What can I track with this dashboard?
You can track campaigns, leads, conversions, cost and revenue, and see how leads move through the funnel to conversion.
Can I compare marketing channels?
Yes. The Channel Analysis page shows performance for channels such as Email, Google Ads, Facebook, LinkedIn and YouTube.
Do the KPIs update on their own?
Yes. The calculations update automatically when you change the data you entered.
Is there an Excel or Power BI version?
See the Marketing Dashboard in Excel and the Marketing Dashboard in Power BI.
Related Marketing Templates
- Marketing Dashboard in Google Sheets: a wider view of your marketing results
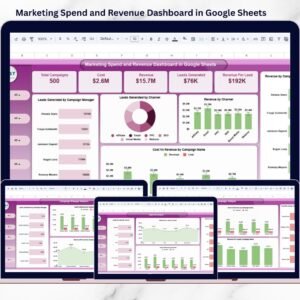
- Marketing Spend and Revenue Dashboard in Google Sheets: compare spend with revenue
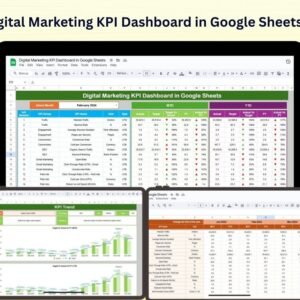
- Digital Marketing KPI Dashboard in Google Sheets: digital marketing KPIs in one place
- Sales Funnel Dashboard in Excel: the funnel view in Excel
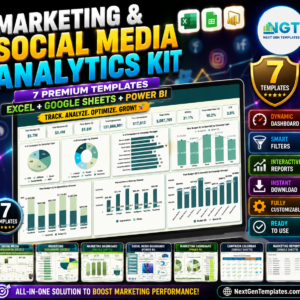
- Marketing and Social Media Analytics Kit: 7 marketing templates in one download
Browse all Google Sheets dashboards.