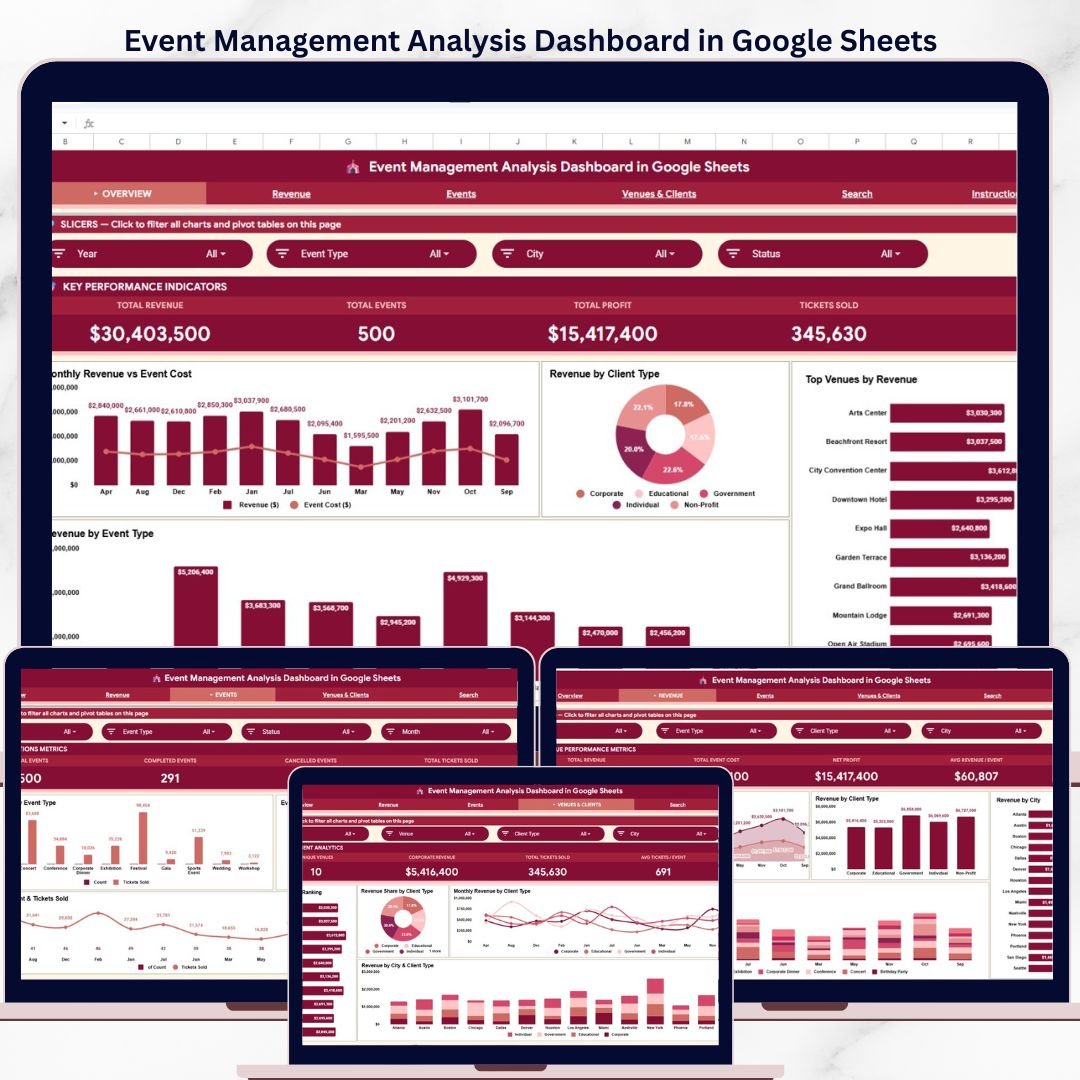


Event coordinators lose an average of 40% of post-event revenue insights due to scattered spreadsheets and manual tallying. The Event Management Analysis Dashboard in Google Sheets centralizes revenue, ticket sales, venue performance, and client analytics across 6 dedicated pages — so your team gets answers in seconds, not hours. Trusted by 8,400+ teams worldwide across corporate, hospitality, nonprofit, and education sectors.
✅ Instant download · One-time payment · No subscription · No per-user fees · Lifetime access
🔑 Key Features of the Event Management Analysis Dashboard in Google Sheets
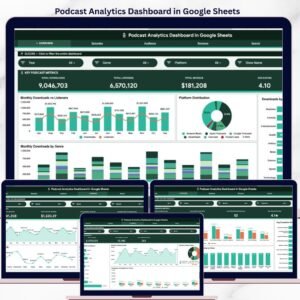
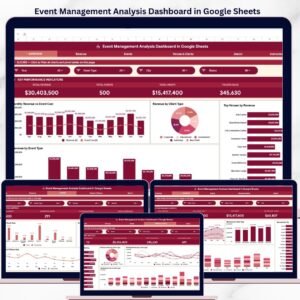
🔹 4 KPI Summary Cards — Total Revenue, Total Events, Total Profit, and Tickets Sold on the Overview page for an instant performance snapshot. This dashboard tracks these 4 KPIs alongside 14 charts across all analytical pages.
🔹 6 Dedicated Pages — Overview, Revenue, Events, Venues & Clients, Search Sheet, and Data Sheet covering every dimension of your event portfolio.
🔹 Interactive Slicers — Apply filters to instantly segment the dashboard by event type, client type, city, venue, or month without editing any formulas.
🔹 Revenue Breakdown by 4 Dimensions — Monthly trend, Client Type, City, and Event Type give you complete revenue visibility from every angle.
🔹 Tickets Sold vs Capacity Analysis — Identify which event types are filling seats versus underperforming to intelligently reallocate budget and promotion spend.
🔹 Venue Revenue Ranking — Surface your highest-earning locations to guide future event placement and venue negotiation.
🔹 Event ID Quick Lookup — Select any Event ID from the Search Sheet dropdown to instantly surface all fields: Date, Event Type, Name, Venue, City, Client Type, and Revenue.
🔹 Google Sheets Native — No add-ins, no Power BI license, no macros. Works in any browser on any device with a free Google account.
📦 What’s Inside the Event Management Analysis Dashboard in Google Sheets
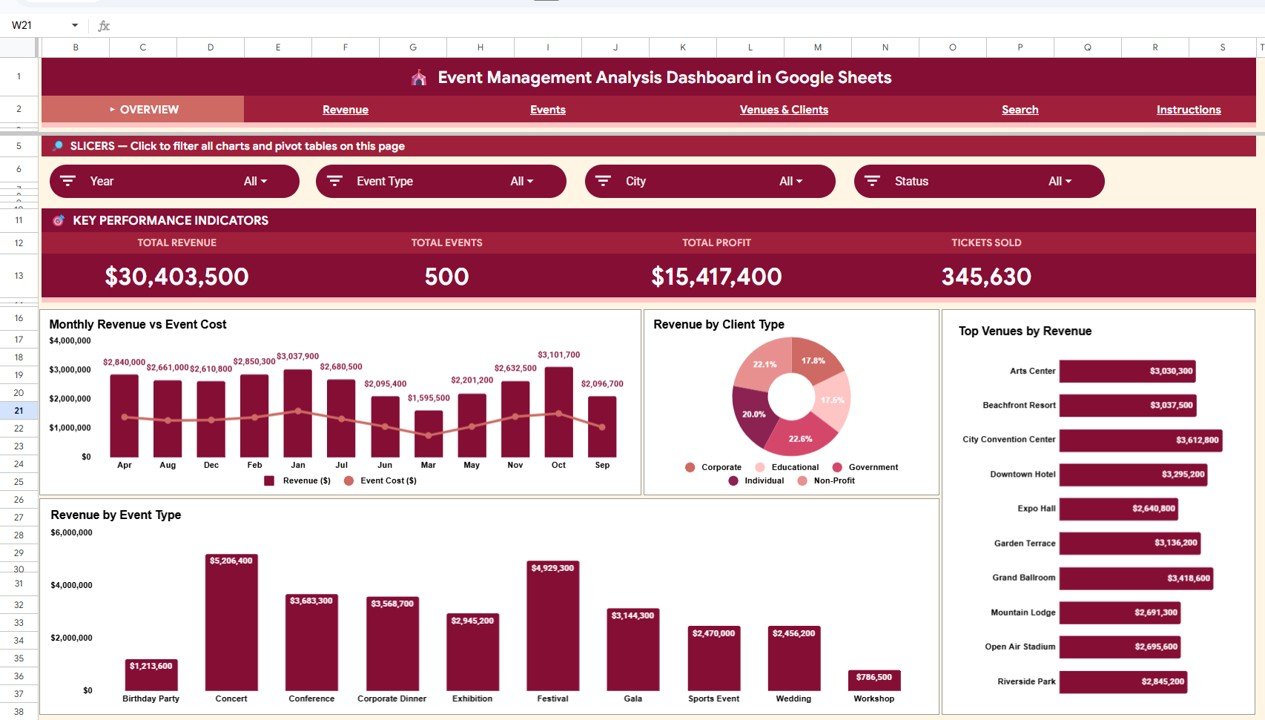
1 — Overview Page
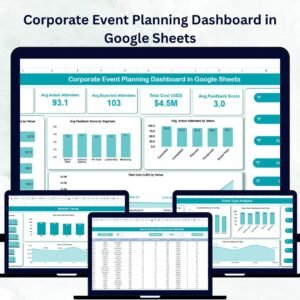
High-level summary featuring 4 KPI cards (Total Revenue, Total Events, Total Profit, Tickets Sold) plus 4 charts: Monthly Revenue vs Event Cost by Month; Revenue by Client Type; Top Venues by Revenue; Revenue by Event Type. Multiple slicers let you filter the entire overview instantly.
Event Management Analysis Dashboard in Google Sheets
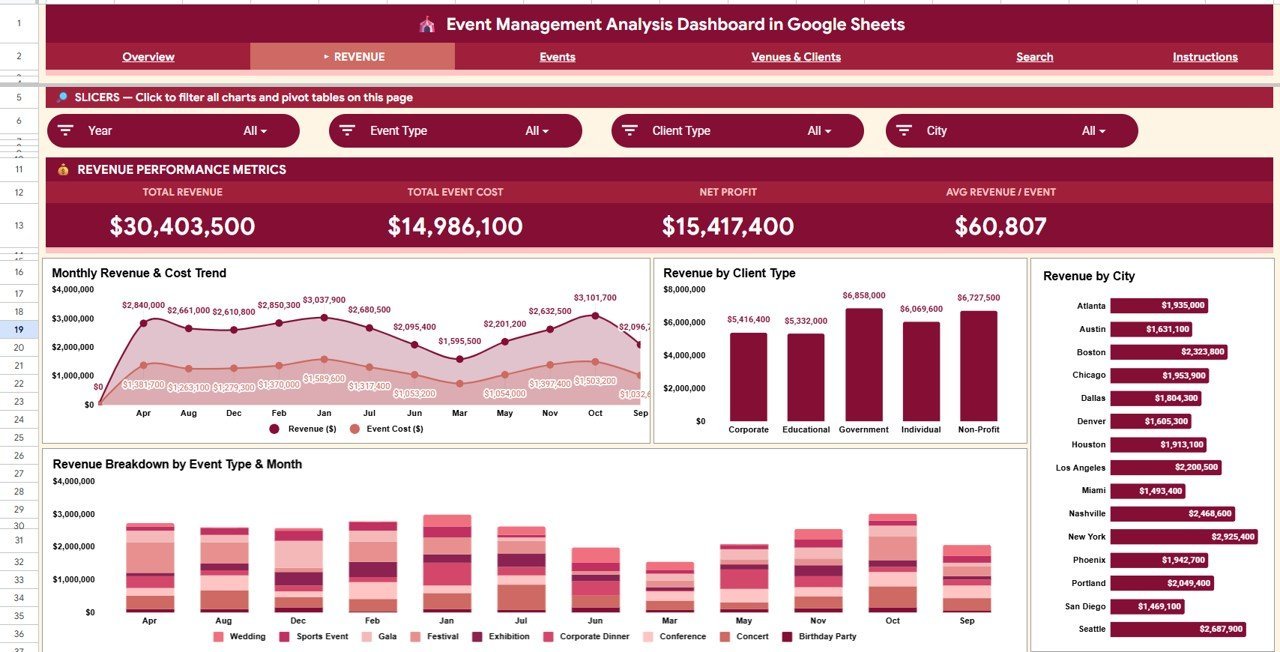
2 — Revenue Page
Four revenue charts: Monthly Revenue & Cost Trend by Month; Revenue by Client Type; Revenue by City; Revenue Breakdown by Event Type & Month.

Revenue Analysis Tab
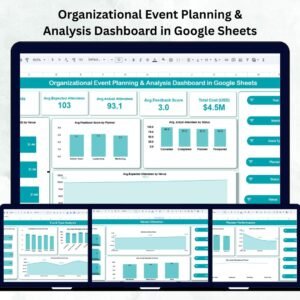
3 — Events Page
Four event charts: Events & Tickets by Event Type; Event Status Distribution; Tickets Sold vs Capacity by Type; Monthly Event Count & Tickets Sold.
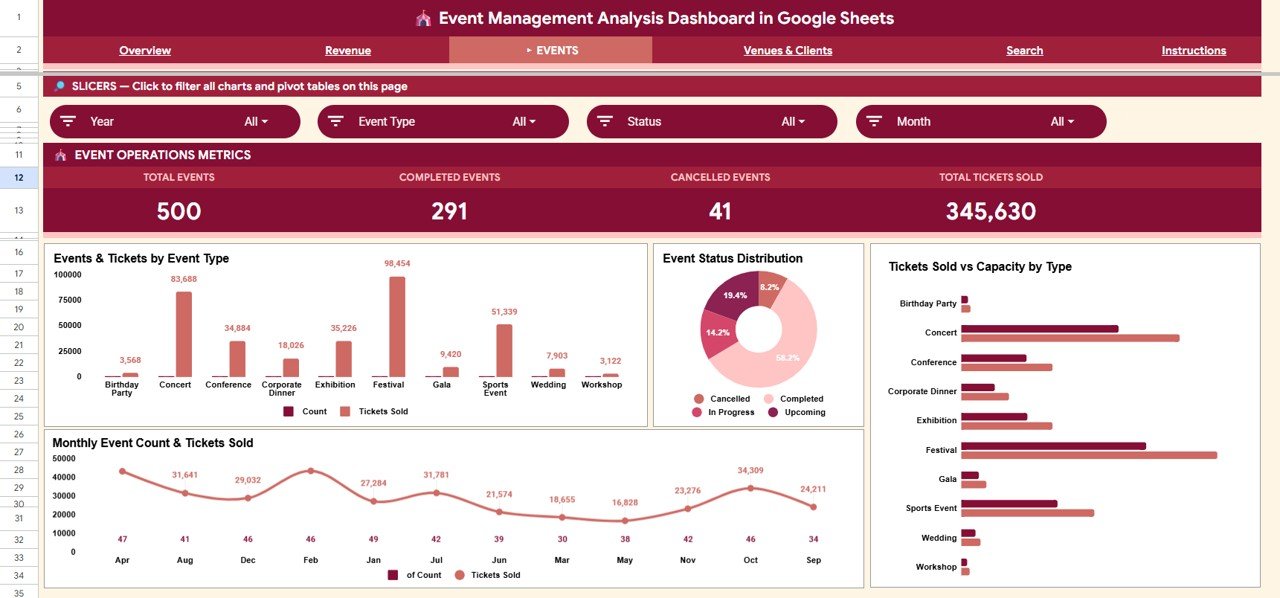
Events Analysis Tab
4 — Venues & Clients Page
Four charts: Venue Revenue Ranking; Revenue Share by Client Type; Monthly Revenue by Client Type; Revenue by City & Client Type.
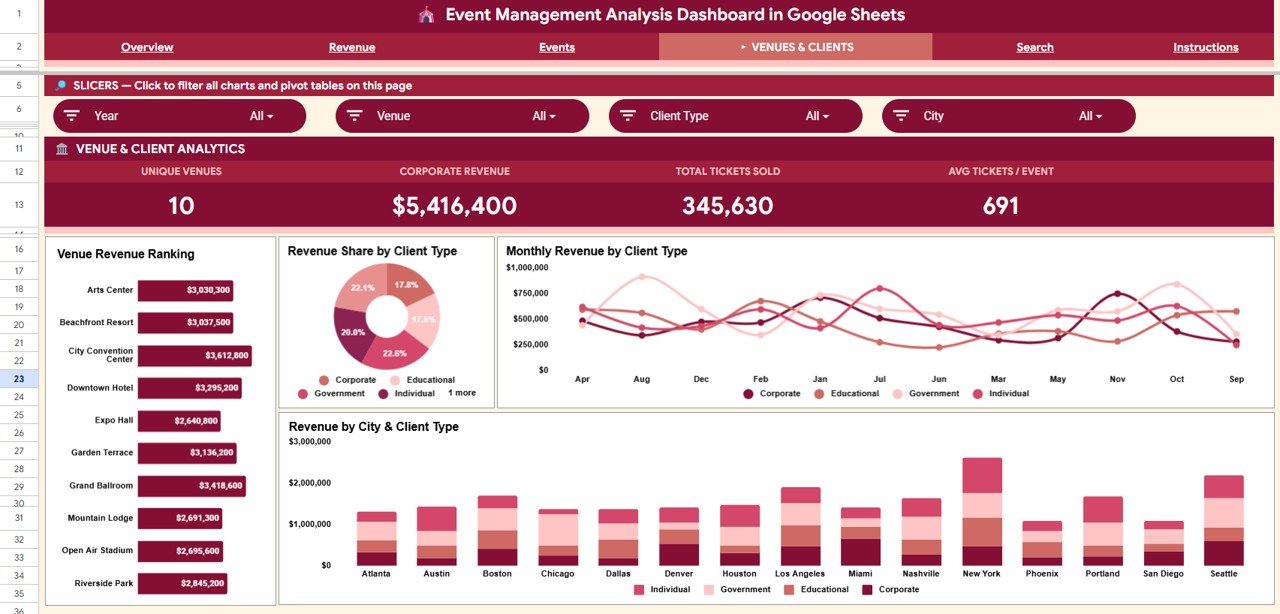
Venues & Clients Tab
5 — Search Sheet
Select any Event ID from the dropdown to instantly display: Date, Event Type, Event Name, Venue, City, Client Type, and Revenue. Ideal for budget reviews and client reporting.
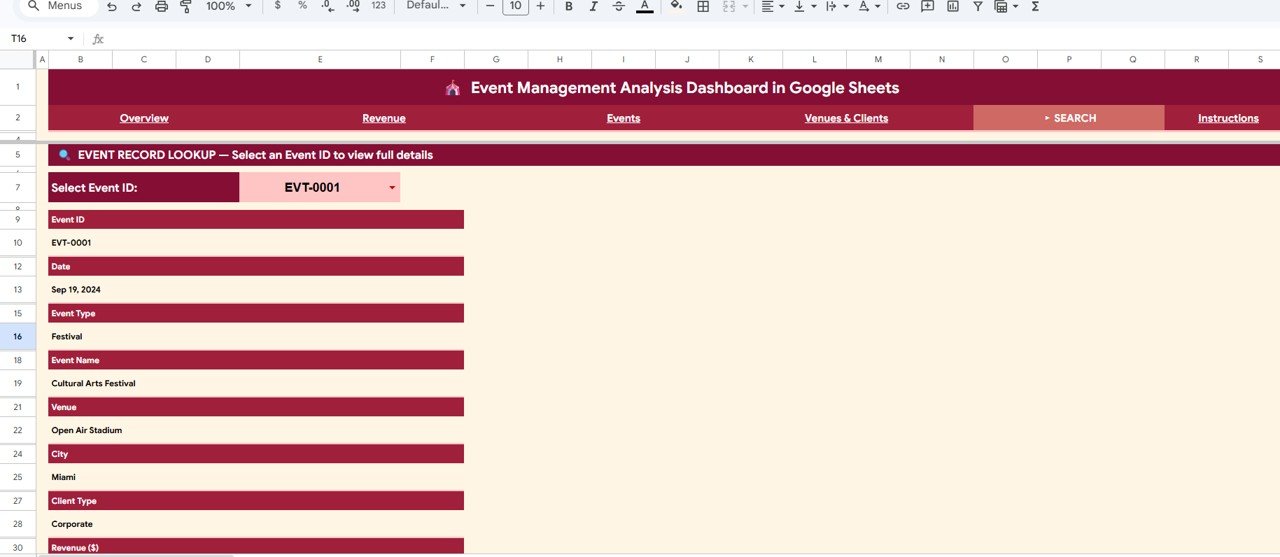
Search Sheet tab
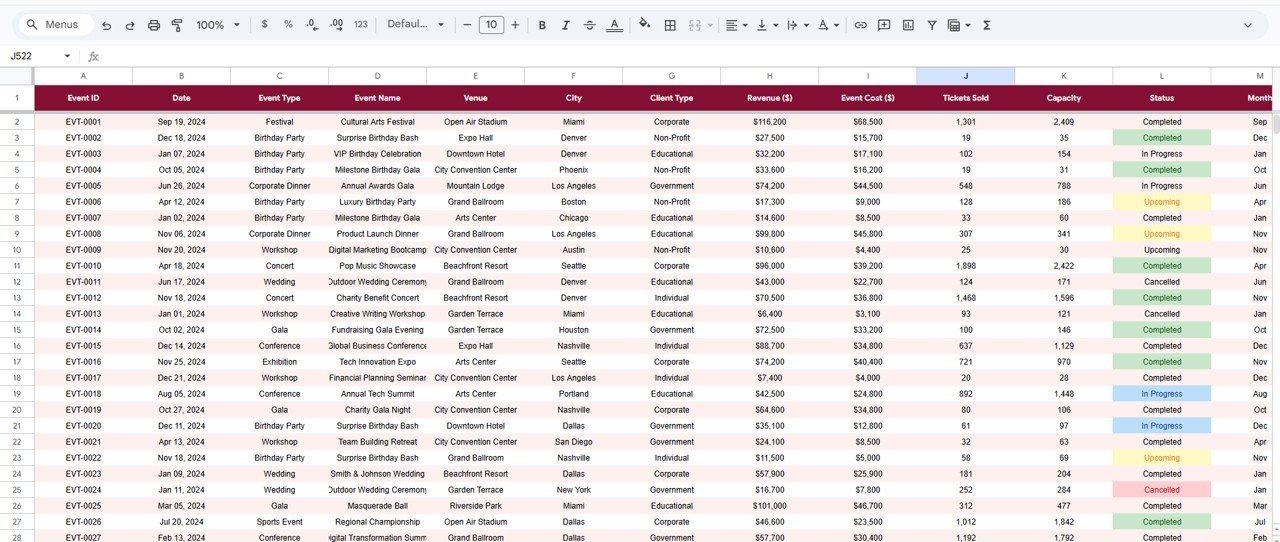
6 — Data Sheet
Structured data entry tab. Add your event records in the same column format to automatically feed every dashboard page and chart.

Data Sheet tab
📊 This Dashboard vs. Excel Dashboard vs. Eventbrite
| Feature | Event Management Analysis Dashboard in Google Sheets | Excel Event Dashboard | Eventbrite / Event SaaS |
|---|---|---|---|
| Cost | $9.99 one-time | $9.99–$17.99 one-time | $9–$29/user/month |
| Platform | Google Sheets (browser) | Desktop Excel required | Web app |
| Setup Time | Under 10 minutes | Under 15 minutes | Hours of configuration |
| Real-time Collaboration | ✅ Built-in | Limited | ✅ Yes |
| Revenue & Profit Tracking | ✅ 4 KPIs + 14 charts | ✅ Similar | ❌ Ticket sales only |
| Venue Analytics | ✅ Ranking + city | Manual setup needed | ❌ Not included |
| Year-1 Cost (5 users) | $9.99 total | $9.99–$17.99 | $540–$1,740/year |
For event teams that need deep revenue and venue analytics without a monthly SaaS subscription, the Event Management Analysis Dashboard in Google Sheets sits in the sweet spot.
👥 Who This Template Is For — and Who It’s Not For
✅ This template is built for:
- Event planners managing 10–200+ events per year across multiple venues and cities
- Marketing managers tracking event ROI and revenue by client type
- Corporate teams presenting event revenue, profit, and ticket performance to leadership
- Hospitality businesses comparing venue performance and capacity utilization
- Freelance event consultants who need professional analytics without SaaS costs
❌ This template is NOT for:
- Teams needing real-time ticketing, payment processing, or attendee registration (use Eventbrite)
- Enterprise teams requiring CRM integration, API data feeds, or SOC 2 compliance
- Users who have never opened a Google Sheet and need guided onboarding
⚙️ How to Use
- Download the PDF guide from your purchase — it contains the Google Sheets copy link
- Click the link to make your own editable copy in Google Drive
- Open the Data Sheet and enter your event records following the column headers
- Navigate to any dashboard page — they auto-update from your data
- Click any slicer to filter by event type, client type, city, or month
- Use the Search Sheet to look up any event by Event ID
💼 Real-World Use Cases
Maria manages marketing for a regional hospitality group running 60+ corporate events annually. She applies the city slicer and generates a revenue-by-venue report for her VP in under 5 minutes — a task that previously took half a day.
James is an independent event consultant who delivers data-backed post-event reports using the dashboard’s revenue vs cost trends and client-type breakdowns. The professional charts helped him close 3 new retainer contracts this year.
A university events department used the Tickets Sold vs Capacity analysis to identify two underperforming event types and reallocate $12,000 in event spend to higher-yield categories for the next academic year.
❓ Frequently Asked Questions
What metrics does this dashboard track?
The Event Management Analysis Dashboard in Google Sheets tracks 4 KPIs (Total Revenue, Total Events, Total Profit, Tickets Sold) and 14 charts spanning revenue trends, event type performance, client segments, venue rankings, and ticket utilization. All charts update automatically when you add data.
Do I need add-ons or a paid Google account?
No. The dashboard runs on native Google Sheets and Google Apps Script. A free Google account is all you need — no add-ons or paid Workspace tier required.
How do slicers work?
Click any slicer value (e.g., “Corporate” under Client Type) and all charts on that page instantly filter to show only matching data. No formula editing needed.
How long does setup take?
Under 10 minutes. Open the PDF, click the copy link, make a copy in Google Drive, and replace the sample data. All KPIs and charts update automatically.
Can I add new event types, venues, or cities?
Yes. Add new rows to the Data Sheet and the dashboard picks them up via dynamic formulas. No manual chart edits required.
How does this compare to Eventbrite?
Eventbrite handles ticketing and registration. This dashboard adds revenue vs cost analysis, venue rankings, and profit tracking for $9.99 one-time with no monthly fee.
Is this suitable for small event businesses?
Yes. Works for any organization managing paid events, from small independent planners to large corporate teams. The Data Sheet supports hundreds of records.
👤 About the Author
Built by PK — Microsoft Certified Professional with 15+ years of Excel, Google Sheets, and Power BI experience. Founder of NextGenTemplates, reaching 300K+ subscribers across YouTube channels (@PK-AnExcelExpert, @NextGenTemplates, @NeoTechNavigators). Every template is hand-built and tested before release.
🔗 Explore Related Templates
- Fundraising Campaign KPI Dashboard in Google Sheets — Track campaigns, donors, and fundraising KPIs
- Event Management Report in Excel — Desktop Excel event reporting for teams not on Google Sheets
- Hospitality & Guest Booking Performance Dashboard in Google Sheets — Venue and booking analytics
📖 Click here to read the Detailed Blog Post
🎥 Visit our YouTube channel for step-by-step video tutorials
👉 YouTube.com/@NextGenTemplates
Watch the step-by-step video tutorial:
📅 Last updated: May 2026


Reviews
There are no reviews yet.