


Office events play a vital role in building employee engagement, improving collaboration, and strengthening organizational culture. However, when attendance tracking, event costs, and feedback data remain scattered across spreadsheets and emails, it becomes difficult to evaluate event effectiveness.Office Event Attendance Dashboard in Google Sheets
That is exactly why the Office Event Attendance Dashboard in Google Sheets becomes an essential analytics and reporting tool.
This ready-to-use dashboard transforms raw event data into clear KPIs, interactive charts, and actionable insights, enabling HR teams, admin teams, and event planners to make data-driven decisions for every office event.Office Event Attendance Dashboard in Google Sheets
❓ What Is an Office Event Attendance Dashboard in Google Sheets?
An Office Event Attendance Dashboard in Google Sheets is a centralized reporting solution that tracks and analyzes office event performance using structured KPIs and visual analytics.Office Event Attendance Dashboard in Google Sheets
Instead of manually reviewing attendance lists and expense sheets, this dashboard provides instant visibility into:
Number of events conducted
Expected vs actual attendance
Event cost distribution
Planner and venue performance
Feedback scores and engagement trends
Month-wise and year-wise performance
Because it is built in Google Sheets, the dashboard is cloud-based, collaborative, and fully customizable—without requiring advanced technical skills or BI tools.
💡 Why Use Google Sheets for Event Attendance Tracking?
Google Sheets offers the flexibility and accessibility that modern teams need:
☁️ Cloud-based access from anywhere
🤝 Real-time collaboration
🔗 Easy integration with Google Forms
💰 No additional software or license cost
🛠️ Simple customization and scalability
This dashboard leverages these advantages while adding structured analytics and executive-ready visuals.
📊 Dashboard Structure & Sheet-Wise Explanation
🔹 Overview Sheet – Executive Summary
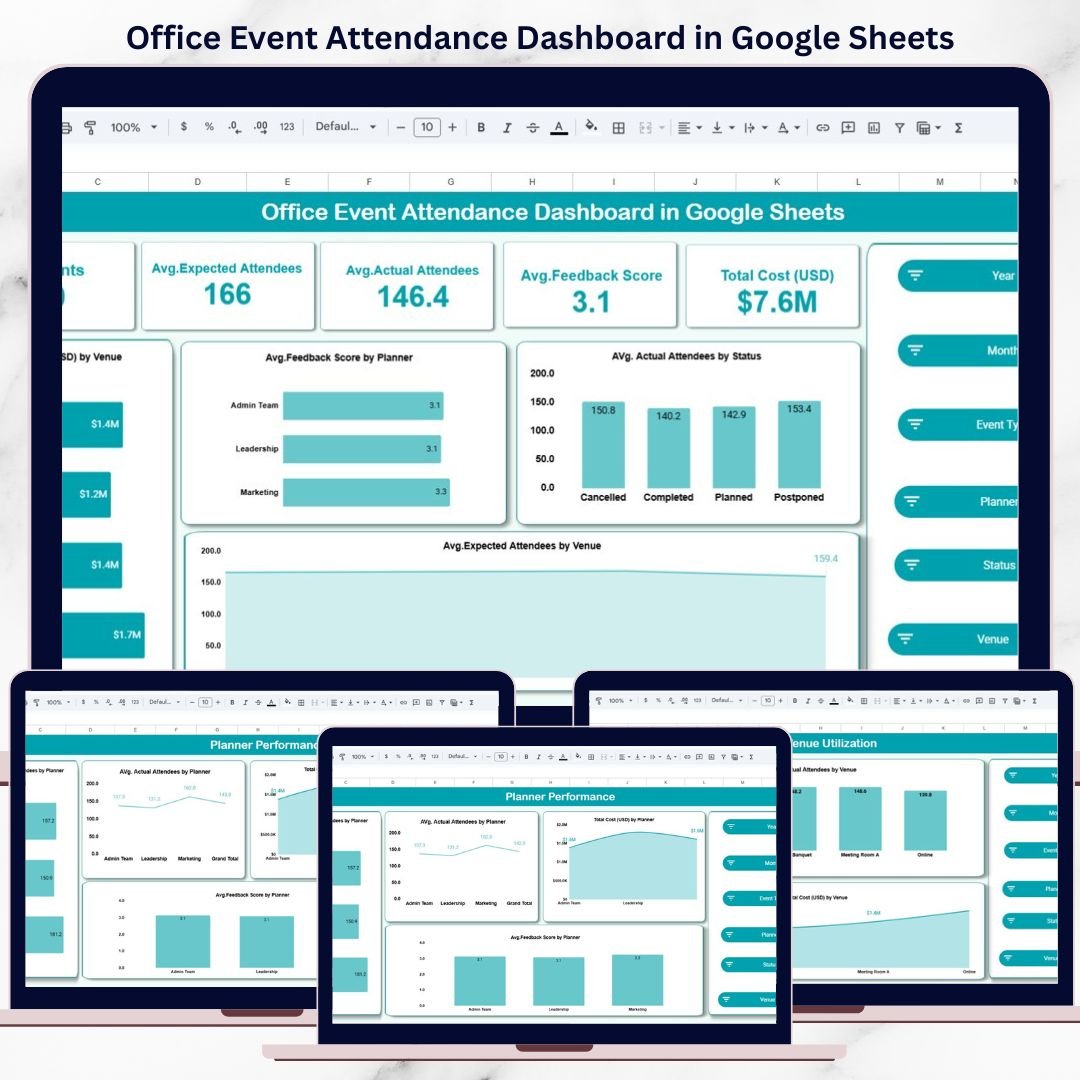
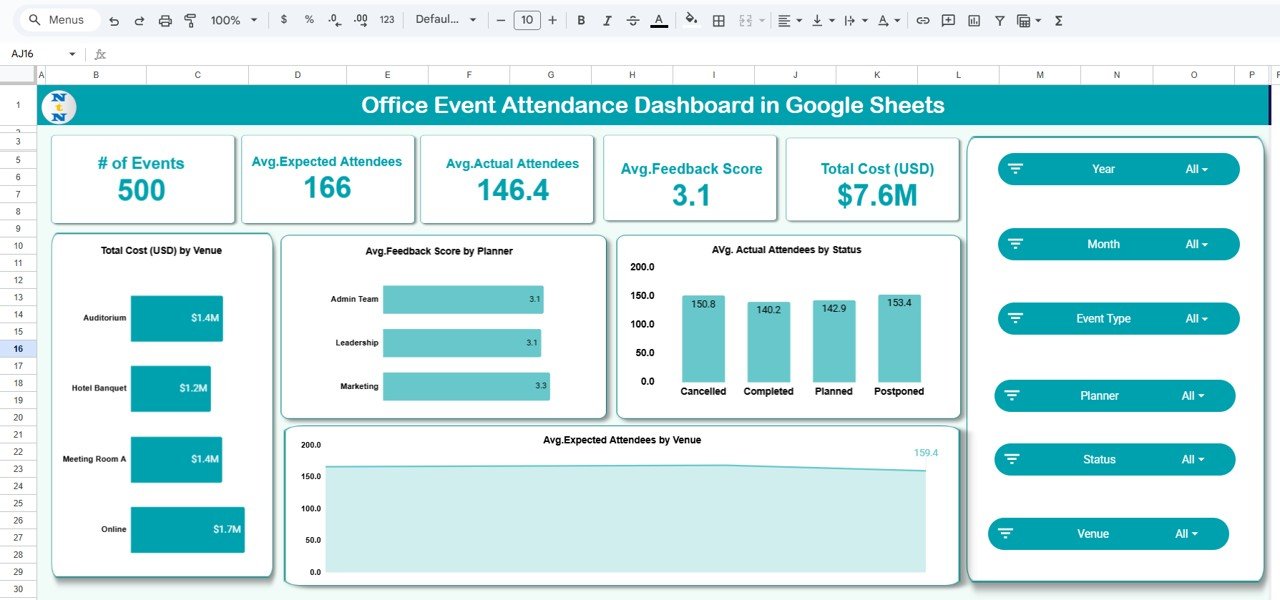
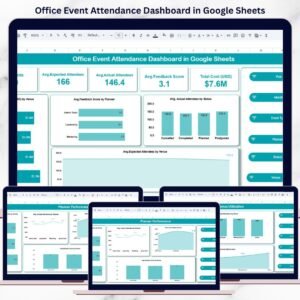
The Overview Sheet provides a high-level snapshot of overall event performance.
KPI Cards
# of Events
Average Expected Attendees
Average Actual Attendees
Average Feedback Score
Total Cost (USD)
These KPIs instantly indicate whether events are meeting expectations.
Overview Charts
Total Cost (USD) by Venue
Average Feedback Score by Planner
Average Actual Attendees by Event Status
Average Expected Attendees by Venue
Interactive Slicers
Year
Month
Event Type
Planner
Status
Venue
This makes the dashboard highly interactive and presentation-ready.
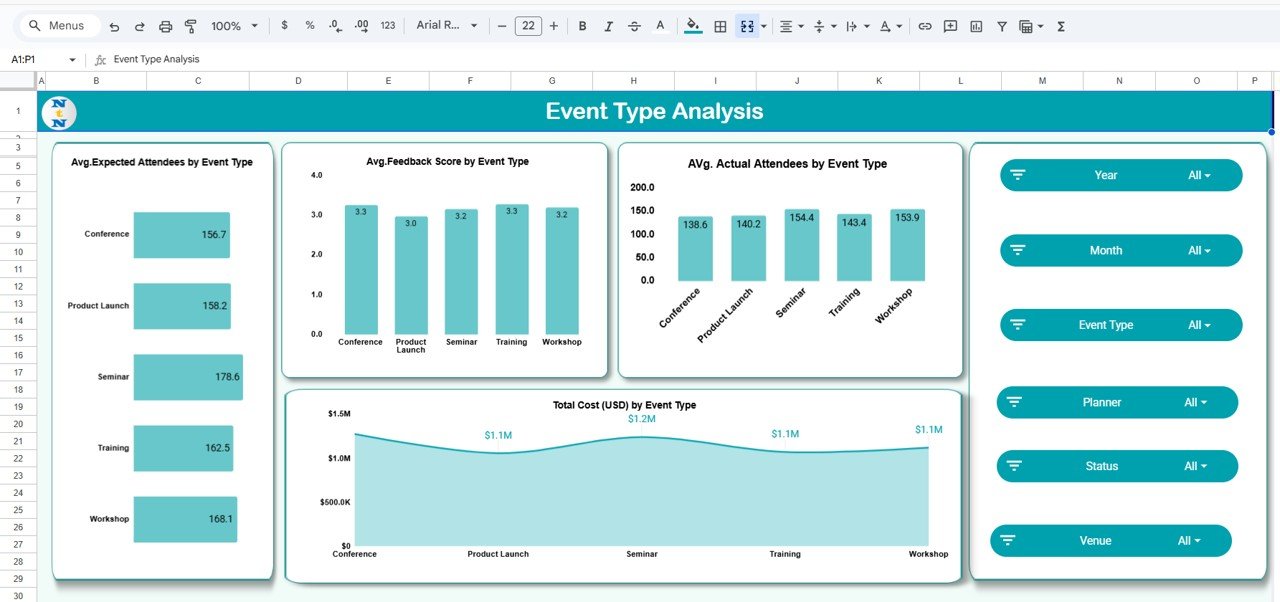
🔹 Event Type Analysis Sheet
This sheet analyzes performance by event category such as:
Conference
Workshop
Seminar
Training
Product Launch
Insights Provided
Average Expected Attendees by Event Type
Average Actual Attendees by Event Type
Average Feedback Score by Event Type
Total Cost (USD) by Event Type
It helps identify which event formats deliver the highest engagement and value.
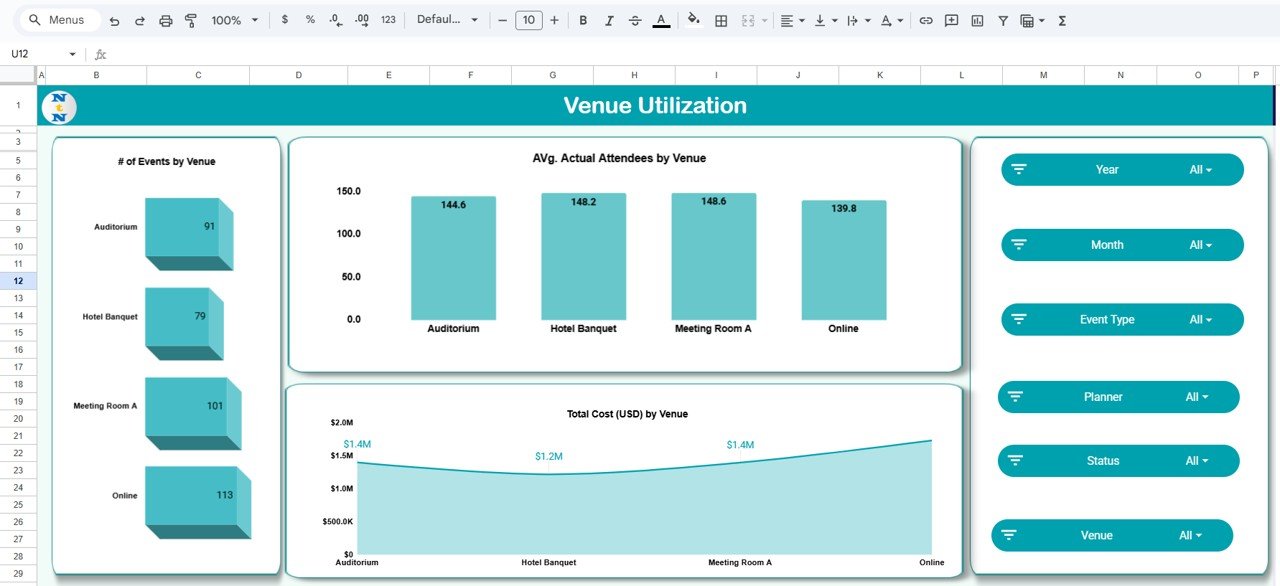
🔹 Venue Utilization Sheet
Venue choice significantly impacts attendance and cost.
Charts Included
Number of Events by Venue
Average Actual Attendees by Venue
Total Cost (USD) by Venue
This analysis helps teams:
Identify under-utilized venues
Compare online vs physical events
Optimize venue selection for future planning
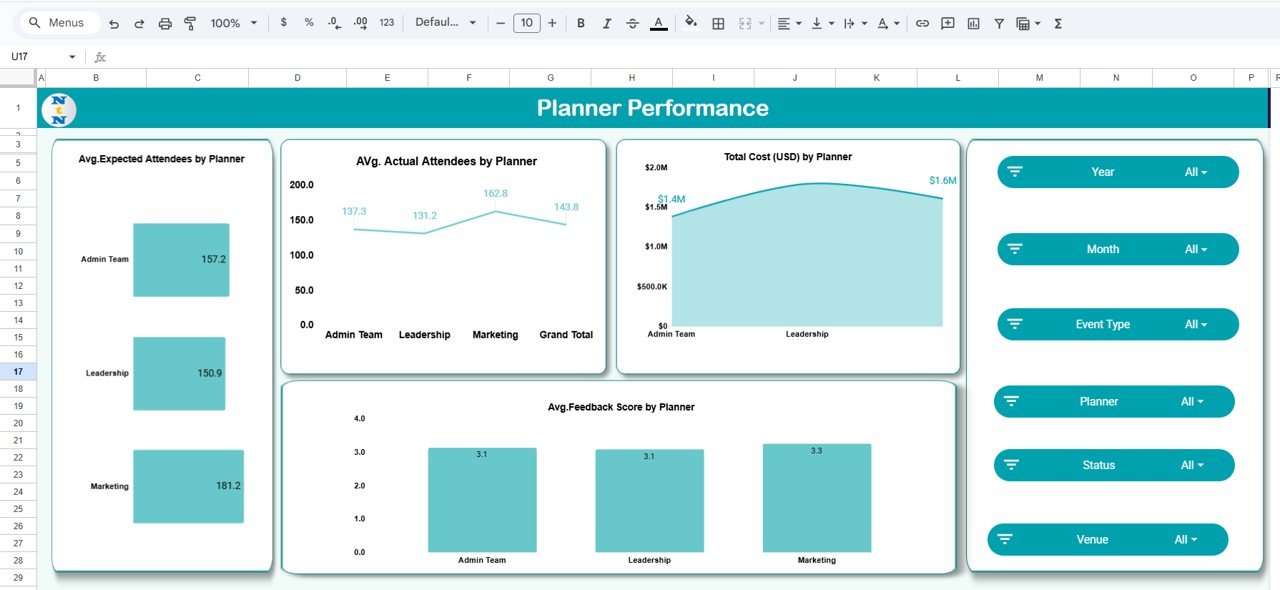
🔹 Planner Performance Sheet
This sheet evaluates event performance by planner or organizing team.
Metrics Tracked
Average Expected Attendees by Planner
Average Actual Attendees by Planner
Average Feedback Score by Planner
Total Cost (USD) by Planner
It supports performance reviews, accountability, and best-practice standardization.
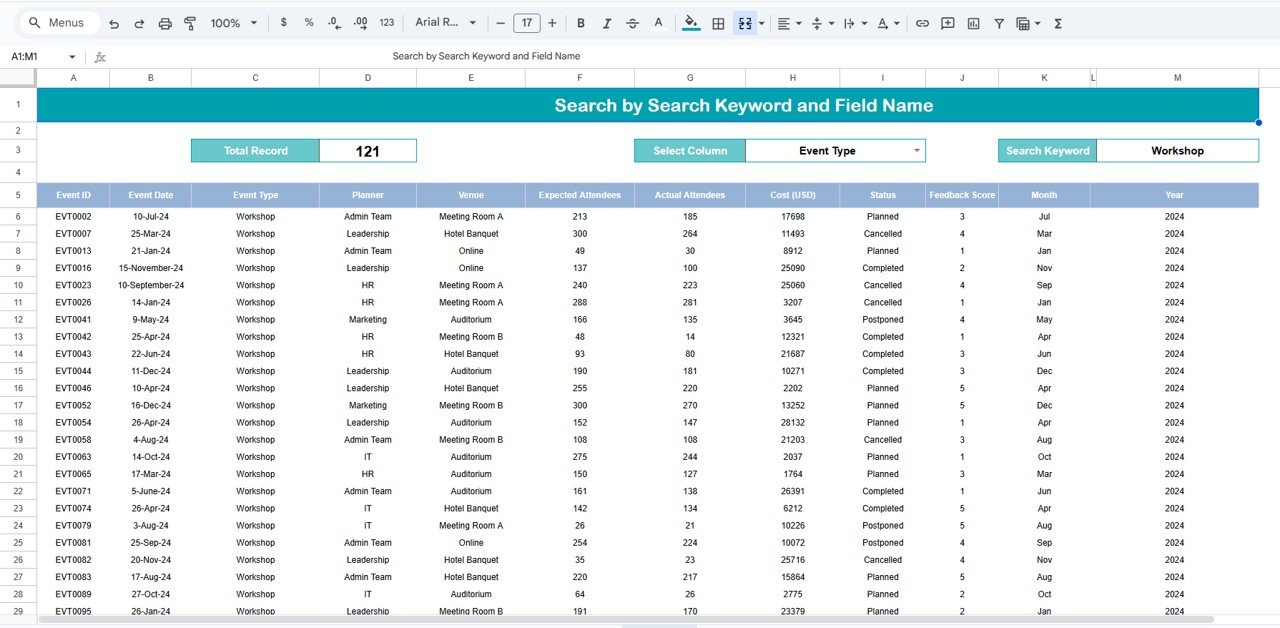
🔹 Search by Keyword and Field Name
A powerful operational feature for quick data access.
How It Works
Select a column (Event Type, Planner, Venue, Status, Month, Year)
Enter a search keyword
Instantly filter and display matching records
This is especially useful for audits, reviews, and management queries.
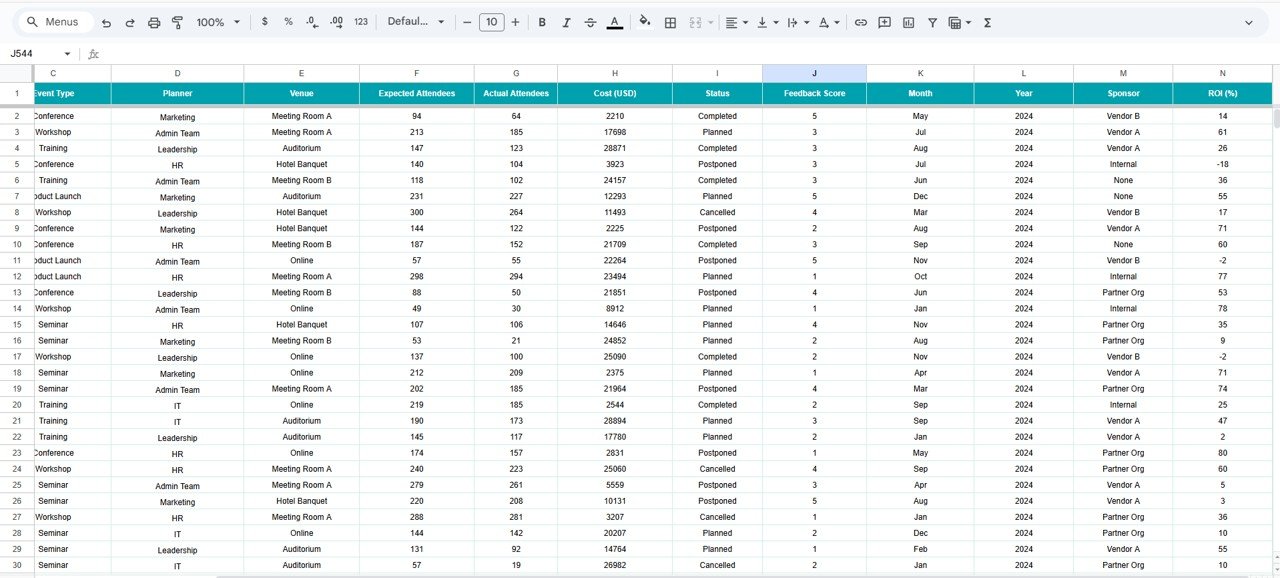
🔹 Data Input Sheet (Backend)
All analysis is driven from a structured, pivot-ready data table.
Typical Columns
Event ID
Event Date
Event Type
Planner
Venue
Expected Attendees
Actual Attendees
Cost (USD)
Status
Feedback Score
Month
Year
Once data is updated, all KPIs and charts refresh automatically.
✅ Key Benefits of the Office Event Attendance Dashboard
📌 Centralized event performance tracking
📈 Monthly & yearly trend analysis
💰 Clear cost visibility by venue, planner, and event type
😊 Feedback-driven engagement evaluation
🔍 Instant search and filtering
☁️ Fully cloud-based and shareable
🧩 Easy to customize for any organization
🚀 Opportunities for Improvement
You can further enhance this dashboard by adding:
ROI or cost-per-attendee metrics
Department-wise or sponsor-wise analysis
Automated data capture using Google Forms
Alerts using Google Apps Script
🧠 Best Practices for Using the Dashboard
Maintain consistent data entry formats
Update event data immediately after completion
Use slicers instead of manual filters
Review trends monthly, not just totals
Share read-only access with leadership
👥 Who Should Use This Dashboard?
HR & Admin Teams
Corporate Event Planners
Training & L&D Teams
Marketing Event Teams
Office & Facility Management Teams
Any organization that conducts internal or external events will benefit from this dashboard.
🏁 Final Thoughts
The Office Event Attendance Dashboard in Google Sheets transforms scattered event data into clear, actionable insights. Instead of relying on assumptions, teams can measure attendance accuracy, control costs, evaluate planners, and continuously improve event outcomes using real data.
Because it is ready-to-use, interactive, and fully customizable, this dashboard saves time, improves transparency, and supports smarter decision-making for every office event.
Click here to Read detailed blog post
Watch the step-by-step video tutorial:
🎥 Visit our YouTube channel for step-by-step tutorials
👉 Youtube.com/@NeotechNavigators
Compatibility and Requirements
- Works in Google Sheets. You need a free Google account and a web browser.
- The dashboard uses slicers for Year, Month, Event Type, Planner, Status and Venue. Google explains charts in Add and edit a chart or graph.
Frequently Asked Questions
Which sheets are included?
The dashboard has an Overview sheet, an Event Type Analysis sheet, a Venue Utilization sheet, a Planner Performance sheet, a Search by Keyword and Field Name sheet and a Data Input sheet.
Which KPIs does the Overview sheet show?
It shows the number of events, average expected attendees, average actual attendees, average feedback score and total cost in USD.
How do I update the dashboard?
Add your events to the Data Input sheet, one row per event. The KPIs and charts refresh from that table.
Can I filter by planner, venue or month?
Yes. The Overview sheet has slicers for Year, Month, Event Type, Planner, Status and Venue.
Is there an Excel or Power BI version?
Yes. See the Office Event Attendance Dashboard in Excel and the Office Event Attendance Dashboard in Power BI.
Related Event and Attendance Templates
- Office Event Attendance Dashboard in Excel: the same dashboard in Excel
- Office Event Attendance Dashboard in Power BI: the Power BI edition
- Attendance Tracking System for Events and Meetings in Google Sheets: record attendance for each event
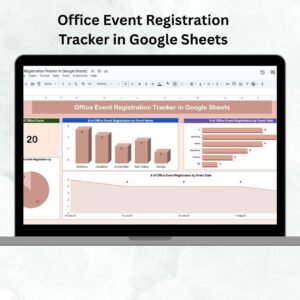
- Office Event Registration Tracker in Google Sheets: track sign-ups before the event
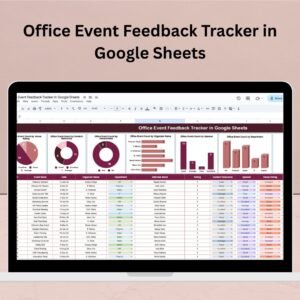
- Office Event Feedback Tracker in Google Sheets: collect feedback after the event
Browse all Google Sheets dashboards.





























Reviews
There are no reviews yet.