

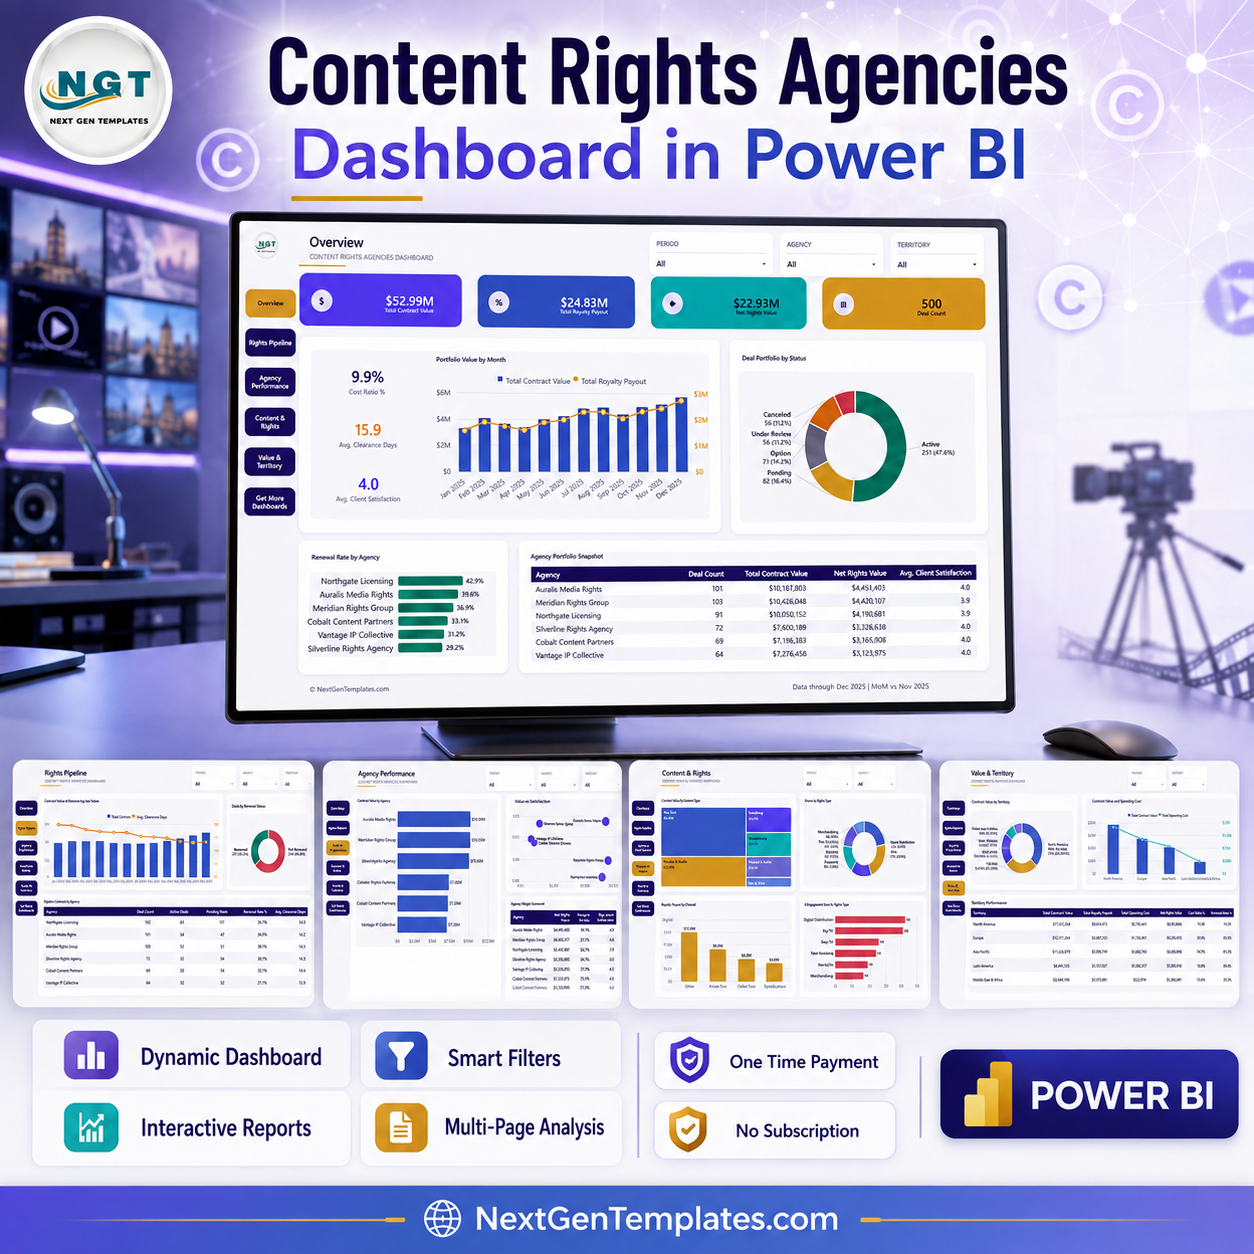

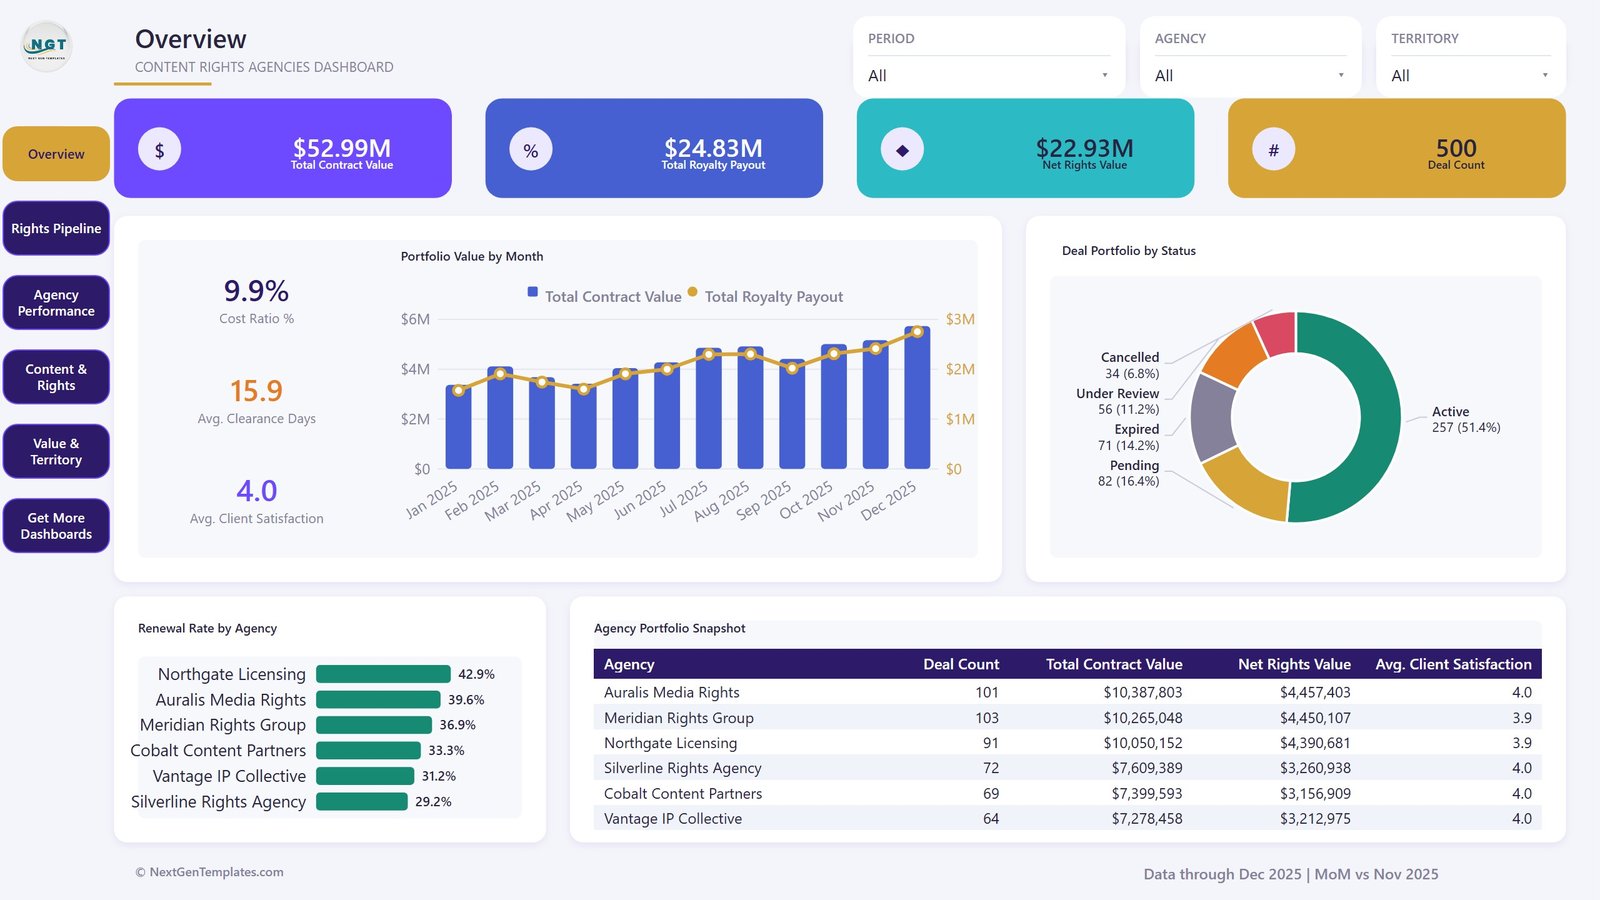
The Content Rights Agencies Dashboard in Power BI is a ready-to-open .pbix report that turns a deal-level licensing register into a six-page rights portfolio review. The sample file carries 500 licensing deals dated January to December 2025 across 6 rights agencies, 6 content types, 6 rights types, 5 territories and 4 sales channels, and opens on headline figures of $52.99M total contract value, $24.83M royalty payout and $22.93M net rights value. Nine named DAX measures drive every visual, three slicers stay in sync across all pages, and a hidden drillthrough page reaches the underlying deals. One file, one payment, no monthly seat fee — and if it does not fit your register, tell us within 7 days and we will make it right. Content Rights Agencies Dashboard in Power BI
Key Features of the Content Rights Agencies Dashboard in Power BI
- Six visible report pages — Overview, Rights Pipeline, Agency Performance, Content & Rights, Value & Territory, and a Get More Dashboards page — reached from a left navigation rail that stays in the same place on every page.
- Three synced slicers in the header: PERIOD (year-month from a built-in Date table), AGENCY and TERRITORY. Change one on any page and every other page follows.
- Nine named measures: Total Contract Value, Total Royalty Payout, Total Operating Cost, Net Rights Value, Deal Count, Renewal Rate %, Avg. Clearance Days, Avg. Client Satisfaction and Total Infringement Cases, plus a Cost Ratio % derived on the Overview page.
- A hidden Deal Details drillthrough page bound to eight fields — Agency, Content Type, Rights Type, Territory, Licensee Type, Channel, Status and Renewal Status — so any bar, slice or table row can be opened down to the individual deals behind it.
- Two hidden 280×360 tooltip pages (Category Detail and Trend Detail) that pop up on hover instead of the flat default tooltip.
- A custom NGT theme (Indigo Rights Portfolio) with the logo, page backgrounds and a © NextGenTemplates.com footer already applied — the colours are a theme JSON inside the file, so re-branding is a single swap.
- Import mode with a Date table, so the report refreshes from your own workbook without rebuilding relationships.
What’s Inside the Content Rights Agencies Dashboard in Power BI
The download is a single ZIP holding three files: the .pbix report, the Data.xlsx source workbook, and a Power BI Dashboard user manual PDF.
Overview. Four KPI cards, three side statistics (Cost Ratio % 9.9%, Avg. Clearance Days 15.9, Avg. Client Satisfaction 4.0), a Portfolio Value by Month combo chart pairing contract value columns with a royalty payout line, a Deal Portfolio by Status donut (Active 257, Pending 82, Expired 71, Under Review 56, Cancelled 34), a Renewal Rate by Agency bar chart and an Agency Portfolio Snapshot table.
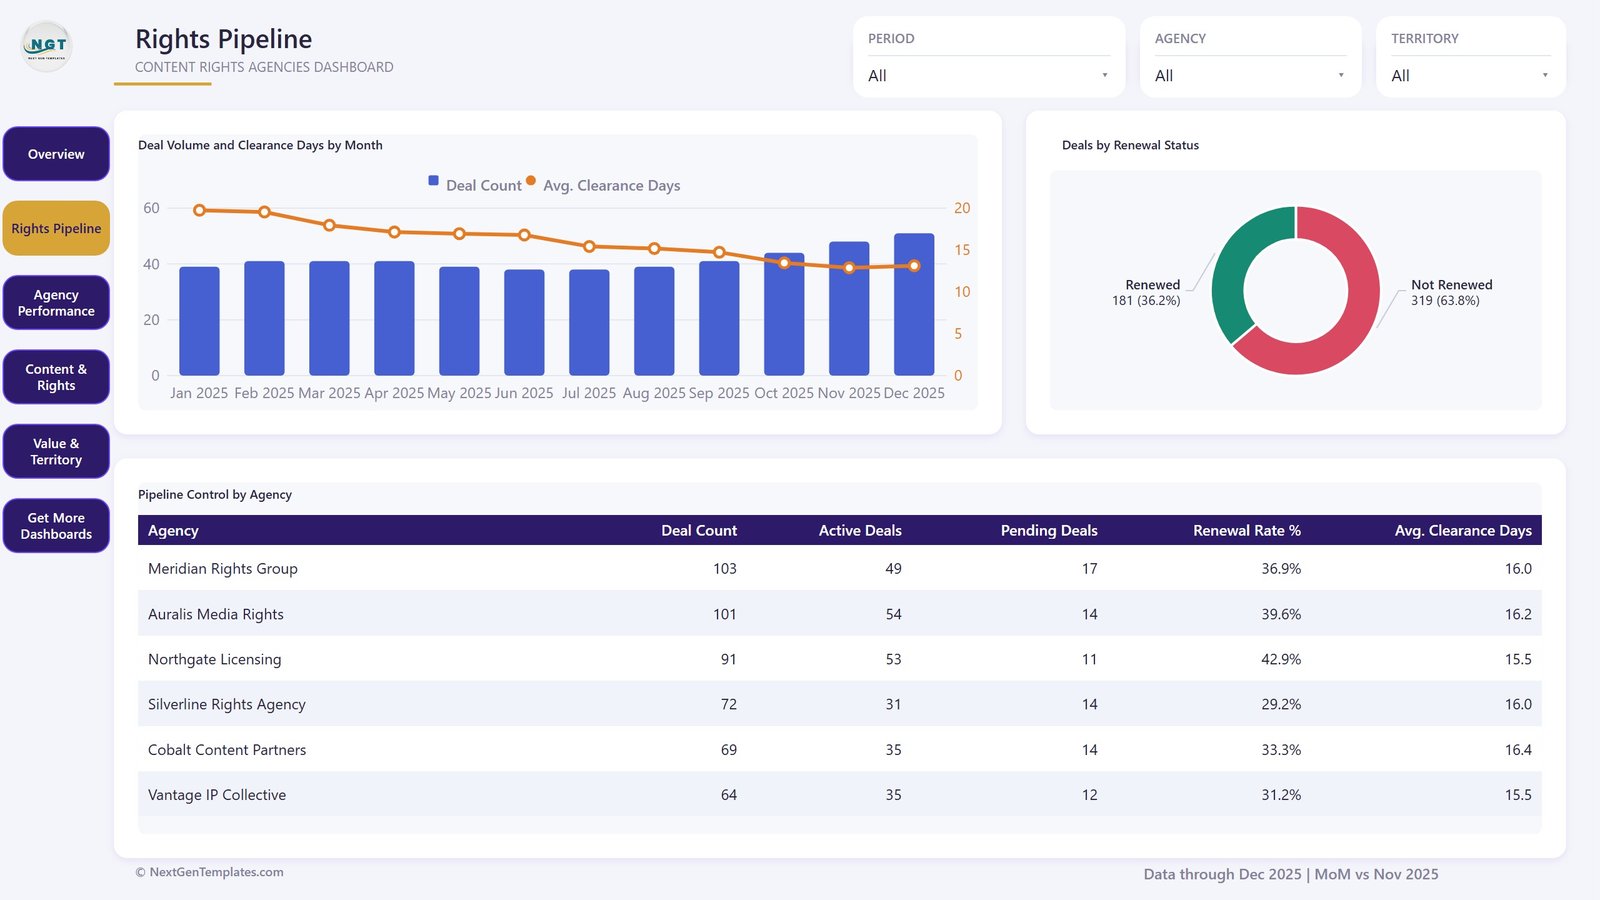
Rights Pipeline. Deal Volume and Clearance Days by Month, a Deals by Renewal Status donut (181 renewed, 319 not renewed) and a Pipeline Control by Agency table carrying deal count, active deals, pending deals, renewal rate % and average clearance days per agency.
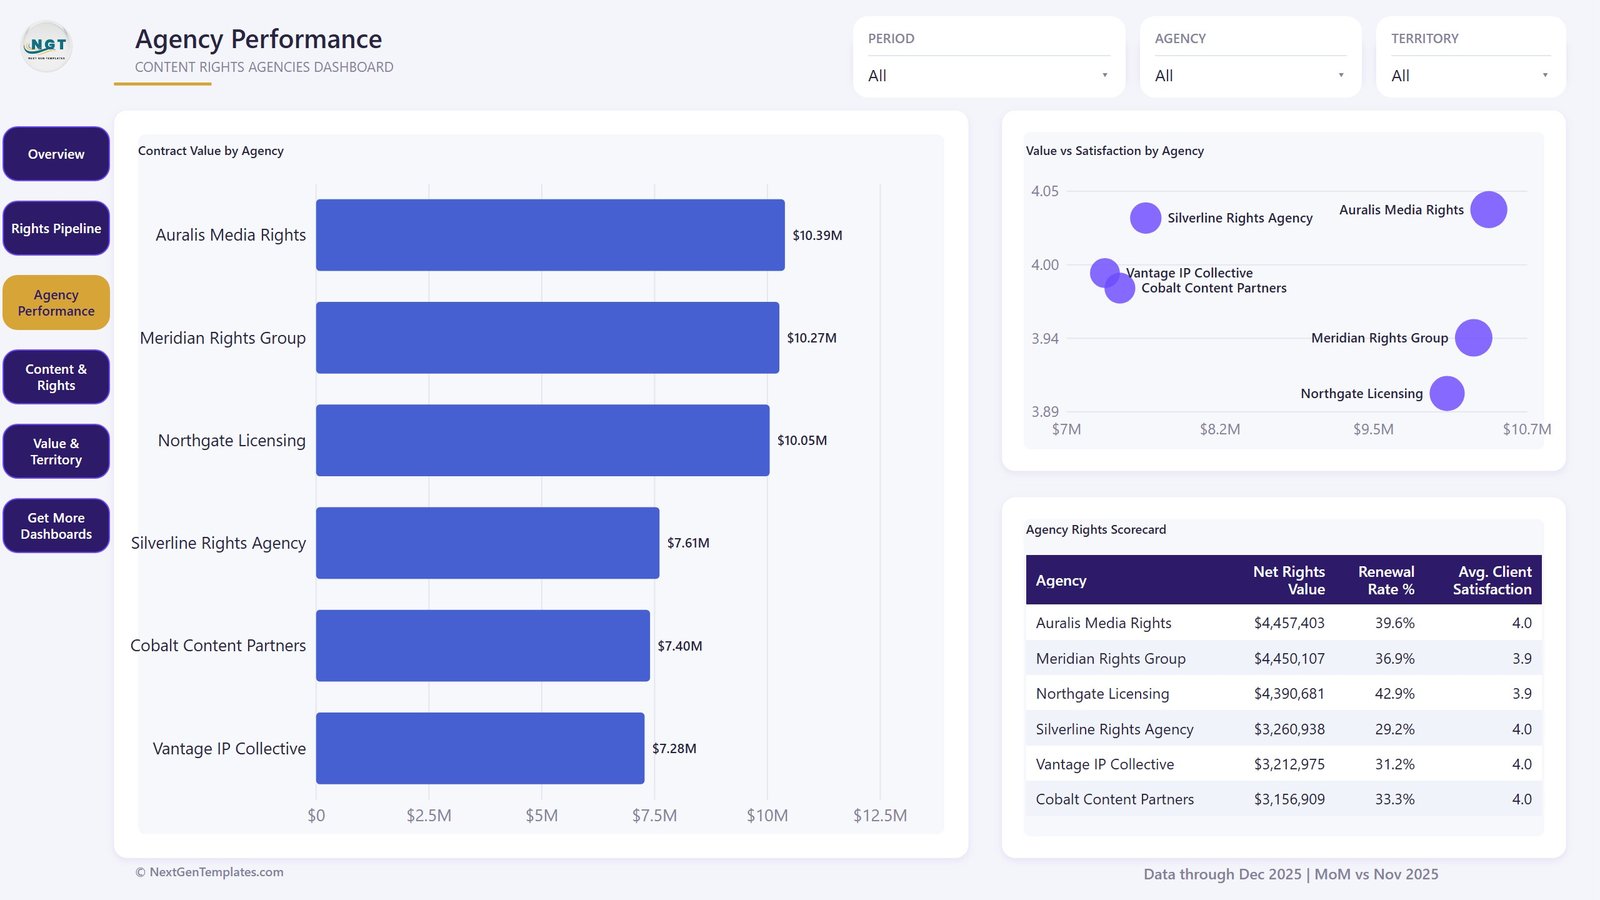
Agency Performance. Contract Value by Agency, a Value vs Satisfaction by Agency scatter that places each agency on money against service quality, and an Agency Rights Scorecard table.
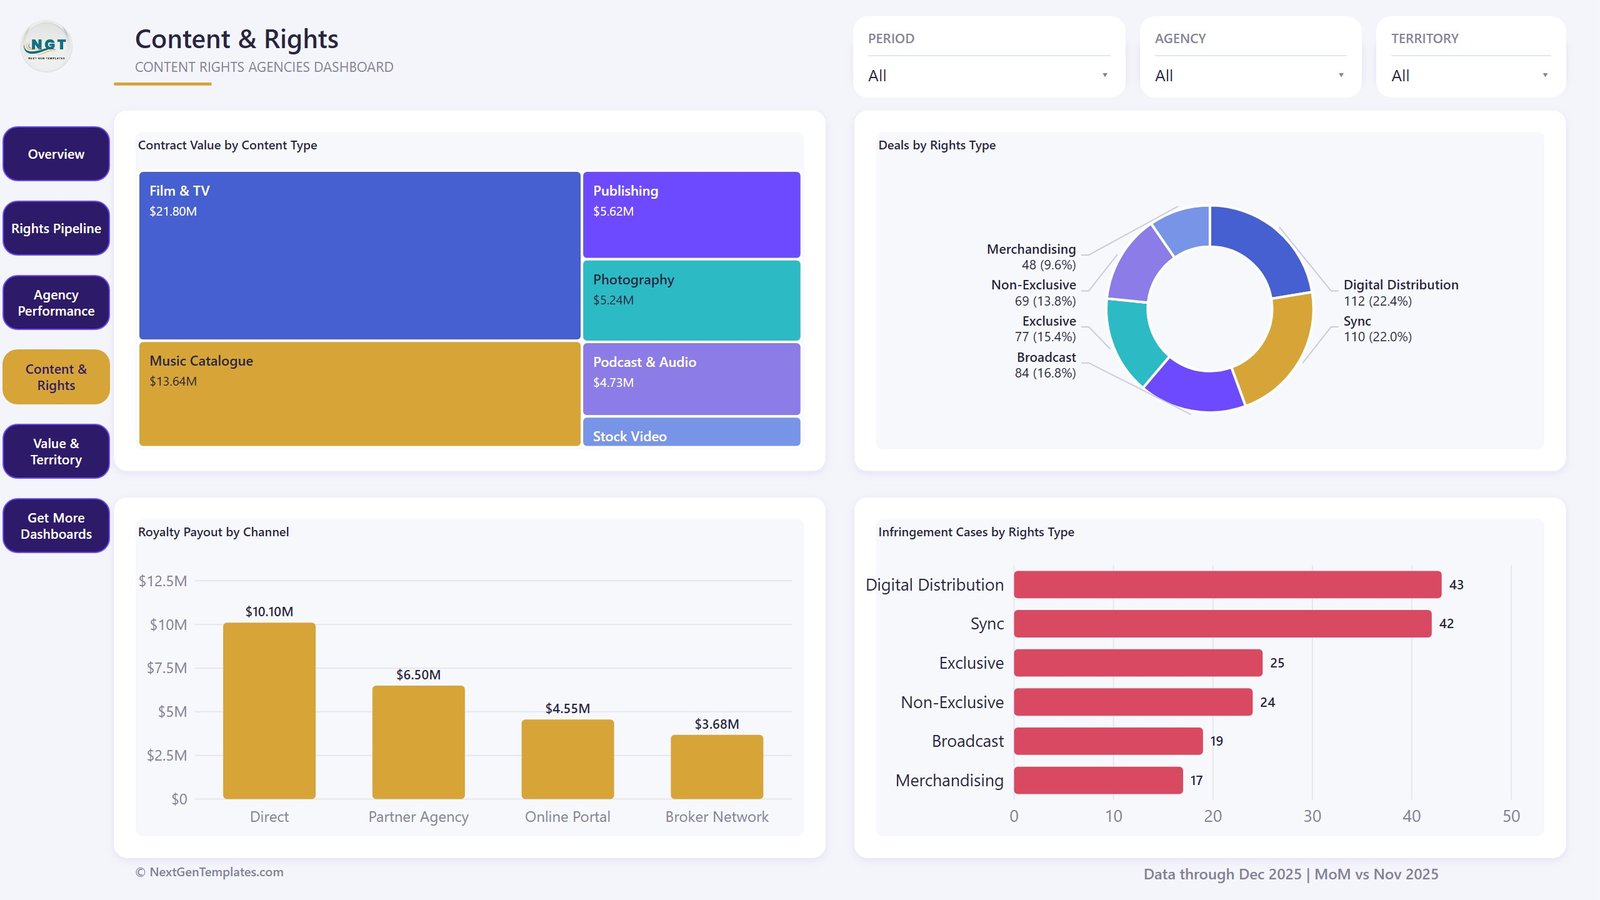
Content & Rights. A Contract Value by Content Type treemap (Film & TV $21.80M, Music Catalogue $13.64M, Publishing $5.62M, Photography $5.24M, Podcast & Audio $4.73M, Stock Video), a Deals by Rights Type donut, Royalty Payout by Channel, and Infringement Cases by Rights Type. Content Rights Agencies Dashboard in Power BI
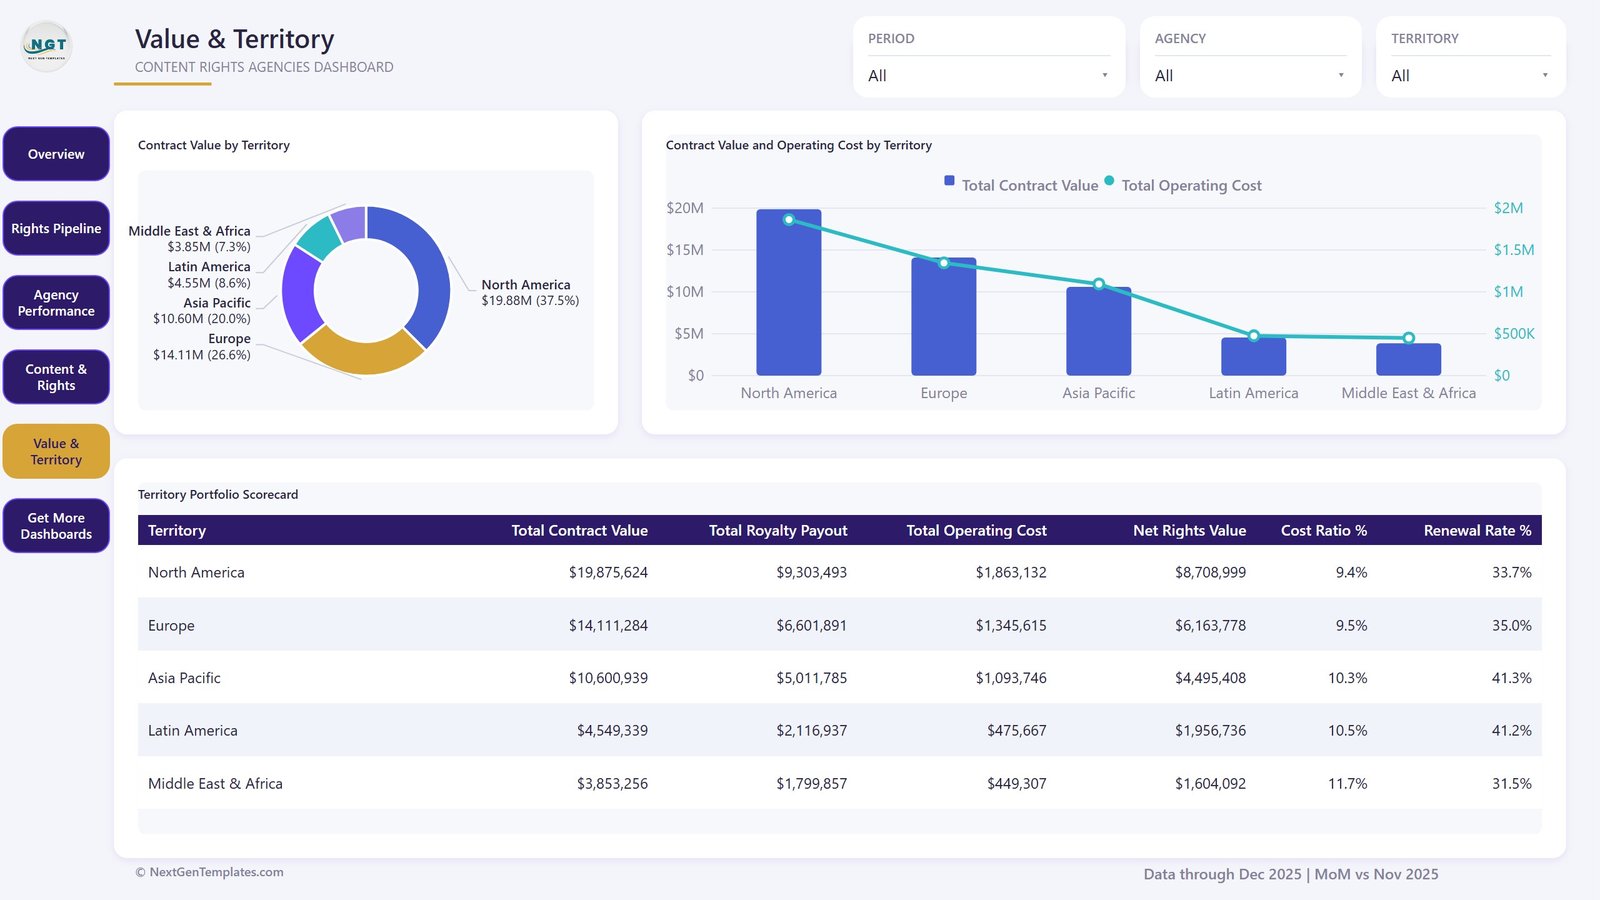
Value & Territory. Contract Value by Territory, a Contract Value and Operating Cost by Territory combo, and a Territory Portfolio Scorecard that lands cost ratio % and renewal rate % beside the money columns.
Content Rights Agencies Dashboard in Power BI vs. Tableau vs. Paid Rights-Management SaaS — Where This Fits
| This Power BI dashboard | Tableau / Qlik build | Paid rights-management SaaS | |
|---|---|---|---|
| Cost | One payment, this page | Licence plus build time | Per-seat subscription, annual contract |
| Platform | Power BI Desktop (free) | Tableau Desktop / Qlik Sense | Vendor web app |
| Setup time | Open, repoint the workbook, refresh | Weeks of modelling and design | Onboarding and data migration |
| Real-time team collaboration | Via Power BI Service if you publish it | Via Tableau Server | Built in |
| Mobile access | Power BI mobile app | Vendor mobile app | Built in |
| Customizable fields | Full — model, DAX and theme are all editable | Full | Limited to the vendor’s schema |
| Share with link | Yes, once published to the Service | Yes, on Server | Yes |
| Year-1 cost at 5 users | The price on this page | Five Tableau Creator seats plus build | Typically four figures and up |
| Deal-level drillthrough | Yes — eight bound fields | Build it yourself | Depends on the vendor |
| Contract execution / e-signature | No — this is a reporting layer | No | Usually included |
This is a reporting layer, not a rights-clearance system. It reads a register you already keep; it does not sign contracts, register copyright, monitor the open web for infringement, or calculate what a licence is legally worth. The Infringement Cases figures are a column in your own data, not a detection service.
Who This Template Is For — and Who It’s Not For
A good fit for: content rights and licensing agencies with a deal register in Excel; media, music and publishing rights departments reporting to a board each month; syndication and distribution teams tracking renewals across territories; anyone who has outgrown a pivot table but is not ready to buy a rights platform.
Not a good fit for: agencies with fewer than about 30 live deals, where a sorted table is honestly faster; teams that need contract storage, e-signature or automatic royalty statements; anyone who wants the numbers to update without opening Power BI Desktop or publishing to the Service; and anyone expecting legal or valuation advice — this file gives you none. Content Rights Agencies Dashboard in Power BI
How to Use the Content Rights Agencies Dashboard in Power BI
- Unzip the download and open the
.pbixin Power BI Desktop (free from Microsoft). - Walk the six pages with the sample data first so you can see what each visual expects.
- Open
Data.xlsxand replace the 500 sample rows with your own, keeping the 18 column headings exactly as they are: Deal ID, Date, Agency, Rights Manager, Content Type, Rights Type, Territory, Licensee Type, Channel, License Duration, Contract Value, Royalty Payout, Operating Cost, Clearance Days, Client Satisfaction, Infringement Cases, Status, Renewal Status. - In Power BI Desktop, use Transform data → Data source settings to point the query at your copy of the workbook, then Refresh.
- Right-click any bar, slice or table row and choose Drill through → Deal Details to see the deals behind the number.
- Publish to the Power BI Service if you want colleagues to open it from a link.
Real-World Use Cases
Priya, portfolio director at a music rights agency. Her monthly board pack used to be three pivot tables glued into PowerPoint. She now filters PERIOD to the closing month, screenshots the Overview page, and uses the Renewal Rate by Agency bar to open the conversation about which sub-agent is losing renewals.
Tomas, syndication manager for a film and TV catalogue. He filters TERRITORY to Asia Pacific and reads the Territory Portfolio Scorecard’s cost ratio column to decide whether a market is worth the servicing cost before he commits to another year.
Amara, rights operations lead at a publisher. She watches the Deal Volume and Clearance Days by Month combo on the Rights Pipeline page — clearance days falling while volume holds is the evidence she takes into her headcount review.
Frequently Asked Questions
Do I need a paid Power BI licence?
No. Power BI Desktop is free from Microsoft and opens the file. A paid licence is only needed if you want to publish to the Power BI Service and share it with colleagues there.
Can I use my own data?
Yes. Replace the rows in Data.xlsx, keep the 18 column headings, repoint the data source and refresh. Every measure and visual follows.
Does the file include real licensing data?
No. All 500 deals, agency names, rights managers and figures are demonstration data generated for this template. They exist so the visuals render before you connect your own register.
Can I change the colours and add my logo?
Yes. The palette lives in a theme JSON inside the report, and the NGT logo is an image on each page background — both are editable in Power BI Desktop.
What is the difference between this and the Excel version?
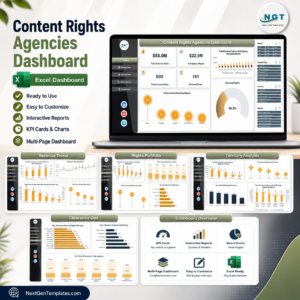
The Content Rights Agencies Dashboard in Excel covers the same subject in a workbook with pivot tables and slicers. This one is a Power BI model with DAX measures, a drillthrough page and hover tooltip pages. Buy the one that matches the tool your team already uses.
Is this a KPI scorecard?
No. This is the analytical line — charts, tables and drillthrough. If you want a month-picker scorecard with traffic lights against targets, look at the KPI Dashboard shelf instead.
Will it handle more than 500 rows?
Yes. 500 is the size of the sample. Power BI’s import engine handles registers far larger than that; the visuals do not change.
About the Author
Built by PK – Microsoft Certified Professional with 15+ years of Excel, Google Sheets, and Power BI experience. Founder of NextGenTemplates, reaching 300K+ subscribers across YouTube channels. Every template is hand-built and tested before release.
Explore Related Templates
- Content Rights Agencies Dashboard in Excel — the same subject as a workbook.
- Content Licensing Dashboard in Power BI — licensing seen from the licensor’s side.
- Podcast Monetization Startups Dashboard in Power BI — audio revenue and sponsorship.
- Film and Television Dashboard in Google Sheets — production-side reporting.
- Publishing Dashboard in Google Sheets — titles, print runs and margins.
- Browse the full Power BI Dashboard shelf or every Power BI template.
Ready to see your own rights portfolio this way? Add the Content Rights Agencies Dashboard in Power BI to your cart, unzip it, and point it at your register — most buyers have their own numbers on screen inside an hour.
Last updated: 26 August 2026.
































Reviews
There are no reviews yet.