Managing content licensing across multiple platforms, regions, and content categories can quickly become complex. Media companies, streaming platforms, and digital publishers must track licensing fees, royalties, marketing costs, delivery expenses, and profit margins simultaneously. Without a centralized system, analyzing this information becomes time-consuming and inefficient.
The Content Licensing Dashboard in Power BI is a powerful, ready-to-use analytics solution designed to simplify content licensing performance monitoring. This interactive dashboard transforms raw licensing data into clear insights using KPI cards, dynamic filters, and powerful visual charts.
Instead of reviewing scattered reports and spreadsheets, decision-makers can instantly analyze licensing performance across content types, platforms, regions, and months. As a result, organizations can identify profitable opportunities, optimize licensing strategies, and make smarter business decisions.
Whether you are managing movies, digital courses, podcasts, music, or educational content, this Power BI dashboard provides a complete analytical view of your licensing operations.
🚀 Key Feature of Content Licensing Dashboard in Power BI
The dashboard includes five powerful analytical pages, each designed to provide a different perspective on licensing performance.
📊 Overview Page
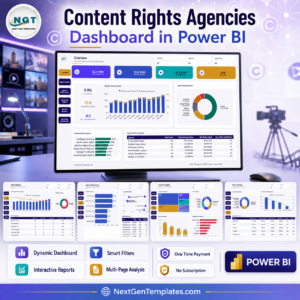
This is the main dashboard page that provides a quick snapshot of overall licensing performance. It displays key financial indicators and interactive charts for instant insights.
KPI Cards Included:
Total Cost
Revenue Recognized (USD)
Profit
Profit Margin (%)
Delivery Cost
Charts Available on Overview Page:
Profit Margin (%)
Marketing Cost by Platform
Delivery Cost by Region
License Fee by Content Type
These visuals help executives quickly evaluate overall business performance.
📈 Content Type Analysis Page
Different content types generate different revenue levels. This page helps organizations analyze performance across multiple content categories.
Charts included:
Marketing Cost by Content Type
Profit by Content Type
Total Cost by Content Type
Revenue Recognized (USD) by Content Type
With these insights, companies can identify which content categories deliver the highest return on investment.
🌐 Platform Analysis Page
Content licensing often involves various platforms such as streaming services, online learning portals, broadcasting networks, and digital marketplaces.
This page analyzes platform-wise performance using the following charts:
License Fee by Platform
Total Cost by Platform
Royalty Paid by Platform
Profit by Platform
Organizations can easily determine which platforms generate the highest profit.
🌎 Region Analysis Page
Content licensing demand varies across geographic regions. This page helps businesses evaluate regional performance.
Charts included:
License Fee by Region
Total Cost by Region
Royalty by Region
Profit Margin (%) by Region
Using this analysis, companies can identify regions with the strongest licensing potential.
📅 Month Analysis Page
Tracking monthly trends is crucial in content licensing because revenue can fluctuate due to marketing campaigns, seasonal demand, or new content releases.
This page includes the following charts:
Delivery Cost by Month
License Fee by Month
Profit Margin (%) by Month
These insights allow businesses to monitor trends and plan future licensing strategies.

📦 What’s Inside the Content Licensing Dashboard in Power BI
This ready-to-use Power BI solution includes everything required to start analyzing licensing performance immediately.
✔ Fully designed Power BI Dashboard File
✔ Structured data model for licensing analytics
✔ Five interactive dashboard pages
✔ KPI cards for instant performance monitoring
✔ Dynamic slicers and filters for deeper analysis
✔ Professional data visualization charts
✔ Easy customization options for your organization
The dashboard structure is built to ensure clarity, simplicity, and powerful insights.
⚙️ How to Use the Content Licensing Dashboard in Power BI
Using this dashboard is simple and straightforward.
1️⃣ Import or connect your licensing data into the Power BI file.
2️⃣ Update datasets such as licensing revenue, costs, royalties, and delivery expenses.
3️⃣ Use interactive slicers and filters to analyze performance across platforms, regions, and content types.
4️⃣ Review KPI cards and charts to monitor profitability and trends.
5️⃣ Use insights from the dashboard to optimize licensing strategies.
Within minutes, you can transform raw licensing data into actionable insights.
🎯 Who Can Benefit from This Content Licensing Dashboard in Power BI
This dashboard is ideal for professionals and organizations involved in digital content licensing.
🎬 Media Production Companies – Track licensing revenue across platforms.
📺 Streaming Platforms – Analyze content profitability and royalties.
🎧 Podcast & Music Producers – Monitor licensing deals and revenue streams.
📚 Online Course Platforms – Evaluate educational content licensing performance.
📊 Digital Publishers – Track distribution performance across regions.
📈 Marketing & Analytics Teams – Monitor marketing costs and ROI.
💼 Business Executives – Make data-driven strategic decisions.
Whether you are managing a global media company or a growing digital content platform, this dashboard provides powerful analytical insights.
Click hare to read the Detailed blog post
Watch the step-by-step video tutorial:
Watch the step-by-step video tutorial:
Visit our YouTube channel to learn step-by-step video tutorials
https://www.youtube.com/@PKAnExcelExpert
Compatibility and Requirements
- Works in Power BI Desktop, which is free to download. Microsoft explains how to get it in Get Power BI Desktop.
- You connect or import your own licensing data, then use the slicers and filters to explore it.
Frequently Asked Questions
How many pages does the dashboard have?
Five pages: Overview, Content Type Analysis, Platform Analysis, Region Analysis and Month Analysis.
Which KPIs does the Overview page show?
Five KPI cards: Total Cost, Revenue Recognized (USD), Profit, Profit Margin (%) and Delivery Cost.
Can I compare platforms and regions?
Yes. The Platform Analysis page shows license fee, total cost, royalty paid and profit by platform. The Region Analysis page shows license fee, total cost, royalty and profit margin (%) by region.
How do I use my own data?
Import or connect your licensing data in the Power BI file and update the datasets for revenue, costs, royalties and delivery expenses. Then use the slicers and filters to review the results.
Is there an Excel version?
Yes. See the Content Licensing Dashboard in Excel.
Related Dashboard Templates
- Content Licensing Dashboard in Excel: the same licensing analysis in Excel
- Content Marketing Agencies Dashboard in Power BI: another Power BI dashboard for content businesses
- Copywriting & Content Creation Dashboard in Power BI: tracks content creation work
- Content Marketing KPI Dashboard in Power BI: KPI view of content marketing
- Power BI Dashboard Mega Collection: 15 Power BI templates in one download
Browse all Power BI dashboards.