


Looking to boost your content marketing ROI with data-driven precision? 📈 The Content Marketing KPI Dashboard in Power BI is your all-in-one analytics powerhouse—designed to help digital marketers, content creators, and strategists visualize performance, optimize content, and achieve marketing goals faster.
Whether you manage blog content, social media campaigns, or multi-channel marketing efforts, this ready-to-use Power BI template brings your performance data to life—providing instant insights into what’s working and what’s not.
✅ Key Features of Content Marketing KPI Dashboard in Power BI
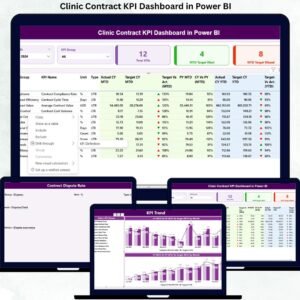
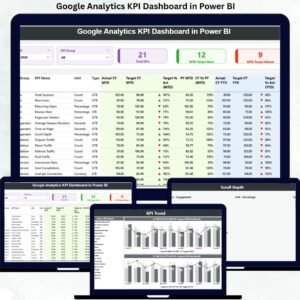
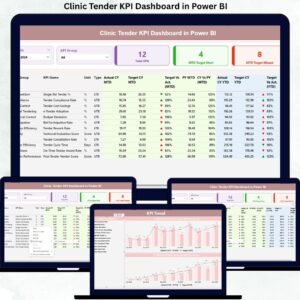
📊 Summary Page: Instant Performance Overview
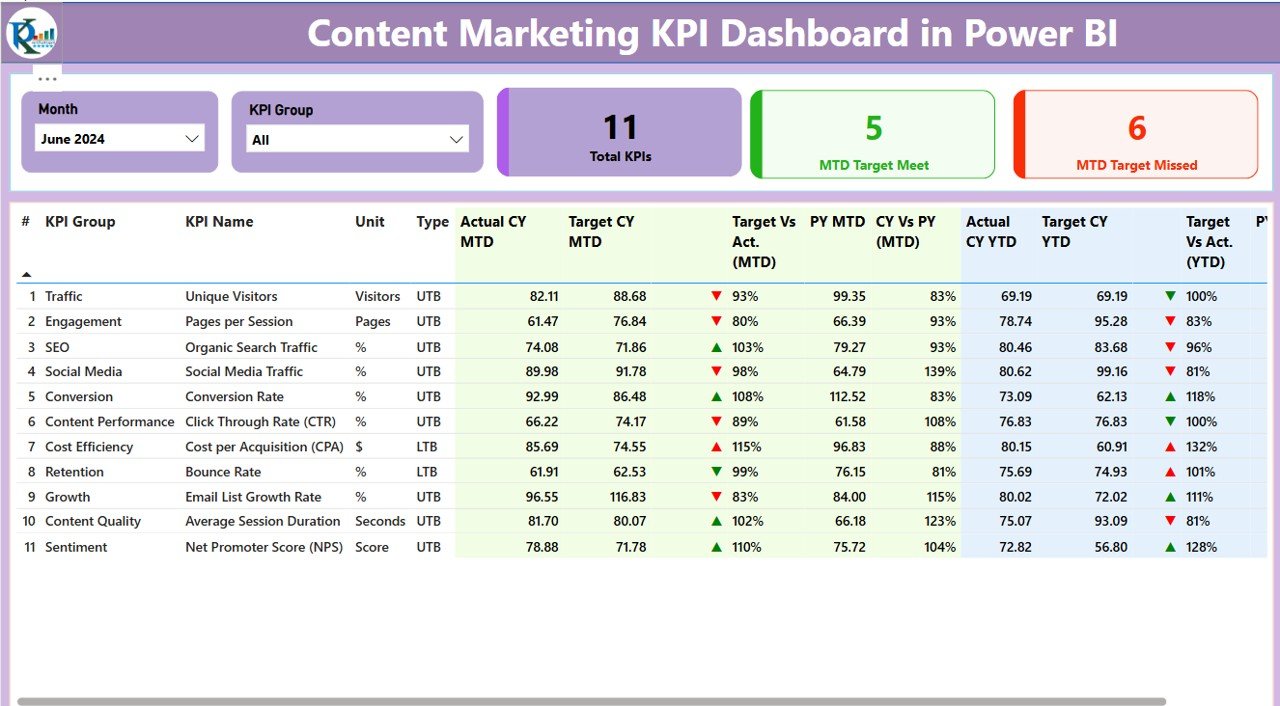
The dashboard’s Summary Page is your command center for high-level insights:
-
🗓️ Filter by Month and KPI Group
-
🧮 View Total KPIs, MTD Target Met, and MTD Target Missed
-
📋 Analyze KPI data including actuals, targets, % variance, and trend icons (✔️ or ❌)
-
🔁 Compare MTD & YTD stats with previous year figures
It’s the ultimate tool for tracking campaign performance in real-time.
📈 KPI Trend Page: Visualizing Progress Over Time
Spot trends, peaks, and dips in your content performance:
-
📊 Combo charts for MTD and YTD comparisons
-
🔎 KPI selector slicer to analyze trends for each key metric
This page gives you the visibility to refine strategies before they underperform.
📘 KPI Definition Page: Transparency & Clarity
This drill-through page details:
-
📌 KPI Formulas and Unit of Measurement
-
🧠 Definitions explaining each metric’s importance
Clarity ensures every team member knows what they’re tracking and why it matters.
📁 What’s Inside the Content Marketing KPI Dashboard in Power BI
This Power BI dashboard is connected to structured Excel files that act as the data engine:
-
🟩 Input_Actual Sheet – Enter monthly actual performance values
-
🟨 Input_Target Sheet – Set targets for each KPI
-
📘 KPI_Definition Sheet – Capture formulas, units, and KPI types (UTB/LTB)
Everything is dynamically linked, ensuring that once you input data, visuals update automatically.
🛠️ How to Use the Content Marketing KPI Dashboard in Power BI
-
✅ Connect the Power BI dashboard to your Excel data
-
📥 Input actual performance metrics monthly
-
🎯 Define targets in the Input_Target sheet
-
🔍 Use slicers and filters to explore performance by month, KPI group, or metric
-
📊 Review KPI trend charts for actionable insights
-
🧠 Use the KPI Definition page to guide team alignment
No coding or advanced setup required—just plug in your data and go!
👥 Who Can Benefit from This Dashboard?
🧑💻 Content Marketing Teams – Monitor campaign results in real-time
📢 Digital Marketing Agencies – Impress clients with visual KPI reports
🧠 Marketing Analysts – Track performance and guide data-driven decisions
📱 Social Media Managers – Evaluate engagement, reach, and conversions
📰 Blog Content Strategists – Assess post impact, bounce rates, and time-on-page
📈 CMOs and Executives – Get a bird’s-eye view of strategy alignment
📋 Freelancers & Consultants – Use it as a professional client delivery tool
🔗 Click here to read the Detailed blog post
📺 Visit our YouTube channel to learn step-by-step video tutorials


Reviews
There are no reviews yet.