



Managing licensed content across multiple platforms, regions, and contracts can quickly become overwhelming. When licensing costs, royalty payments, and revenue data live in disconnected spreadsheets, decision-making slows down and profit leakage increases.
That is exactly why the Content Licensing Dashboard in Excel is designed as a powerful, ready-to-use analytical solution for media companies, OTT platforms, publishers, and licensing teams.
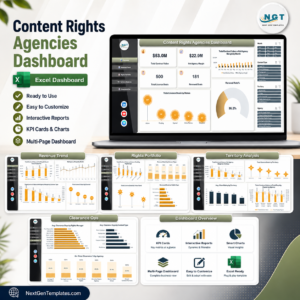
This dashboard transforms complex licensing data into clear KPIs, interactive visuals, and actionable insights—all inside Excel. Instead of chasing numbers, you gain instant visibility into costs, revenue, royalties, profit margins, and trends, helping you make confident, data-driven licensing decisions.
🔑 Key Features of the Content Licensing Dashboard in Excel
📌 Executive Overview Page
Get a high-level snapshot of your entire licensing portfolio with automated KPIs like Total Cost, Revenue Recognized, Profit, Profit Margin %, and Average Royalty Rate.
📌 Interactive Slicers
Filter performance instantly by content type, platform, region, or time period—no formulas or manual work required.
📌 Automated Calculations
The dashboard automatically calculates profit, margins, and royalties, eliminating manual errors and saving hours of reporting time.
📌 Clean, Professional Visuals
All charts are designed for clarity, making insights easy to understand for finance and non-finance users alike.
📌 Page Navigator for Easy Movement
Jump between analytical pages smoothly using the built-in page navigator on the left side.
📦 What’s Inside the Content Licensing Dashboard in Excel
This Excel dashboard includes five structured analytical pages, plus supporting sheets:

📊 Overview Page – Portfolio-level KPIs and performance visuals
📊 Content Type Analysis – Compare cost, profit, and royalties across content categories
📊 Platform Analysis – Identify profitable and underperforming platforms
📊 Region Analysis – Track geographic performance and margins
📊 Monthly Trends Page – Monitor cost, revenue, and margin trends over time
📄 Data Sheet – Centralized place to enter all licensing data
📄 Support Sheet – Backend calculations that keep the dashboard clean and fast
Every page updates automatically as soon as you change the data.
🛠️ How to Use the Content Licensing Dashboard in Excel
Using this dashboard is simple and intuitive:
1️⃣ Enter your licensing data in the Data Sheet
2️⃣ Costs, revenue, profit, and royalties calculate automatically
3️⃣ Use slicers to filter insights instantly
4️⃣ Review KPIs on the Overview Page
5️⃣ Drill deeper using content, platform, region, and monthly trend pages
No advanced Excel skills are required—basic Excel knowledge is enough to unlock powerful insights.
👥 Who Can Benefit from This Content Licensing Dashboard in Excel
🎬 Media & Entertainment Companies
📺 OTT & Streaming Platforms
📚 Digital Publishers
🎵 Music Licensing Firms
📈 Content Aggregators
💼 Finance & Accounting Teams
📑 Licensing & Contract Managers
📊 Strategy & Business Analytics Teams
If your organization manages licensed content and wants better control over profitability, this dashboard is built for you.
👉 Click here to read the Detailed blog post
📺 Visit our YouTube channel to learn step-by-step video tutorials
👉 Youtube.com/@PKAnExcelExpert
Watch the step-by-step video tutorial:
Compatibility and Requirements
- Works in Microsoft Excel desktop (Excel 2016 or later, or Microsoft 365).
- The dashboard pages use slicers to filter by content type, platform, region and time period. Microsoft explains them in Use slicers to filter data.
Frequently Asked Questions
Which pages are included?
Five analytical pages: Overview, Content Type Analysis, Platform Analysis, Region Analysis and Monthly Trends. There is also a Data Sheet for your licensing data and a Support Sheet with the backend calculations.
Where do I enter my licensing data?
On the Data Sheet. Costs, revenue, profit and royalties calculate automatically from what you enter.
Which KPIs does the Overview page show?
Total Cost, Revenue Recognized, Profit, Profit Margin % and Average Royalty Rate.
Can I filter the results?
Yes. Slicers filter the dashboard by content type, platform, region or time period, with no formulas needed.
Is there a Power BI version?
Yes. See the Content Licensing Dashboard in Power BI.
Related Excel Dashboards
- Content Licensing Dashboard in Power BI: the same licensing analysis in Power BI
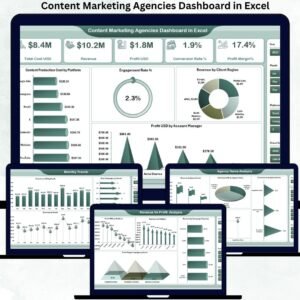
- Content Marketing Agencies Dashboard in Excel: an Excel dashboard for content teams and agencies
- Copywriting & Content Creation Dashboard in Excel: tracks content production in Excel
- E-learning Content Services Dashboard in Excel: another content business dashboard
- KPI Dashboard Library (Excel): 15 KPI dashboards in one download
Browse all Excel dashboards.












Reviews
There are no reviews yet.