

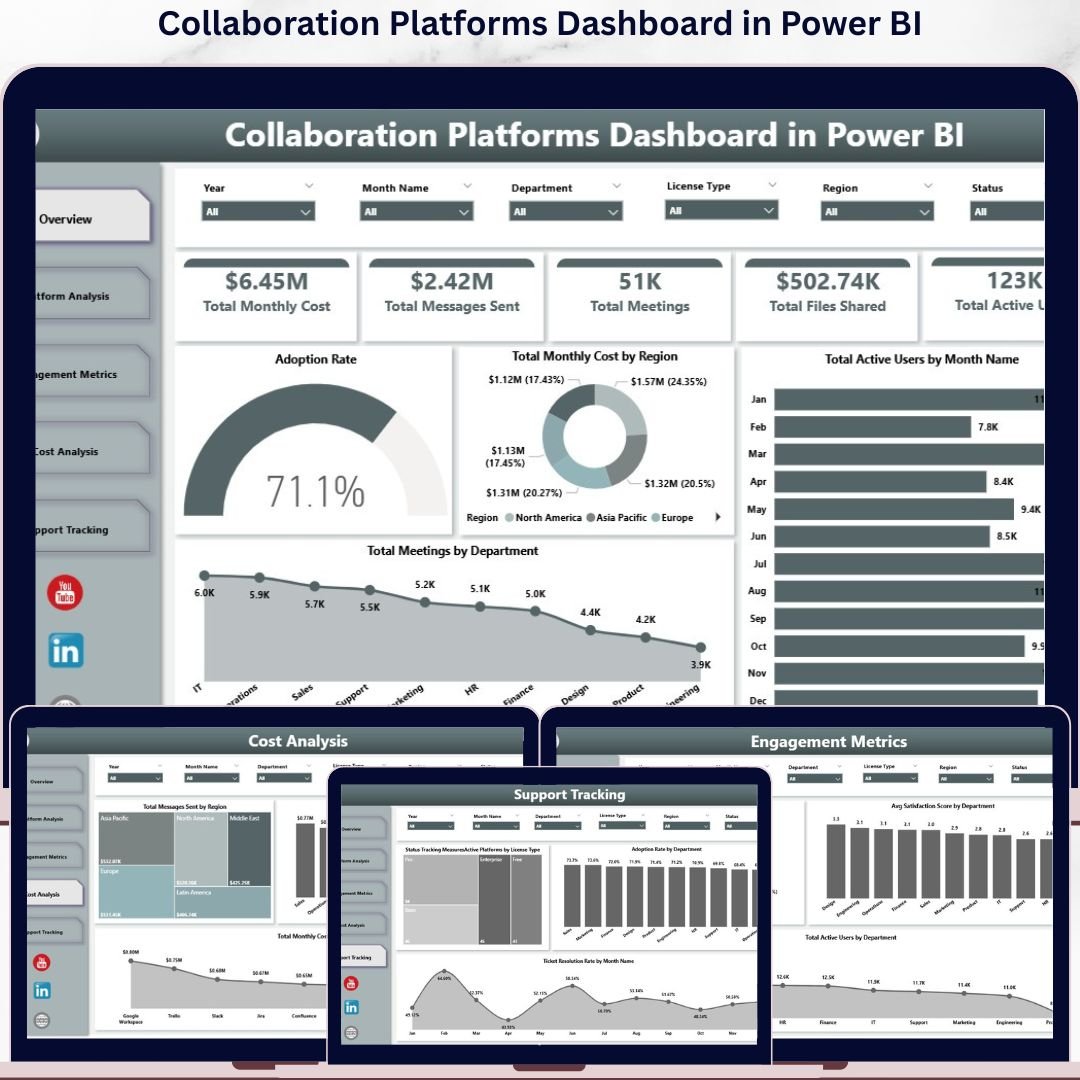

If you manage a modern workplace, you are probably paying for Microsoft Teams, Slack, Zoom and Google Workspace at the same time — and most IT leaders cannot say, off the top of their head, which one their teams actually use the most, which delivers the highest satisfaction per dollar spent, or where licence spend is being wasted. The Collaboration Platforms Dashboard in Power BI answers those questions in one .pbix file, with 5 KPI cards, 16 interactive visuals, and slicers on every page that filter by department, region, platform, licence type and year.
Setup takes under 10 minutes. Open the .pbix file in Power BI Desktop, connect it to your collaboration usage data, and click Refresh — every page recalculates automatically.
🌍 Join 10,000+ customers in 180+ countries using Nextgen Templates to replace paid SaaS adoption tools with one-time-purchase Excel, Google Sheets, Power BI and HTML templates.
✅ Instant download · One-time payment · No subscription · No per-user fees · Lifetime access
🔑 Key Features of the Collaboration Platforms Dashboard in Power BI
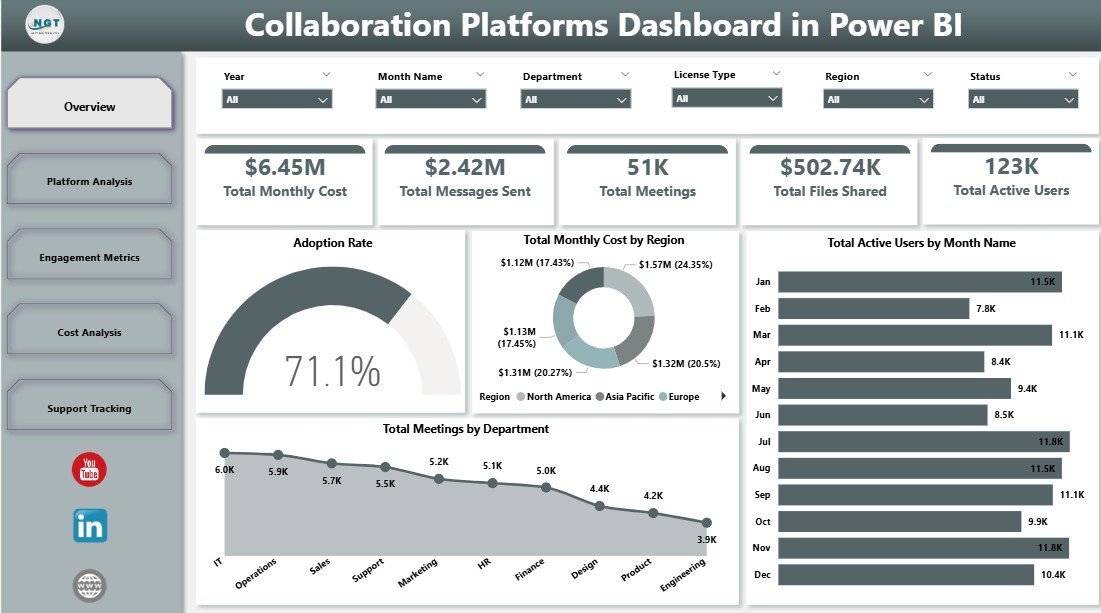
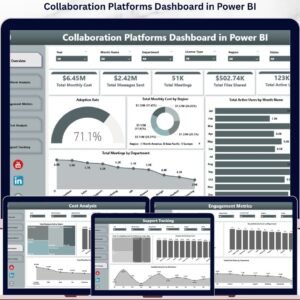
🎯 5 Pre-Built KPI Cards on the Overview Page — Total Monthly Cost, Total Messages Sent, Total Meetings, Total Files Shared, and Total Active Users sit at the top of the Overview page, giving IT directors an instant read on collaboration spend and engagement — no manual pivot building required.
📊 16 Interactive Visuals Across 5 Pages — The Collaboration Platforms Dashboard in Power BI delivers 4 charts on Overview and 3 on each analysis page, covering adoption rate, regional cost, monthly active-user trend, licence-type cost, department satisfaction, regional messaging and support ticket resolution. Every visual responds to slicer clicks instantly.
🎛️ Dynamic Slicers on Every Page — Filter by Department, Region, Platform, Licence Type or Year and every chart on that page refreshes in seconds. No DAX writing, no formula editing, no rebuilding pivots.
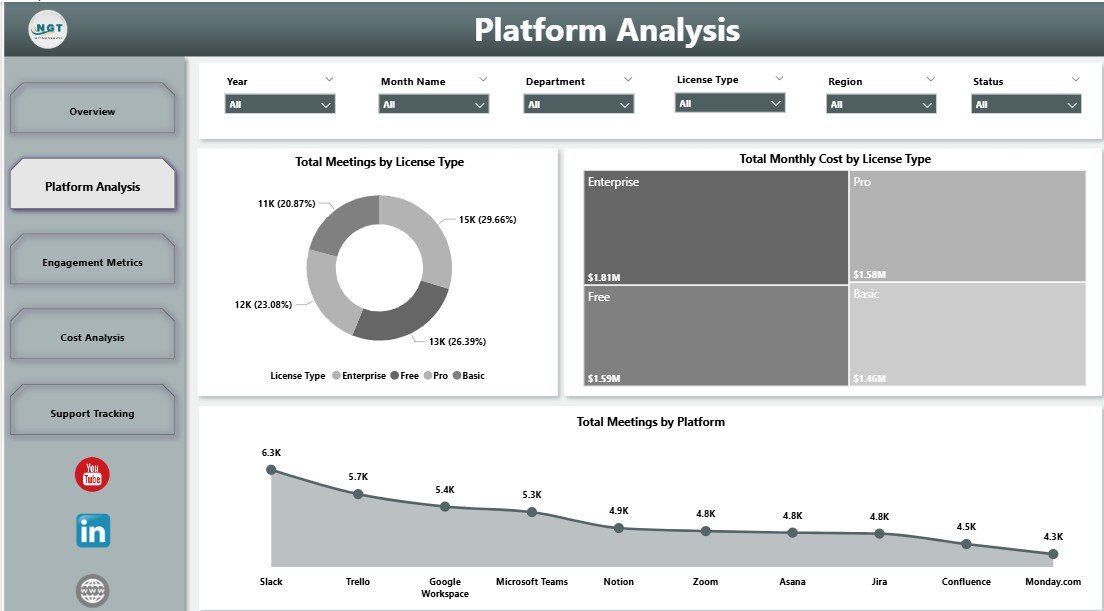
💼 Licence-Type Cost & Usage Benchmarking — The Platform Analysis page breaks down Total Meetings and Total Monthly Cost by licence type alongside meetings-per-platform — the data you need to spot under-used Enterprise seats and right-size your subscription mix.
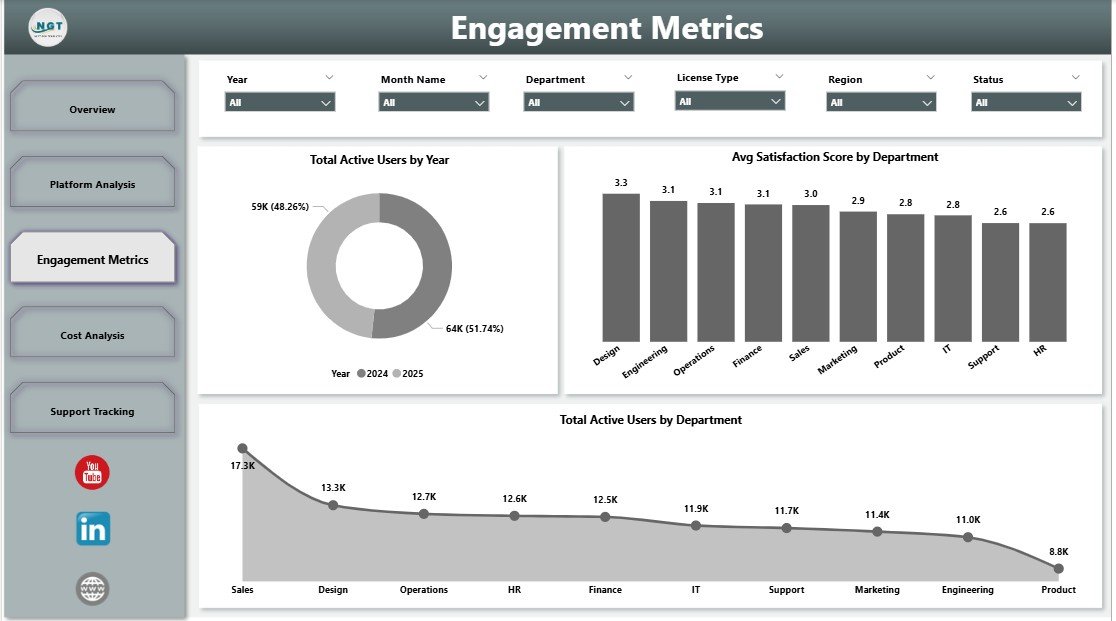
⚙️ Department-Level Satisfaction & Adoption Insight — The Engagement Metrics page measures Avg Satisfaction Score by Department and Total Active Users by Department, while Support Tracking shows Adoption Rate by Department and Ticket Resolution Rate by Month, giving HR and IT a shared view of platform health.
📦 What’s Inside the Collaboration Platforms Dashboard in Power BI
The template contains 5 analysis pages built natively in Power BI Desktop (.pbix format), ready to connect to your collaboration usage dataset:
📋 Page 1 — Overview
The Overview page opens with 5 KPI cards (Total Monthly Cost, Total Messages Sent, Total Meetings, Total Files Shared, Total Active Users) followed by 4 charts: Adoption Rate (gauge showing platform-wide adoption against target), Total Monthly Cost by Region (regional spend distribution to identify cost-heavy geographies), Total Active Users by Month Name (twelve-month engagement trend) and Total Meetings by Department (which teams collaborate the most).
📈 Page 2 — Platform Analysis
Platform Analysis benchmarks your subscription mix with three charts: Total Meetings by Licence Type (Standard vs Enterprise vs Education usage), Total Monthly Cost by Licence Type (where the budget actually flows), and Total Meetings by Platform (Teams vs Slack vs Zoom vs Google Meet head-to-head). Together they reveal whether you are paying premium prices for low-usage platforms.
🧑💼 Page 3 — Engagement Metrics
The Engagement Metrics page surfaces three views: Total Active Users by Year (multi-year adoption growth or decline), Avg Satisfaction Score by Department (which teams rate collaboration tools highest and lowest), and Total Active Users by Department (where adoption is concentrated). Use this page during quarterly business reviews to spot disengaged teams before churn shows up in survey results.
💰 Page 4 — Cost Analysis
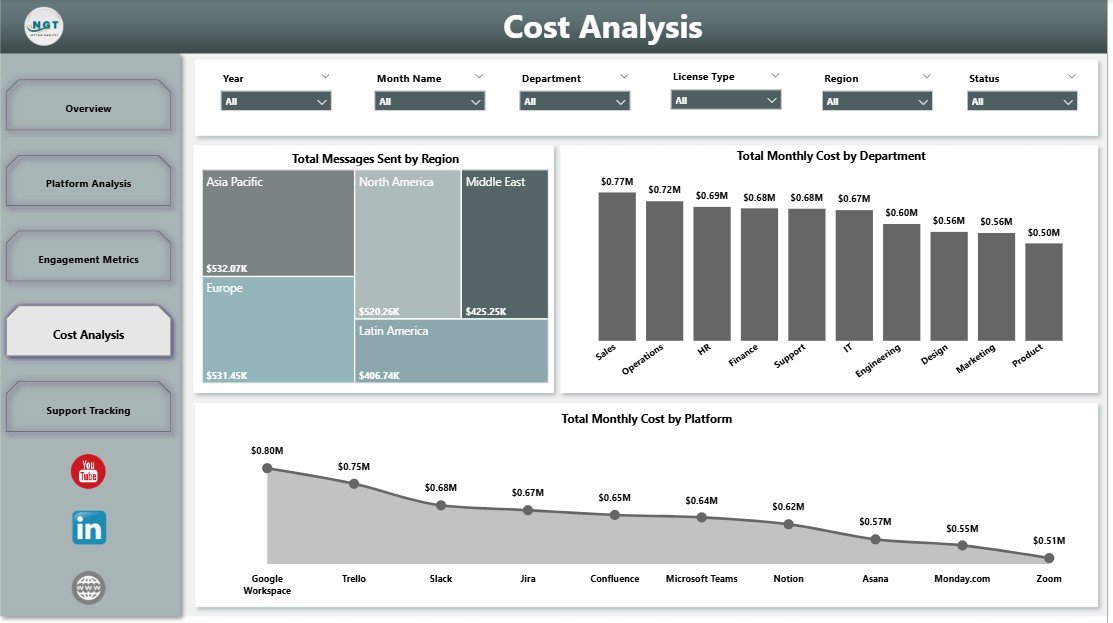
Cost Analysis answers the CFO’s question — “where is the money going?” — with three charts: Total Messages Sent by Region (where communication volume happens), Total Monthly Cost by Department (which cost centres consume the most licence budget), and Total Monthly Cost by Platform (whether Teams, Slack or Zoom is your biggest line item). Filter by Year or Licence Type to model renewal-period decisions.
🛠️ Page 5 — Support Tracking
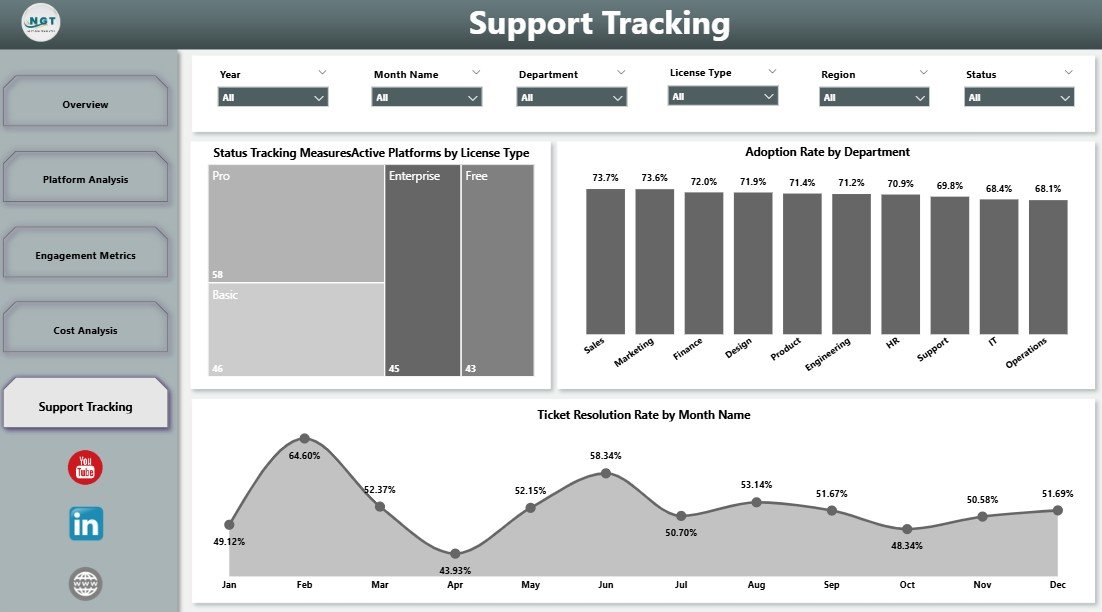
Support Tracking ties usage to service health with Active Platforms by Licence Type (how many platforms each licence tier touches), Adoption Rate by Department (which departments are sticky and which have stalled), and Ticket Resolution Rate by Month Name (whether IT support is keeping up with collaboration-related issues). This is the page you bring into IT Steering Committee meetings.
📊 Collaboration Platforms Dashboard in Power BI vs. Tableau / Qlik vs. Productiv / Zylo / BetterCloud
| Feature | Collaboration Platforms Dashboard in Power BI | Tableau / Qlik Build | Productiv / Zylo / BetterCloud |
|---|---|---|---|
| Cost | $17.99 one-time ✅ | $70/user/month + dev time | $25–$50/user/month |
| Platform | Power BI Desktop (free) ✅ | Tableau Desktop / Qlik Sense | SaaS web app |
| Setup time | Under 10 minutes ✅ | 2–6 weeks (custom build) | 1–3 weeks (onboarding) |
| KPI cards + slicers | 5 KPIs + slicers on every page ✅ | Must be built from scratch | Limited customisation |
| Department, region & licence breakdown | Included ✅ | Manual build | Vendor-defined views only |
| Works offline (Desktop only) | Yes ✅ | Yes | ❌ Cloud only |
| One-time payment | Yes ✅ | ❌ Per-user subscription | ❌ Per-user subscription |
| Year-1 cost at 10 users | $17.99 ✅ | $8,400+ | $3,000–$6,000 |
For IT teams that want a working collaboration-spend dashboard today — without a Productiv-class subscription or a six-week Tableau project — the Collaboration Platforms Dashboard in Power BI sits in the sweet spot.
👥 Who This Template Is For — and Who It’s Not For
✅ This template is built for:
- IT directors and CIOs managing 50–5,000 seats across Microsoft Teams, Slack, Zoom and Google Workspace
- SaaS / IT operations managers who need monthly collaboration-spend reports for finance
- Workplace Experience leads tracking adoption and satisfaction by department
- Consultants delivering quarterly platform optimisation reviews to client companies
❌ This template is NOT for:
- Single-platform shops that only use one collaboration tool (overhead exceeds value)
- Teams that need live SSO log-stream ingestion (use Productiv / Zylo for real-time API feeds)
- Companies needing automated licence-reclamation workflows (this is a reporting tool, not a SaaS management platform)
⚙️ How to Use the Collaboration Platforms Dashboard in Power BI
- Download the .pbix file from your Nextgen Templates account immediately after purchase.
- Open Power BI Desktop (free download from Microsoft).
- Replace the sample dataset with your collaboration platform usage export (CSV or Excel).
- Click Refresh — all 5 pages and 16 visuals update automatically with your real data.
- Use the slicers on each page to filter by Department, Region, Platform, Licence Type or Year.
💼 Real-World Use Cases
Priya is the IT Operations Lead at a 1,200-person fintech. She uses the Cost Analysis page to compare Total Monthly Cost by Platform and discovers her company is paying for Zoom Enterprise on top of Microsoft Teams Phone — duplicate functionality across 400 seats. She consolidates onto Teams Phone at renewal and cuts $86,000 from next year’s collaboration budget.
Marcus is the CIO at a manufacturing group with offices in three regions. He uses the Engagement Metrics page each quarter to track Avg Satisfaction Score by Department. After spotting that Operations rates platforms 2.1 points below Sales, he commissions a workflow audit, switches that team’s primary tool from Slack to Teams, and watches satisfaction rebound by the next quarterly review.
Aditi runs IT consulting engagements for mid-market clients. She drops each client’s usage export into the .pbix file and uses the Support Tracking page in deliverables — Active Platforms by Licence Type plus Adoption Rate by Department gives her a one-page diagnostic chart she charges $4,000 per engagement to produce.
❓ Frequently Asked Questions
What KPIs does the Collaboration Platforms Dashboard in Power BI track?
The Collaboration Platforms Dashboard in Power BI tracks 5 headline KPIs — Total Monthly Cost, Total Messages Sent, Total Meetings, Total Files Shared and Total Active Users — plus 16 chart-level metrics covering adoption rate, cost-by-platform, cost-by-licence-type, satisfaction score by department, regional messaging volume and ticket resolution. Every metric refreshes automatically when you reload the dataset.
Do I need Power BI Pro or a paid Microsoft subscription?
No. The Collaboration Platforms Dashboard in Power BI runs entirely in Power BI Desktop, which Microsoft offers as a free download. A Power BI Pro or Premium subscription is only required if you want to publish the report to the Power BI Service for online sharing. Desktop-only use, including all 5 pages, 16 visuals and slicers, is 100% free.
How does this compare to Productiv, Zylo or BetterCloud?
Productiv, Zylo and BetterCloud are SaaS Management Platforms costing $25–$50 per user per month with annual contracts. The Collaboration Platforms Dashboard in Power BI is a one-time $17.99 reporting layer that you control: connect it to your existing export from Microsoft 365 admin, Slack analytics, Zoom admin or Google Workspace, and it produces the same usage, cost and adoption views without the per-seat fee.
Can I add my own platforms, departments and regions?
Yes. The dashboard reads from a data source you control, so you replace the sample entries with your own platforms (whether that is Teams, Slack, Zoom, Webex, Discord or Google Meet), your real department names and your actual regional segmentation. All 16 charts and slicers reflect your customised dataset automatically after one Refresh.
How long does initial setup take?
Setup takes under 10 minutes. Download the .pbix file, open it in Power BI Desktop, point the dataset to your collaboration usage export, and click Refresh. The full 5-page dashboard populates with your data — no DAX writing, no Power BI development skills, no model-rebuilding required.
Does this work alongside our existing SaaS Management Platform?
Yes. Many IT teams use the Collaboration Platforms Dashboard in Power BI as the executive-facing reporting layer on top of raw exports from Productiv, Zylo, BetterCloud or Microsoft 365 admin. The dashboard turns those exports into a board-ready 5-page report without exposing the full SMP to non-IT stakeholders.
👤 About the Author
Built by PK — Microsoft Certified Professional with 15+ years of Excel, Google Sheets and Power BI experience. Founder of NextGenTemplates, reaching 300K+ subscribers across YouTube channels (@PK-AnExcelExpert, @NextGenTemplates, @NeoTechNavigators). Every template is hand-built and tested before release.
🔗 Explore Related Templates
Explore our full Power BI Dashboard Templates collection or these related products:
📊 Collaboration Platforms Dashboard in Excel — The same 5-page analysis built natively in Excel with pivot tables and slicers. No Power BI Desktop required.
📸 Photography Business Dashboard in Power BI — Booking, photographer-performance and profitability analytics for studio operators.
🖨️ Print Shop Dashboard in Power BI — Job revenue, cost and turnaround time tracking for creative service businesses.
📖 Click here to read the Detailed Blog Post
🎥 Visit our YouTube channel for step-by-step video tutorials
👉 YouTube.com/@NextGenTemplates

















Reviews
There are no reviews yet.