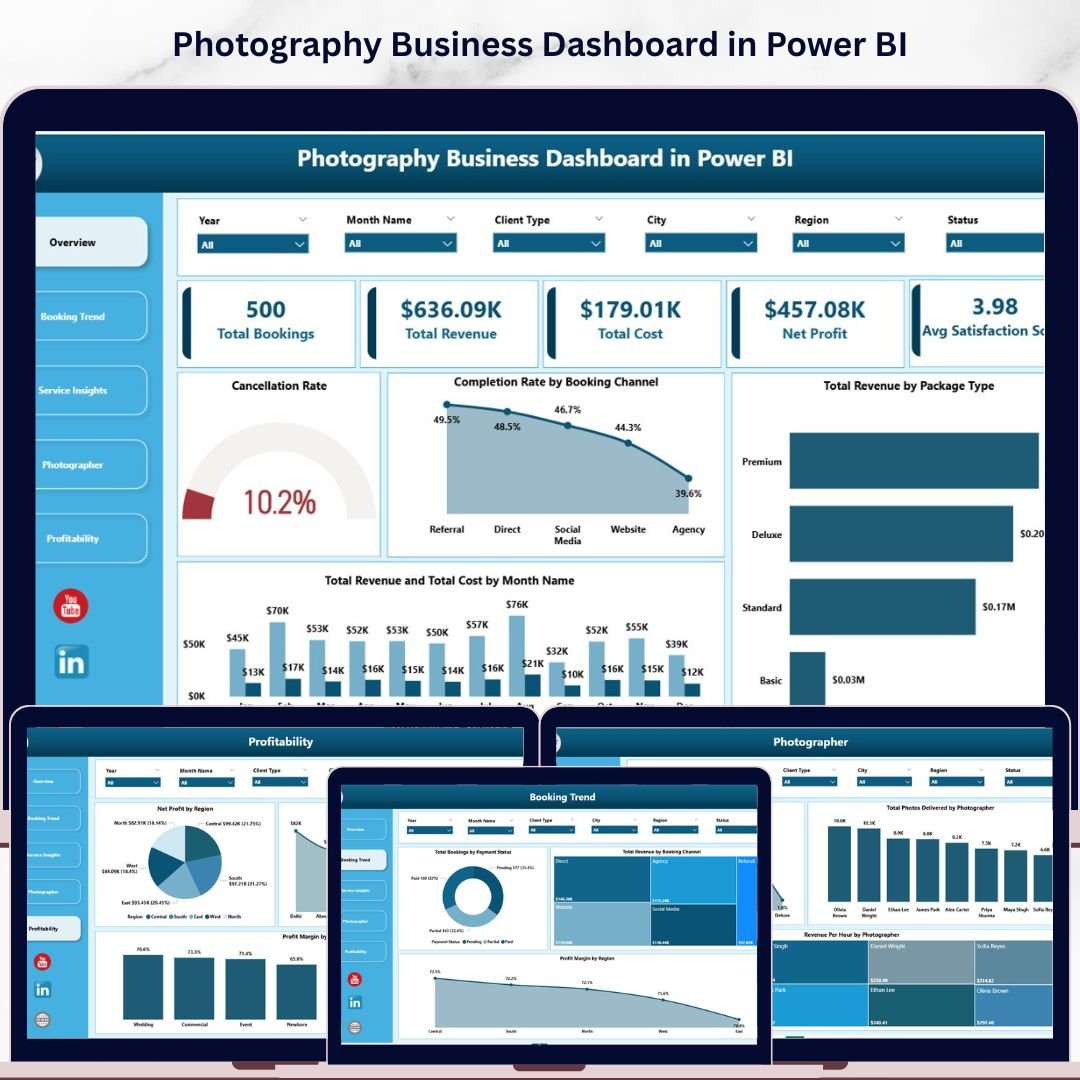
The Photography Business Dashboard in Power BI tracks 5 KPI cards and 15 charts across 5 interactive pages — covering booking trends, service performance, photographer-level analytics, and profitability by region and city. Setup takes under 10 minutes: open the .pbix file in Power BI Desktop, replace the sample data, and every visual updates automatically.
🌍 Join 8,400+ teams in 40+ countries using Nextgen Templates to replace paid SaaS tools with one-time-purchase Excel, Google Sheets, Power BI, and HTML templates.
✅ Instant download · One-time payment · No subscription · No per-user fees · Lifetime access
🔑 Key Features of Photography Business Dashboard in Power BI
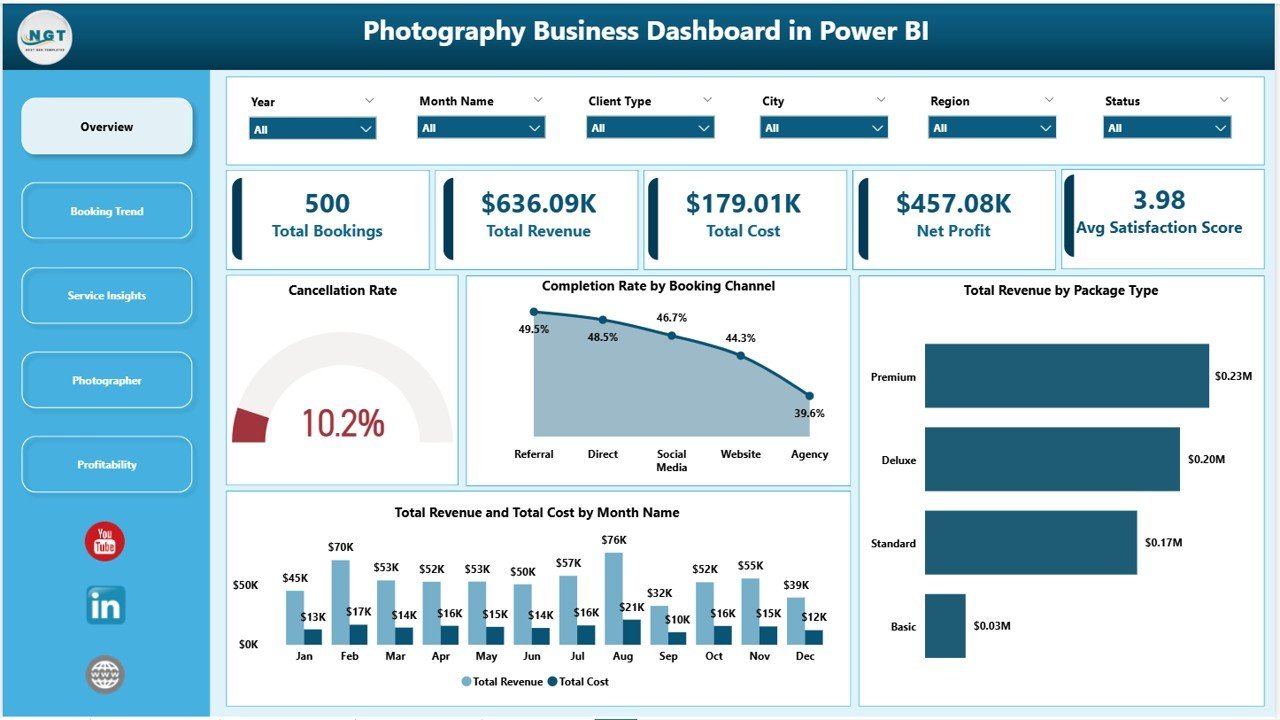
📸 5 Pre-Built KPI Cards — The Overview page displays Total Bookings, Total Revenue, Total Cost, Net Profit, and Average Satisfaction Score, giving photography studio owners an instant snapshot of business health. This dashboard tracks all five metrics simultaneously — no manual calculations, no separate spreadsheets.
📊 15 Interactive Charts Across 5 Pages — The Photography Business Dashboard in Power BI delivers 3 charts per analysis page covering booking channels, payment status, service types, photographer revenue-per-hour, cancellation rates, and profitability by region and city. Every chart is filter-ready and updates with a single slicer click.
🔍 Dynamic Slicers for Instant Filtering — Apply filters by booking channel, package type, region, service type, client type, or payment status, and every visual on that page refreshes in seconds — no manual pivoting, no formula editing.
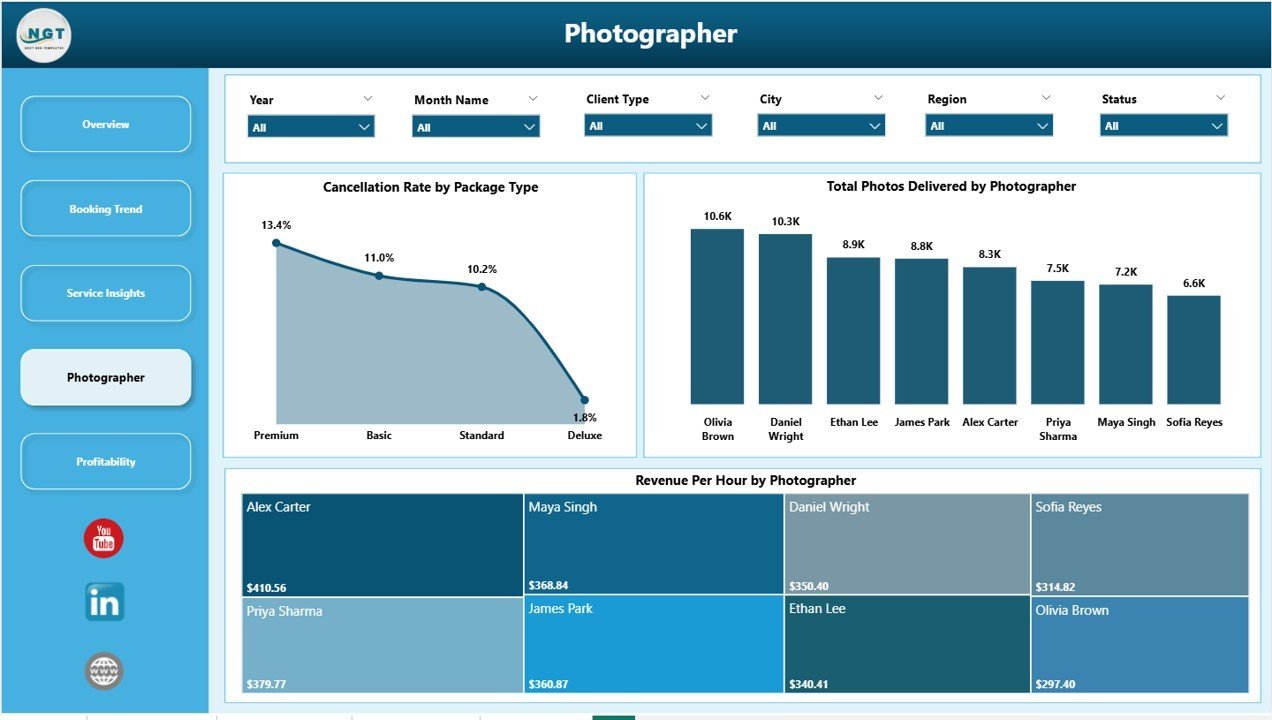
📷 Photographer-Level Performance Benchmarking — The Photographer page measures Revenue per Hour, Total Photos Delivered, and Cancellation Rate by Package Type for each photographer individually. This is the data you need to identify top performers, adjust pricing, and optimize scheduling.
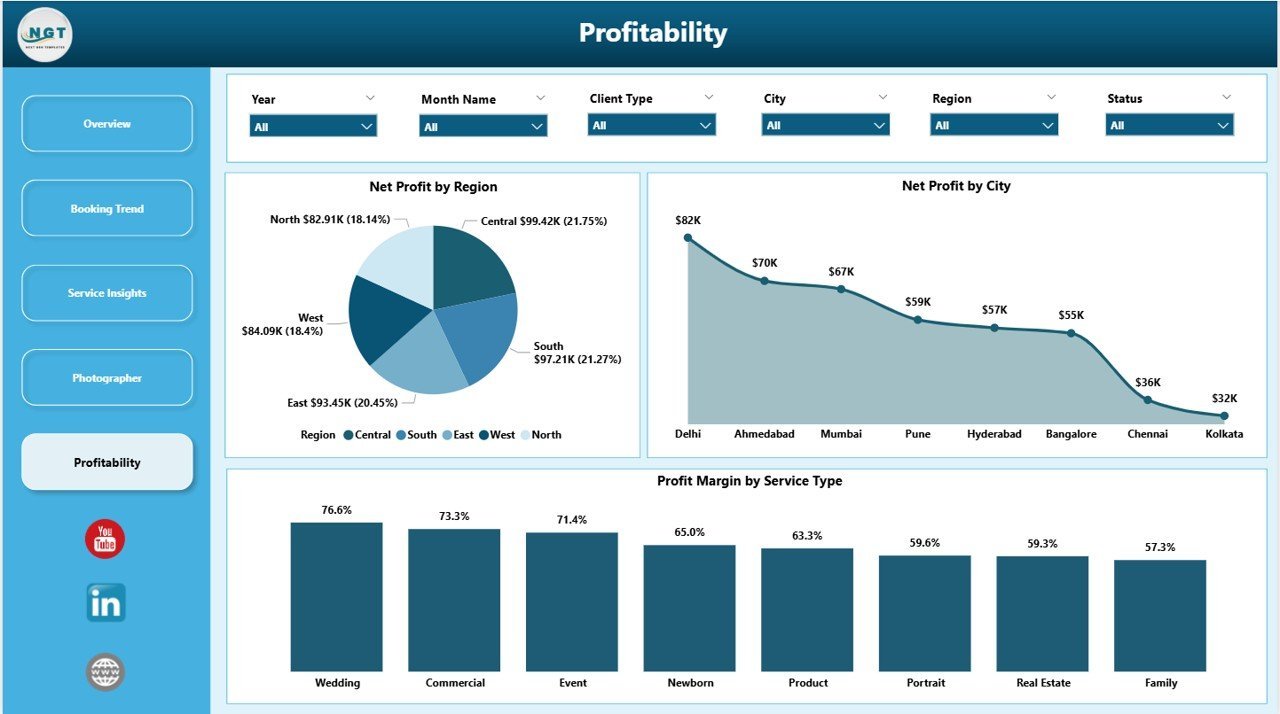
💰 Multi-Dimensional Profitability Analysis — The Profitability page breaks down Net Profit by Region, City, and Service Type, letting you redirect resources toward your highest-margin bookings and deprioritize low-return engagements.
📦 What’s Inside the Photography Business Dashboard in Power BI
The template contains 5 analysis pages built natively in Power BI Desktop (.pixy format), ready to connect to your booking dataset:
📋 Page 1 — Overview: Cancellation Rate, Completion Rate by Booking Channel, Total Revenue by Package Type, and Total Revenue & Total Cost by Month — with 5 KPI summary cards at the top for at-a-glance business health monitoring.
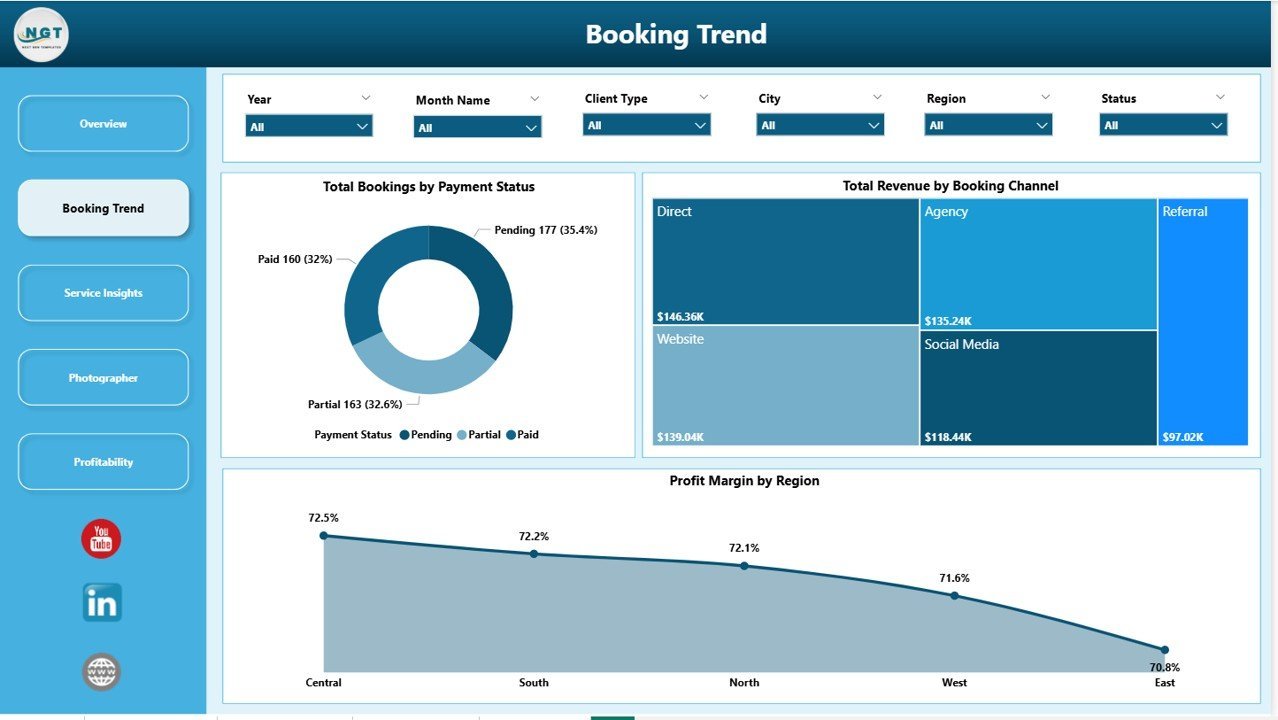
📈 Page 2 — Booking Trend: Total Bookings by Payment Status, Total Revenue by Booking Channel, and Profit Margin by Region — showing which channels and geographies drive the most bookings and the strongest margin.
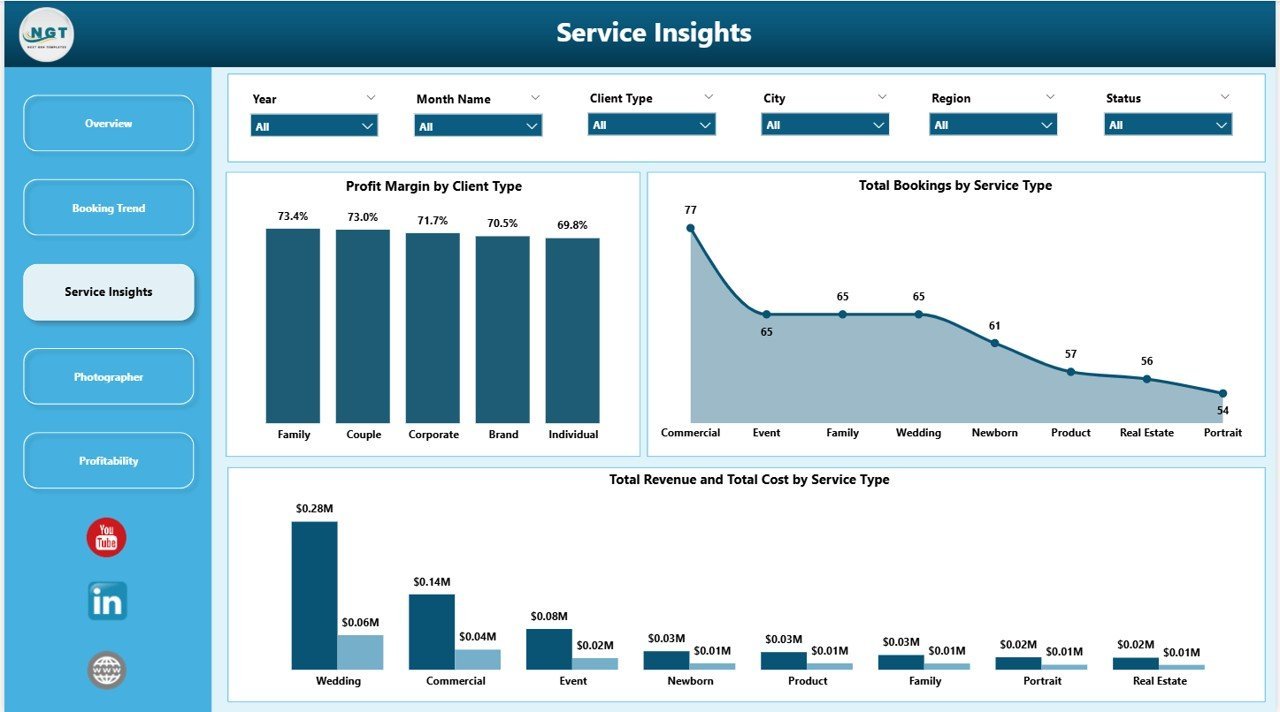
🎞️ Page 3 — Service Insights: Profit Margin by Client Type, Total Bookings by Service Type, and Total Revenue & Cost by Service Type — pinpointing your most profitable service lines and client segments.
🧑💼 Page 4 — Photographer: Cancellation Rate by Package Type, Total Photos Delivered by Photographer, and Revenue per Hour by Photographer — the three benchmarks that separate high-value photographers from underperformers.
🗺️ Page 5 — Profitability: Net Profit by Region, Net Profit by City, and Profit Margin by Service Type — arming you with the location and pricing data to make revenue-driven decisions.
📊 Photography Business Dashboard in Power BI vs. Google Sheets Photography Tracker vs. Studio Ninja — Where This Fits
| Feature | Photography Business Dashboard in Power BI | Google Sheets Photography Tracker | Studio Ninja / Honey Book |
|---|---|---|---|
| Cost | $17.99 one-time ✅ | Free–$15 one-time | $35–$79/month |
| Platform | Power BI Desktop ✅ | Browser (Google Sheets) | Web SaaS |
| Setup time | Under 10 minutes ✅ | 15–30 minutes | 1–2 hours (onboarding) |
| Interactive charts & slicers | 15 charts + dynamic slicers ✅ | Basic charts only | Limited built-in reporting |
| Photographer-level performance | Revenue/hr, photos, cancellations ✅ | Manual entry only | Basic job tracking |
| Profitability by city & region | Included ✅ | Not available | Not available |
| One-time payment | Yes ✅ | Yes | ❌ Monthly subscription |
| Year-1 cost at 5 users | $17.99 ✅ | $0–$50 | $420–$948 |
For photography studios that want professional Power BI analytics without paying hundreds per year in SaaS fees, the Photography Business Dashboard in Power BI sits in the sweet spot.
👥 Who This Template Is For — and Who It’s Not For
✅ This template is built for:
- Photography studio owners managing 2–15 photographers across multiple regions or cities
- Freelance photographers who want to track booking channel performance and profit margin monthly
- Wedding, commercial, portrait, and events photography businesses with regular booking data
- Operations managers who prepare monthly or quarterly photography business performance reports
❌ This template is NOT for:
- Enterprise photography agencies needing CRM + invoicing + accounting in one platform
- Hobbyist photographers with fewer than 10 bookings per month
- Teams requiring real-time multi-user live collaboration (that requires Power BI Service/Pro)
⚙️ How to Use the Photography Business Dashboard in Power BI
- Download the .pixy file from your Nextgen Templates account immediately after purchase.
- Open Power BI Desktop (free download from Microsoft).
- Load your photography booking data into the data source connected to the report.
- Click Refresh — all 5 pages and 15 charts update automatically with your real data.
- Use the slicers on each page to filter by region, photographer, service type, or booking channel.
💼 Real-World Use Cases
Sarah owns a wedding photography studio in Dallas with 4 photographers. She uses the Photographer page to compare Revenue per Hour and satisfaction scores across the team — discovering that one photographer earns 30% more per hour on premium packages. She adjusts scheduling to prioritise that photographer for high-value wedding bookings.
Marcus runs a commercial photography business across three cities. He uses the Profitability page to find that Austin bookings yield 18% higher margins than Houston — driven by corporate clients paying premium rates. He now focuses sales outreach on Austin-based businesses.
Priya manages a portrait studio and reviews the Booking Trend page monthly. She spots that Instagram-sourced bookings have a 22% higher cancellation rate than referral bookings. She shifts ad spend toward client referral incentives and watches her cancellation rate drop within 60 days.
❓ Frequently Asked Questions
What KPIs does the Photography Business Dashboard in Power BI track?
The Photography Business Dashboard in Power BI tracks 5 headline KPIs: Total Bookings, Total Revenue, Total Cost, Net Profit, and Average Satisfaction Score — plus 15 chart-level metrics spanning booking channels, service types, photographer performance, regional profitability, and payment status. All metrics update automatically when data is refreshed.
Do I need Power BI Pro or a paid Microsoft subscription?
No. The Photography Business Dashboard in Power BI runs entirely in Power BI Desktop, which is free to download from Microsoft. A Power BI Pro or Premium subscription is only required if you want to publish and share the report online via Power BI Service. Desktop-only use is completely free.
How does this compare to Studio Ninja or HoneyBook?
Studio Ninja and HoneyBook cost $35–$79/month and focus on CRM, contracts, and invoicing. The Photography Business Dashboard in Power BI is a one-time $17.99 analytics tool providing booking performance, photographer benchmarking, and profitability insights that those platforms do not offer natively — at a fraction of the annual cost.
Can I add my own photographers, regions, and service types?
Yes. Because the dashboard reads directly from a data source you control, you replace sample entries with your real photographer names, cities, booking channels, and service types. All 15 charts and slicers reflect your customised data automatically after one click of Refresh.
How long does initial setup take?
Setup takes under 10 minutes. Download the .pbix file, open it in Power BI Desktop, connect it to your booking dataset, and click Refresh. The entire 5-page dashboard populates with your data — no Power BI development skills or DAX formula knowledge required.
Does this work for wedding, commercial, and portrait photography?
Yes. The Photography Business Dashboard in Power BI is designed for any booking-based photography business — wedding, commercial, portrait, events, or newborn. The Service Type and Client Type dimensions let you segment and analyse whichever categories your studio uses.
👤 About the Author
Built by PK — Microsoft Certified Professional with 15+ years of Excel, Google Sheets, and Power BI experience. Founder of NextGenTemplates, reaching 300K+ subscribers across YouTube channels (@PK-AnExcelExpert, @NextGenTemplates, @NeoTechNavigators). Every template is hand-built and tested before release.
🔗 Explore Related Templates
Explore our full Power BI Dashboard Templates collection or these related products:
📸 Photography Business Dashboard in Excel — The same 5-page analysis built natively in Excel with pivot tables and slicers. No Power BI required.
🖨️ Print Shop Dashboard in Power BI — Creative service business analytics covering job revenue, cost, and turnaround time in Power BI.
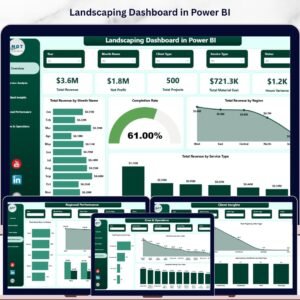
🌿 Landscaping Dashboard in Power BI — Service business performance tracking for landscaping companies with revenue by region and crew efficiency metrics.
📖 Click here to read the Detailed Blog Post
🎥 Visit our YouTube channel for step-by-step video tutorials
👉 YouTube.com/@NextGenTemplates
📅 Last updated: May 2026
Watch the step-by-step video tutorial:
YouTube


Reviews
There are no reviews yet.