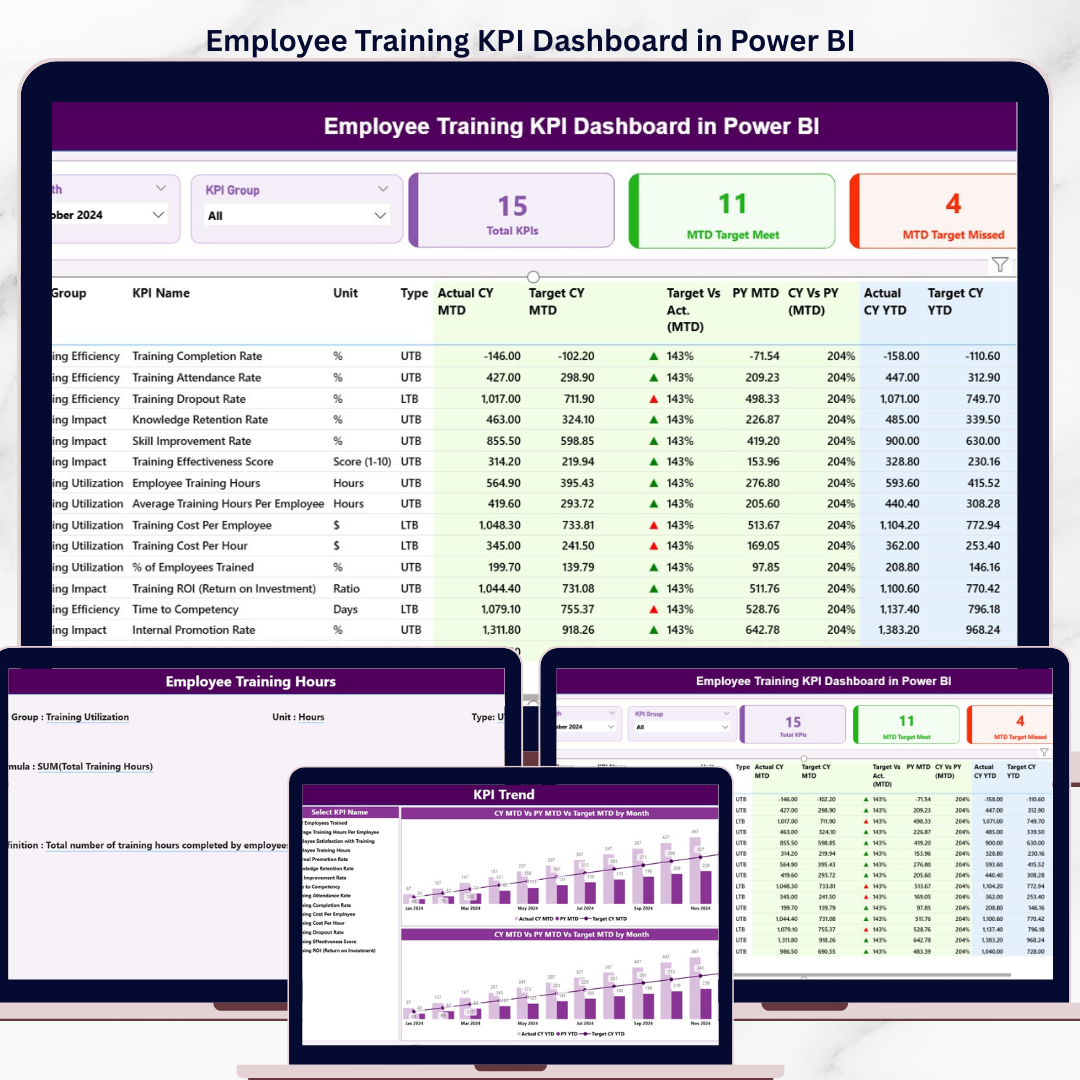
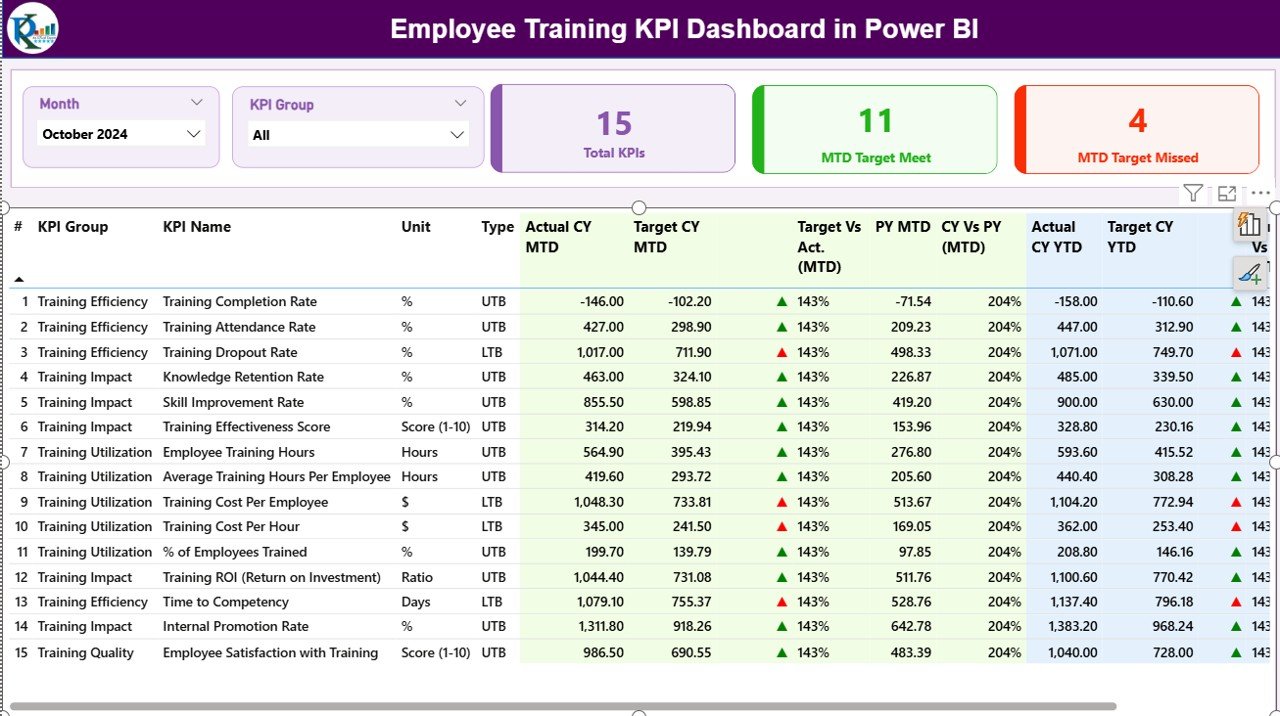
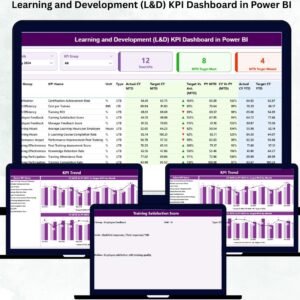
The Employee Training KPI Dashboard in Power BI tracks learning KPIs across 3 interactive pages — a Summary Page with Month and KPI Group slicers, a KPI Trend Page with two combo charts comparing CY Actual, PY Actual, and Target for both MTD and YTD views, and a hidden KPI Definition drill-through page. The Summary table delivers 16 columns of insight per KPI: KPI Number, Group, Name, Unit, Type (LTB/UTB), Actual CY MTD, Target CY MTD, MTD Icon (▲/▼ red/green), Target vs Actual (MTD), PY MTD, CY vs PY (MTD), and the matching YTD set. Setup takes under 10 minutes — fill the three Excel input sheets (Input_Actual, Input_Target, KPI Definition) and refresh.
🌍 Join 8,400+ teams in 40+ countries using NextGenTemplates to replace paid SaaS tools with one-time-purchase Excel, Google Sheets, Power BI, and HTML templates.
✅ Instant download · One-time payment · No subscription · No per-user fees · Lifetime access
Employee Training KPI Dashboard in Power BI — Summary Page
🔑 Key Features of the Employee Training KPI Dashboard in Power BI
📊 Three connected Power BI pages – Summary, KPI Trend, and KPI Definition (drill-through hidden page) covering every angle of learning performance, from snapshot metrics to long-term trend analysis to formula-level KPI documentation.
🎚️ Month and KPI Group slicers – Two top-of-page slicers on the Summary Page let HR and L&D managers filter by reporting month and KPI category instantly, refreshing every card and the detail table in real time.
🟢 Three KPI status cards – Total KPI Count, MTD Target Met Count, and MTD Target Missed Count give leadership a 5-second pulse on training health every time the file opens.
📈 16-column detailed KPI table – KPI Number, Group, Name, Unit, Type (LTB/UTB), Actual CY MTD, Target CY MTD, MTD Icon, Target vs Act. (MTD), PY MTD, CY vs PY (MTD), Actual CY YTD, Target CY YTD, YTD Icon, Target vs Act. (YTD), PY YTD, and CY vs PY (YTD) — every row tells the full performance story for one KPI.
🔺🔻 Color-coded MTD and YTD icons – Green ▲ and red ▼ markers automatically flag whether each KPI hit or missed its target, working correctly for both LTB (Lower the Better) and UTB (Upper the Better) metric types.
📉 KPI Trend Page with two combo charts – A KPI slicer on the left lets you focus on any single training metric, then the two combo charts plot Actual CY, Actual PY, and Target side-by-side for MTD and YTD across all months.
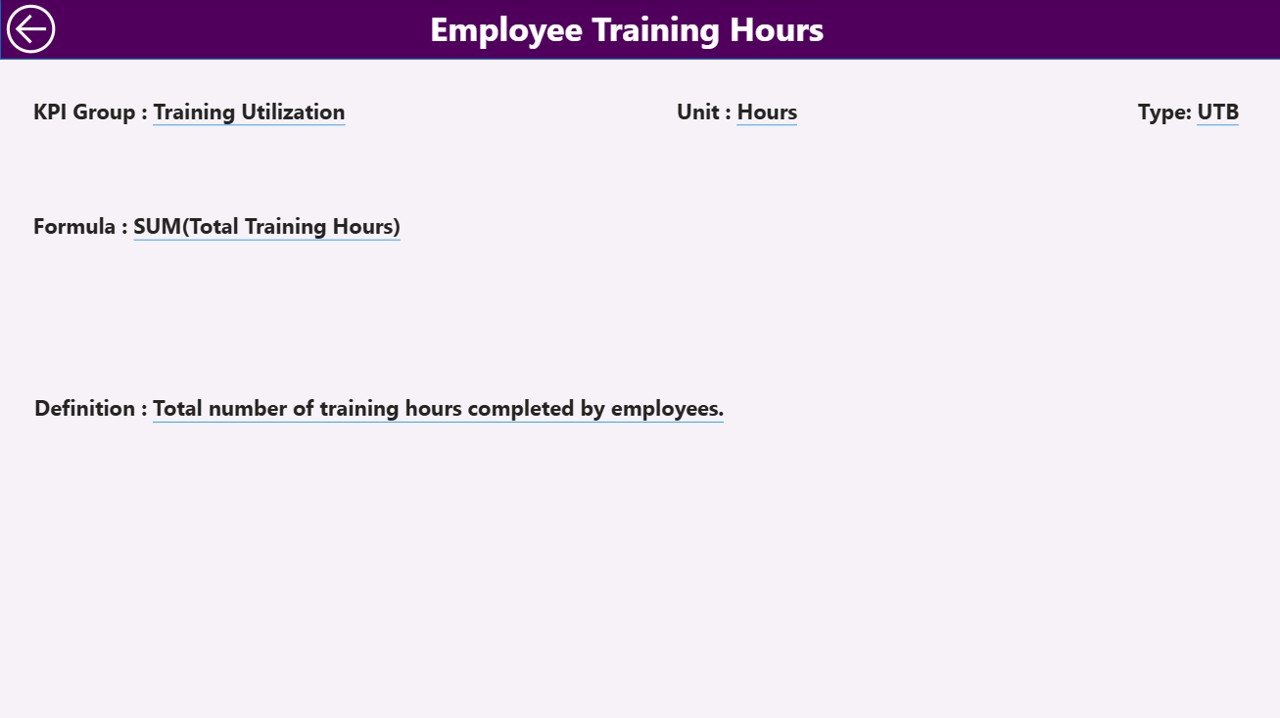
📘 Hidden KPI Definition drill-through page – Right-click any row in the Summary table and drill through to see KPI Number, Group, Name, Unit, Formula, Definition, and Type. A back button returns you to the Summary in one click.
📂 Excel-driven data source – Three structured input sheets (Input_Actual, Input_Target, KPI Definition) drive the entire dashboard. Update the Excel file, click Refresh in Power BI Desktop, and every visual updates automatically.
📦 What’s Inside the Employee Training KPI Dashboard in Power BI
Your download includes the complete Power BI desktop file (.pbix) and the linked Excel data source workbook.
1️⃣ Summary Page — KPI Performance Snapshot
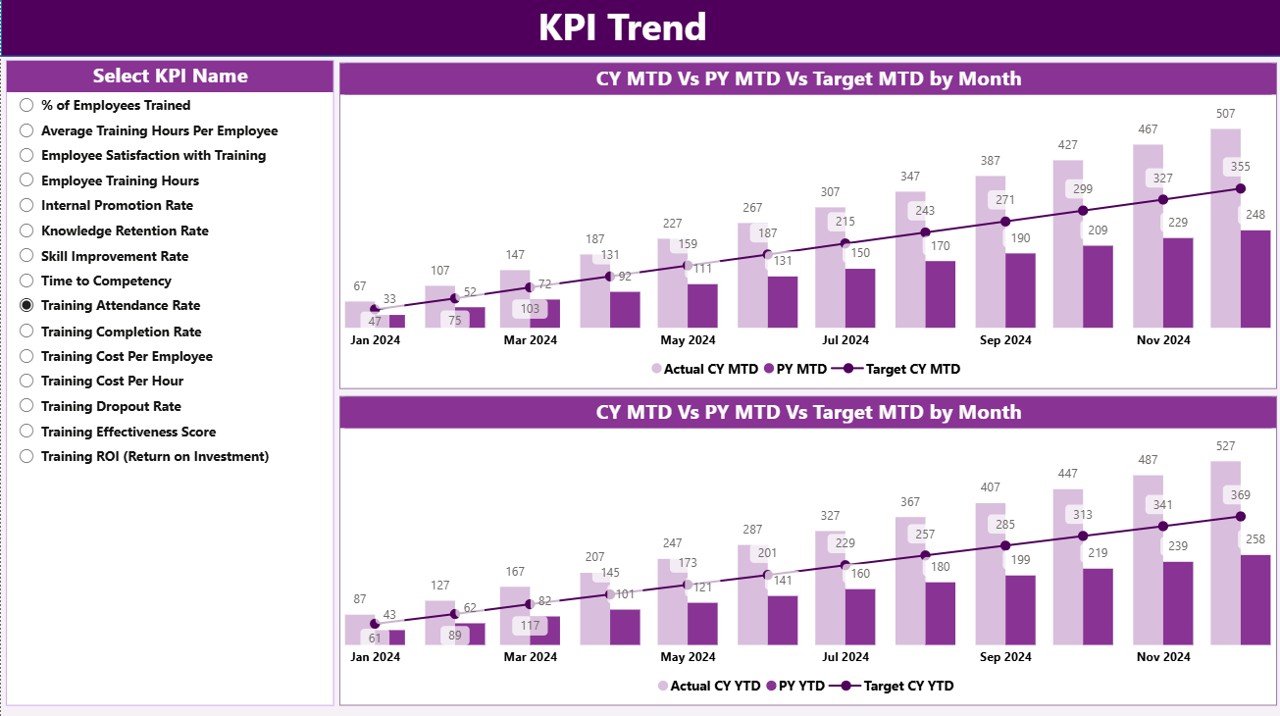
Employee Training KPI Dashboard — KPI Trend Page
The main page features Month and KPI Group slicers at the top, three status cards (Total KPIs, MTD Target Met, MTD Target Missed), and a detailed 16-column table showing CY MTD, Target MTD, MTD Icon, Target vs Actual, PY MTD, CY vs PY %, plus the matching YTD columns for every training KPI you track.
2️⃣ KPI Trend Page — Monthly & YTD Patterns
A KPI Name slicer on the left, plus two combo charts that overlay Current Year Actuals, Previous Year Actuals, and Target lines for MTD and YTD respectively. Spot seasonality, year-on-year improvement, and target gaps at a glance.
3️⃣ KPI Definition Page — Drill-Through KPI Details
Employee Training KPI Dashboard — KPI Definition Page
A hidden drill-through page accessed by right-clicking a KPI row on the Summary. Shows KPI Number, Group, Name, Unit, Formula, Definition, and Type. Useful for training new HR analysts and audit reviews.
📥 Excel Data Source (3 sheets)
🟦 Input_Actual – KPI Name, Month (first day of month), MTD Actual, YTD Actual
🟦 Input_Target – KPI Name, Month, MTD Target, YTD Target
🟦 KPI Definition – KPI Number, Group, Name, Unit, Formula, Definition, Type (LTB/UTB)
📊 Employee Training KPI Dashboard vs. Tableau Alternative vs. Cornerstone / BambooHR — Where This Fits
| Feature | Employee Training KPI Dashboard (Power BI) | Tableau / Qlik HR Dashboard | Cornerstone LMS / BambooHR |
|---|---|---|---|
| Cost | ✅ $11.99 one-time | $70 / user / month | $6–$15 / user / month + LMS fees |
| Platform | ✅ Power BI Desktop (free) | Tableau Desktop / Qlik Sense (paid) | Web SaaS (vendor-hosted) |
| Setup time | ✅ Under 10 minutes | 1–2 weeks of build time | 4–12 weeks implementation |
| MTD vs YTD vs PY comparison | ✅ Built-in (16 columns) | Custom build required | Limited; depends on tier |
| LTB / UTB icon logic | ✅ Pre-built ▲▼ red/green | Manual DAX / calc fields | Not configurable |
| KPI Definition drill-through | ✅ Built-in | Custom build | External documentation only |
| Year-1 cost at 5 users | ✅ $11.99 total | $4,200 / year | $360–$900 + setup fees |
| Customizable KPIs | ✅ Edit Excel KPI Definition sheet | Edit calculated fields | Vendor-defined catalog |
| Lifetime access | ✅ Yes | Subscription-only | Subscription-only |
For HR and L&D teams that want MTD/YTD/PY training analytics with target tracking — without paying $70/user/month for Tableau or committing to a multi-year LMS contract — the Employee Training KPI Dashboard sits in the sweet spot.
👥 Who This Template Is For — and Who It’s Not For
✅ This template is built for:
- HR and L&D managers at 20–500 person companies who need monthly training performance reports for leadership
- Corporate training coordinators tracking course completion, certification rates, and trainer effectiveness across departments
- People analytics analysts using Power BI Desktop who want a tested KPI framework with MTD, YTD, and prior-year comparisons
- Consultants delivering L&D analytics to multiple clients who need a portable, white-label-ready Power BI file
- HR business partners reporting to executives who require professional, audit-ready training scorecards each month
❌ This template is NOT for:
- Enterprise HR teams (5,000+ employees) needing SOC 2 compliance, SSO, or row-level security with Active Directory
- Teams that need an LMS — this is a reporting layer that sits on top of LMS data, not a course delivery platform
- Real-time live-data dashboards — this dashboard refreshes when you update the Excel file, not on a streaming schedule
⚙️ How to Use the Employee Training KPI Dashboard in Power BI
1️⃣ Download the .zip and extract both the .pbix file and the Excel data workbook
2️⃣ Open the Excel file and fill the Input_Actual sheet with KPI Name, Month (first day of month), MTD, and YTD actual values
3️⃣ Fill the Input_Target sheet with KPI Name, Month, MTD Target, and YTD Target values
4️⃣ Update the KPI Definition sheet with KPI Number, Group, Name, Unit, Formula, Definition, and Type (LTB or UTB)
5️⃣ Open the .pbix file in Power BI Desktop and click Refresh — every visual updates automatically
6️⃣ Use the Month and KPI Group slicers on the Summary Page to filter, then right-click any KPI row to drill through to the KPI Definition Page
💼 Real-World Use Cases
Priya runs L&D for a 180-person SaaS company in Bengaluru. Every month she pulls completion rates, average training hours, certification renewals, and trainer satisfaction scores from her LMS export, drops them into the Excel input sheets, and presents a polished MTD vs YTD vs Previous Year scorecard to the CHRO — without paying ₹15,000/month for a paid Tableau license.
James is the HR Business Partner for the manufacturing division of a mid-sized industrial firm. He uses the Employee Training KPI Dashboard to track safety training compliance, induction completion within 30 days, and skill certification renewals across 7 plants. The CY vs PY columns give him a clear narrative for the quarterly board pack.
Maria is an independent L&D consultant serving 6 client companies. She delivers each client a customized .pbix using this template, mapping their specific training KPIs to the Input sheets. The drill-through KPI Definition page doubles as audit documentation — saving her 8–10 hours per client per quarter.
❓ Frequently Asked Questions
What KPIs does the Employee Training KPI Dashboard track?
The Employee Training KPI Dashboard tracks any L&D metric you define in the KPI Definition sheet — common examples include training completion rate, average learning hours per employee, certification rate, trainer satisfaction score, training cost per employee, and skills gap closure. Both LTB (Lower the Better) and UTB (Upper the Better) metric types are supported with automatic ▲▼ red/green icon logic.
How long does setup take?
Under 10 minutes for first-time setup. Open the Excel data file, paste your training KPI values into the Input_Actual, Input_Target, and KPI Definition sheets, then open the .pbix file in Power BI Desktop and click Refresh. The Employee Training KPI Dashboard auto-builds the Summary, KPI Trend, and KPI Definition pages.
How does this compare to Cornerstone LMS or BambooHR reporting?
Cornerstone LMS and BambooHR are full HRIS platforms costing $6–$15 per user per month with vendor-defined reports. The Employee Training KPI Dashboard in Power BI is $11.99 one-time, fully customizable, and lets you define your own KPIs, formulas, and LTB/UTB types — making it ideal as a reporting layer that sits on top of any LMS data export.
Do I need advanced Power BI skills to use this dashboard?
No. Basic Power BI Desktop knowledge is enough. All visuals, slicers, and drill-through interactions are pre-built. You only edit the linked Excel file to update data — no DAX writing, no data modeling, and no Power Query work is required to use the Employee Training KPI Dashboard in Power BI.
Can I add or change KPIs in the dashboard?
Yes. Add any new KPI Name to the KPI Definition, Input_Actual, and Input_Target sheets in the Excel file. Refresh the .pbix file and the new KPI appears automatically in the Summary table, KPI Group slicer, and KPI Name slicer on the Trend Page — no Power BI editing required.
Does the dashboard work on Power BI Service (cloud) or only Desktop?
The Employee Training KPI Dashboard is built in Power BI Desktop (free from Microsoft). You can publish the .pbix to Power BI Service for cloud sharing — just configure a scheduled refresh against the Excel file in OneDrive or SharePoint.
Is the dashboard a one-time purchase or subscription?
One-time payment of $11.99. You receive the Power BI .pbix file and Excel data source via instant download with lifetime access — no per-user fees, no monthly subscription, and no renewal required. This is a key advantage over paid SaaS HR analytics tools.
👤 About the Author
Built by PK — Microsoft Certified Professional with 15+ years of Excel, Google Sheets, and Power BI experience. Founder of NextGenTemplates, reaching 300K+ subscribers across YouTube channels (@PK-AnExcelExpert, @NextGenTemplates, @NeoTechNavigators). Every template is hand-built and tested before release.
🔗 Explore Related Templates
📘 Learning and Development (L&D) KPI Dashboard in Power BI — broader L&D KPI coverage with the same 3-page structure.
📗 Learning and Development (L&D) KPI Dashboard in Excel — same KPI framework in pure Excel, no Power BI required.
📙 Productivity Tracker KPI Dashboard in Power BI — extend training analytics with downstream productivity tracking.
📕 Browse all Power BI KPI Dashboards · 📒 Power BI Templates
📖 Click here to read the Detailed Blog Post
🎥 Visit our YouTube channel for step-by-step video tutorials
👉 YouTube.com/@NextGenTemplates
📅 Last updated: May 2026


Reviews
There are no reviews yet.