

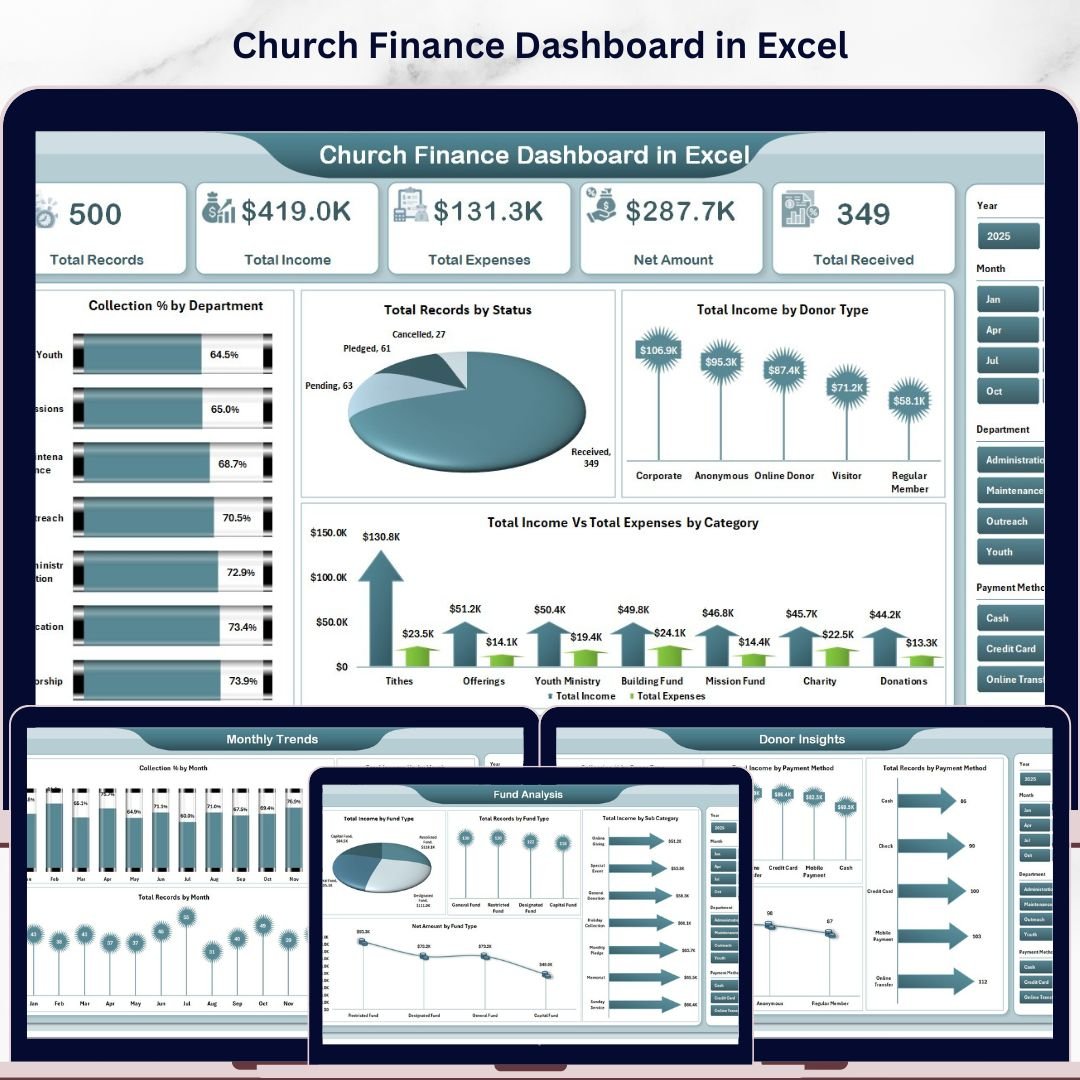

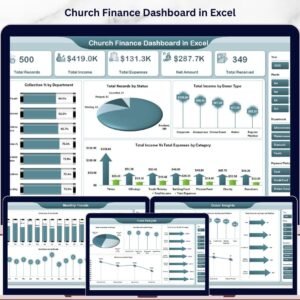
Church Finance Dashboard in Excel is a powerful, ready-to-use Excel template designed to help churches, ministries, and faith-based organizations manage their financial operations with clarity and confidence. Whether you are tracking tithes, offerings, departmental expenses, donor contributions, or monthly income trends, this dashboard brings everything together into one clean, interactive, and visually rich Excel file. It includes 5 interactive dashboard pages, a data entry sheet, and a support sheet with dynamic pivot tables that auto-refresh your entire dashboard in seconds. This Excel Dashboard Template is built for church administrators, pastors, finance committees, and nonprofit treasurers who need a clear financial picture without any complex software.
🔑 Key Features of Church Finance Dashboard in Excel
📌 5 Interactive Dashboard Pages – Overview, Fund Analysis, Department Tracking, Donor Insights, and Monthly Trends give you a 360-degree view of church finances.
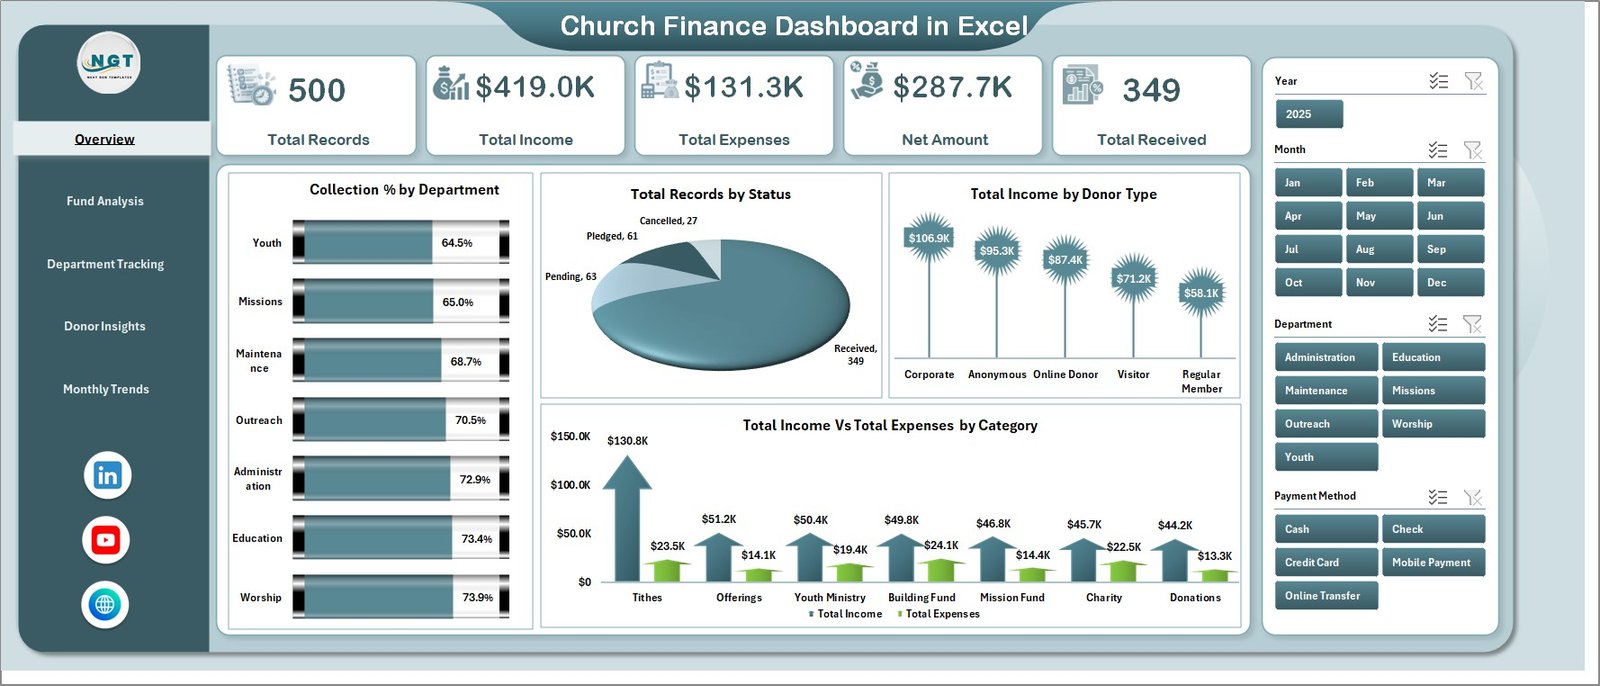
📌 Dynamic KPI Cards – High-level summary cards display Total Records, Total Income, Total Expenses, Net Amount, and Total Received at a glance on the Overview page.
📌 Multiple Chart Types – Each page presents targeted analysis through visually engaging charts that update automatically when data changes.
📌 Slicer-Based Filtering – Apply quick filters on the Overview page to slice data by category, status, fund type, or department for instant insights.
📌 Pivot-Powered Backend – The Support sheet contains all pivot tables that drive the dashboard dynamically. Just refresh data and the entire dashboard updates.
📌 Easy Data Entry – Enter your financial records in the structured Data sheet and the dashboard does the rest. No formulas to edit, no macros required.
📌 Professional Design – Clean layout with organized navigation for easy switching between dashboard pages.
📦 What’s Inside the Church Finance Dashboard in Excel
This template includes 7 sheet tabs organized for complete church financial management:
✨ Overview Page – Displays 5 KPI cards (Total Records, Total Income, Total Expenses, Net Amount, Total Received) and 4 analytical charts: Collection % by Department, Total Records by Status, Total Income by Donor Type, and Total Income Vs Total Expenses by Category. Multiple slicers let you filter and explore the data instantly.
 Church Finance Dashboard in Excel
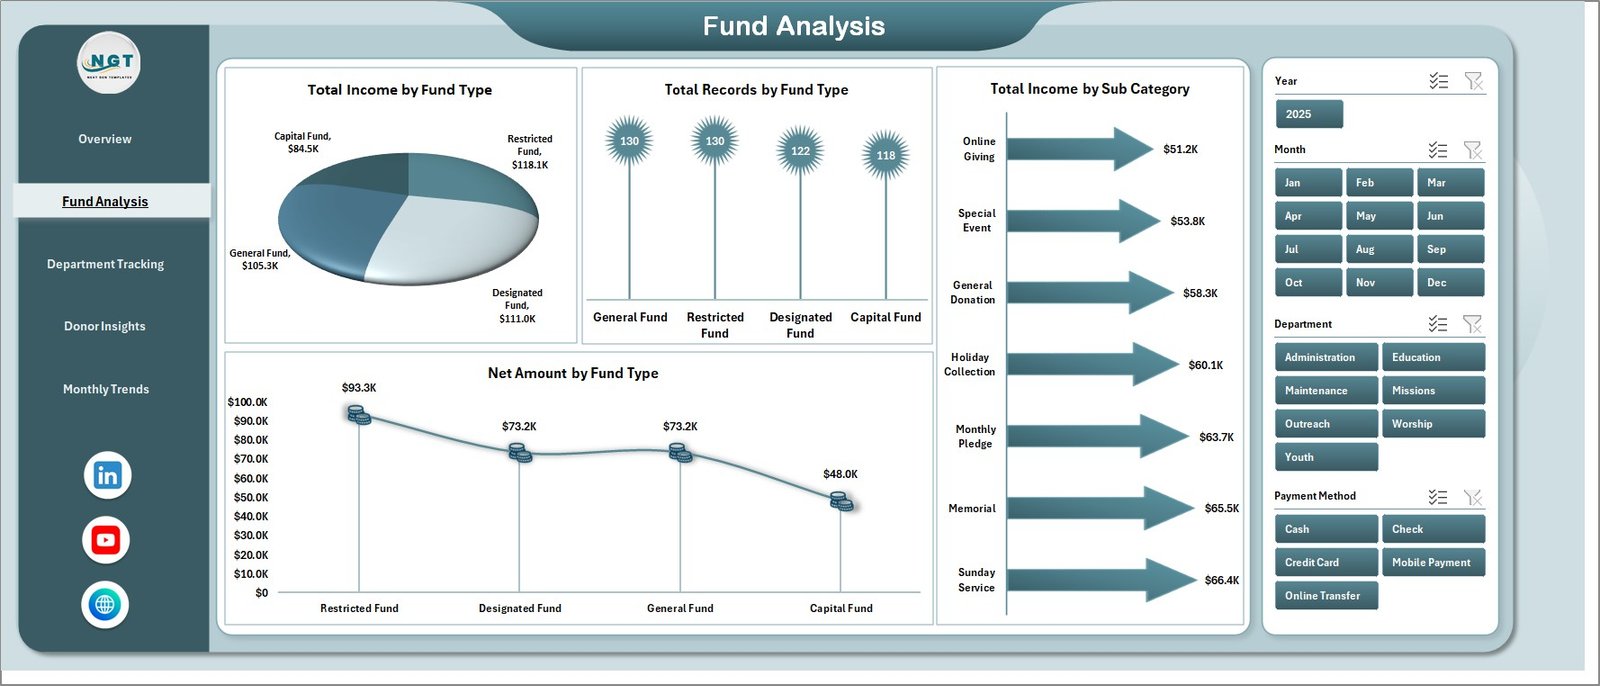
✨ Fund Analysis Page – Breaks down financial data by fund type with 4 charts: Total Income by Fund Type, Total Records by Fund Type, Total Income by Sub Category, and Net Amount by Fund Type. This page helps church treasurers understand where funds are coming from and how they are distributed across different fund categories.
 Fund Analysis Page
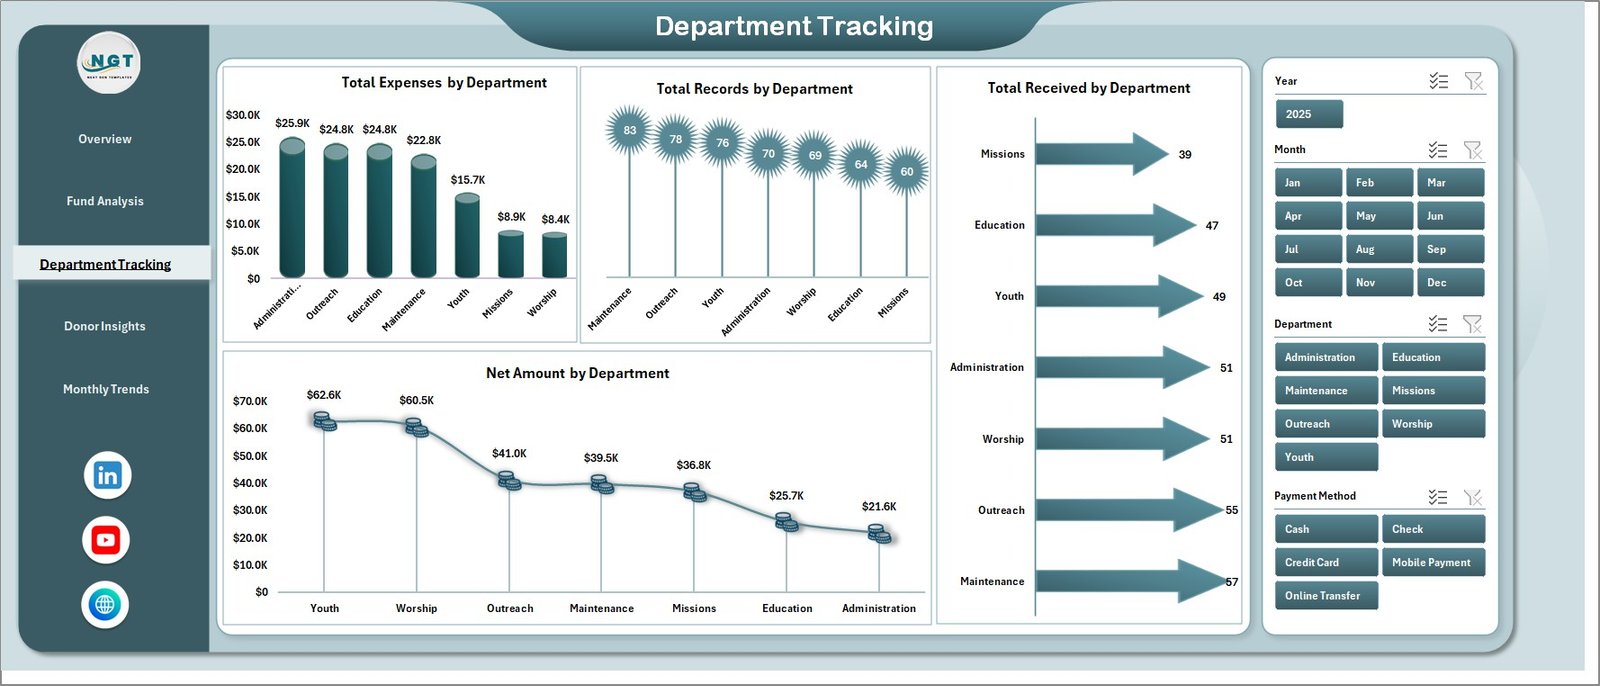
✨ Department Tracking Page – Provides departmental financial visibility through 4 charts: Total Expenses by Department, Total Records by Department, Total Received by Department, and Net Amount by Department. Identify which departments are spending the most and which are generating the highest collections.
 Department Tracking Page
✨ Donor Insights Page – Analyzes donor behavior and payment methods with 4 charts: Collection % by Donor Type, Total Income by Payment Method, Total Records by Payment Method, and Total Records by Donor Type. Understand who your top donors are and which payment channels they prefer.
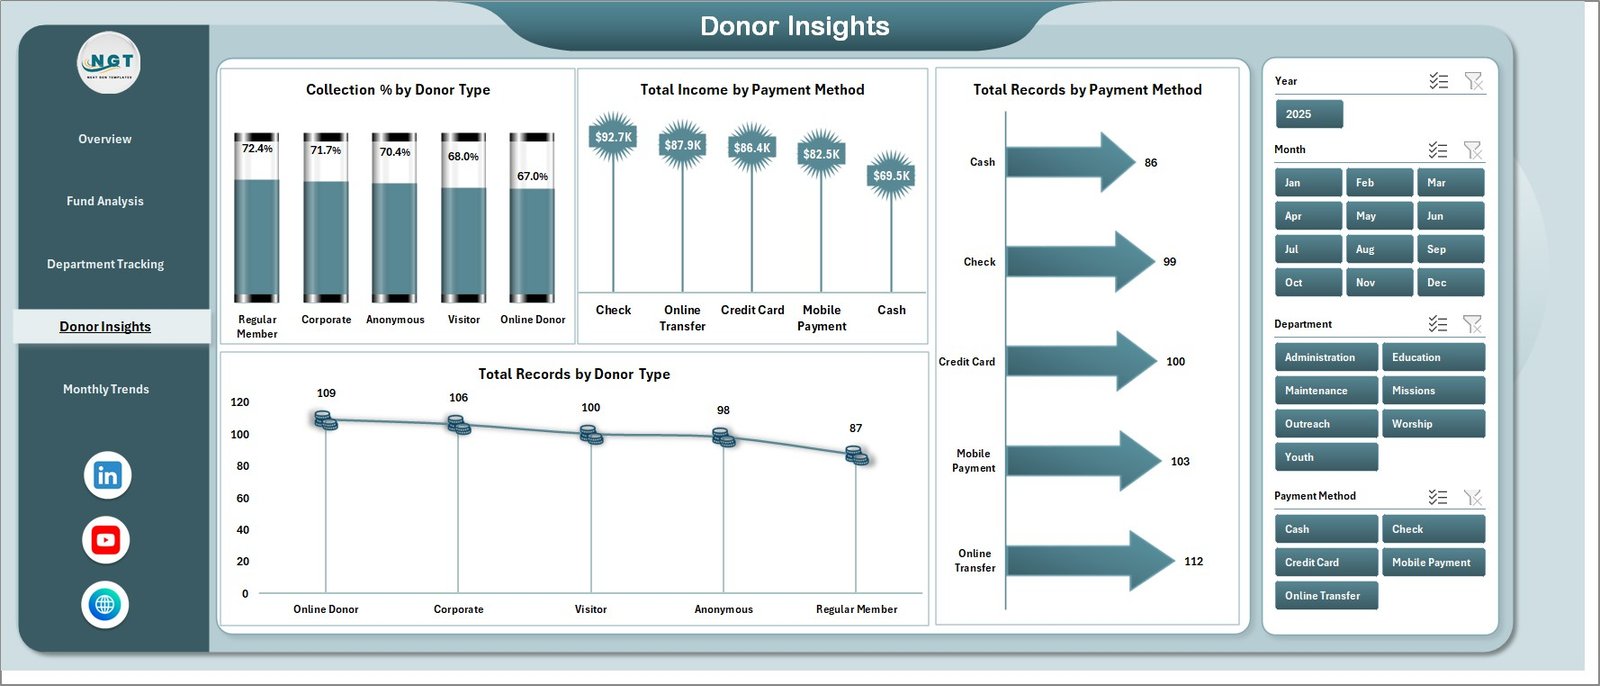 Donor Insights Page
✨ Monthly Trends Page – Tracks time-based financial patterns through 3 charts: Collection % by Month, Total Income by Month, and Total Records by Month. Spot seasonal giving trends and plan budgets accordingly.
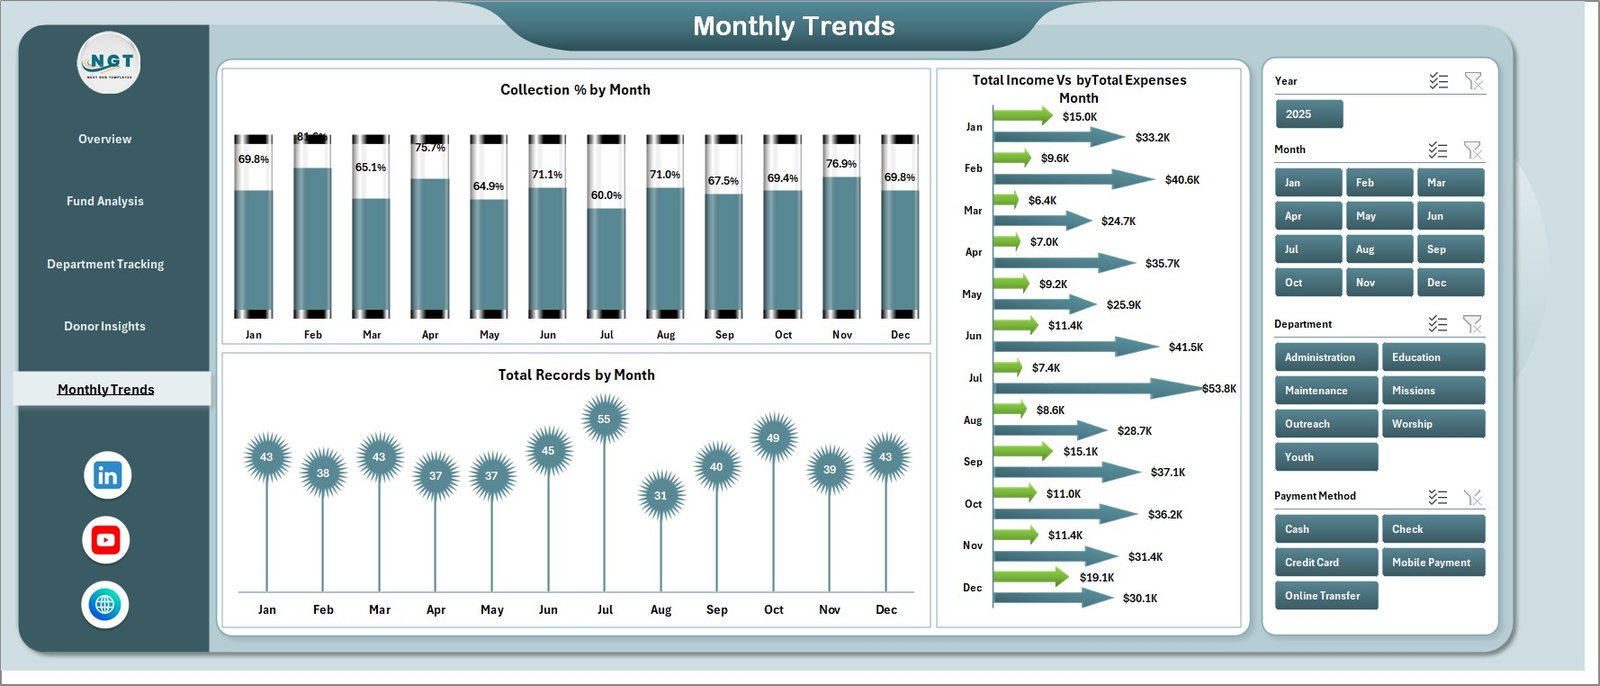 Monthly Trends Page
✨ Data Sheet – This is where you enter all your financial records. Follow the existing column structure and add your own church data in the same format.
 Data Sheet Tab
✨ Support Sheet – Contains multiple pivot tables that power all dashboard charts dynamically. After updating data, go to Data tab in Excel Ribbon and click Refresh All. All pivots and charts will update instantly. You can keep this sheet hidden for a cleaner user experience.
 Support Sheet Tab
⚙️ How to Use the Church Finance Dashboard in Excel
1️⃣ Open the Excel file – Download and open the Church Finance Dashboard in Microsoft Excel (2016 or later recommended).
2️⃣ Go to the Data Sheet – Enter your church financial records including income, expenses, donor details, departments, fund types, and payment methods.
3️⃣ Refresh the Dashboard – Navigate to the Data tab in Excel Ribbon and click Refresh All. Every pivot table, chart, and KPI card updates automatically.
4️⃣ Use Slicers to Filter – On the Overview page, use the slicers to filter by department, status, category, or donor type for targeted insights.
5️⃣ Navigate Between Pages – Switch between Overview, Fund Analysis, Department Tracking, Donor Insights, and Monthly Trends to explore different angles of your church finances.
👥 Who Can Benefit from This Church Finance Dashboard in Excel
⛪ Church Pastors and Leaders – Get a clear financial picture of your ministry’s income and expenses without relying on spreadsheet experts.
💰 Church Finance Committees – Present transparent, data-backed financial reports to your congregation and board members.
📋 Church Treasurers and Bookkeepers – Track every tithe, offering, and expense in a structured, organized dashboard.
🏛️ Nonprofit Faith-Based Organizations – Monitor donations, grants, and program expenses across multiple departments and fund types.
📊 Ministry Department Heads – Understand your department’s financial performance and make data-driven budget requests.
Also explore our Religious & Faith-Based Organizations KPI Dashboard in Power BI and Nonprofit Fundraising Dashboard in Excel for related templates. Browse all our Finance Dashboard Templates for more options.
❓ Frequently Asked Questions
What does the Church Finance Dashboard in Excel track?
The Church Finance Dashboard in Excel tracks 5 key metrics — Total Records, Total Income, Total Expenses, Net Amount, and Total Received. It includes 5 dashboard pages covering fund analysis, department tracking, donor insights, and monthly trends with 19 analytical charts total.
Do I need advanced Excel skills to use this church finance template?
No. Simply enter your data in the Data sheet and click Refresh All under the Data tab. All charts, KPI cards, and pivot tables update automatically. No formulas to edit and no macros needed.
Can I customize this dashboard for my church’s specific departments?
Yes. You can modify the department names, fund types, donor categories, and other fields in the Data sheet. The pivot tables and charts will adapt automatically when you refresh.
What is the best Excel template for tracking church donations and expenses?
The Church Finance Dashboard in Excel from NextGenTemplates is one of the best options. It provides a complete view of income, expenses, donors, departments, and monthly trends in a single interactive Excel file with 5 dashboard pages and dynamic pivot charts.
How do I update the dashboard after adding new data?
After entering new records in the Data sheet, go to the Data tab in the Excel Ribbon and click Refresh All. This refreshes all pivot tables on the Support sheet, which in turn updates every chart and KPI card across all 5 dashboard pages.
Is this template suitable for small churches?
Absolutely. Whether you run a small community church or a large multi-department ministry, this dashboard scales to fit your needs. The slicer-based filtering makes it easy to focus on the specific data that matters to your organization.
🔗 Explore Related Templates
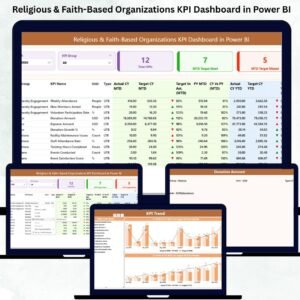
📌 Religious & Faith-Based Organizations Dashboard in Power BI – Advanced Power BI analytics for faith organizations.
📌 Nonprofit Fundraising Dashboard in Excel – Track fundraising campaigns, donor contributions, and grant allocations.
📌 Personal Finance Dashboard in Excel – Manage personal budgets, savings, and expense tracking.
📖 Click here to read the Detailed Blog Post
🎥 Visit our YouTube channel to learn step-by-step video tutorials
👉 YouTube.com/@NextGenTemplates
Watch the step-by-step video tutorial:
YouTube


























Reviews
There are no reviews yet.