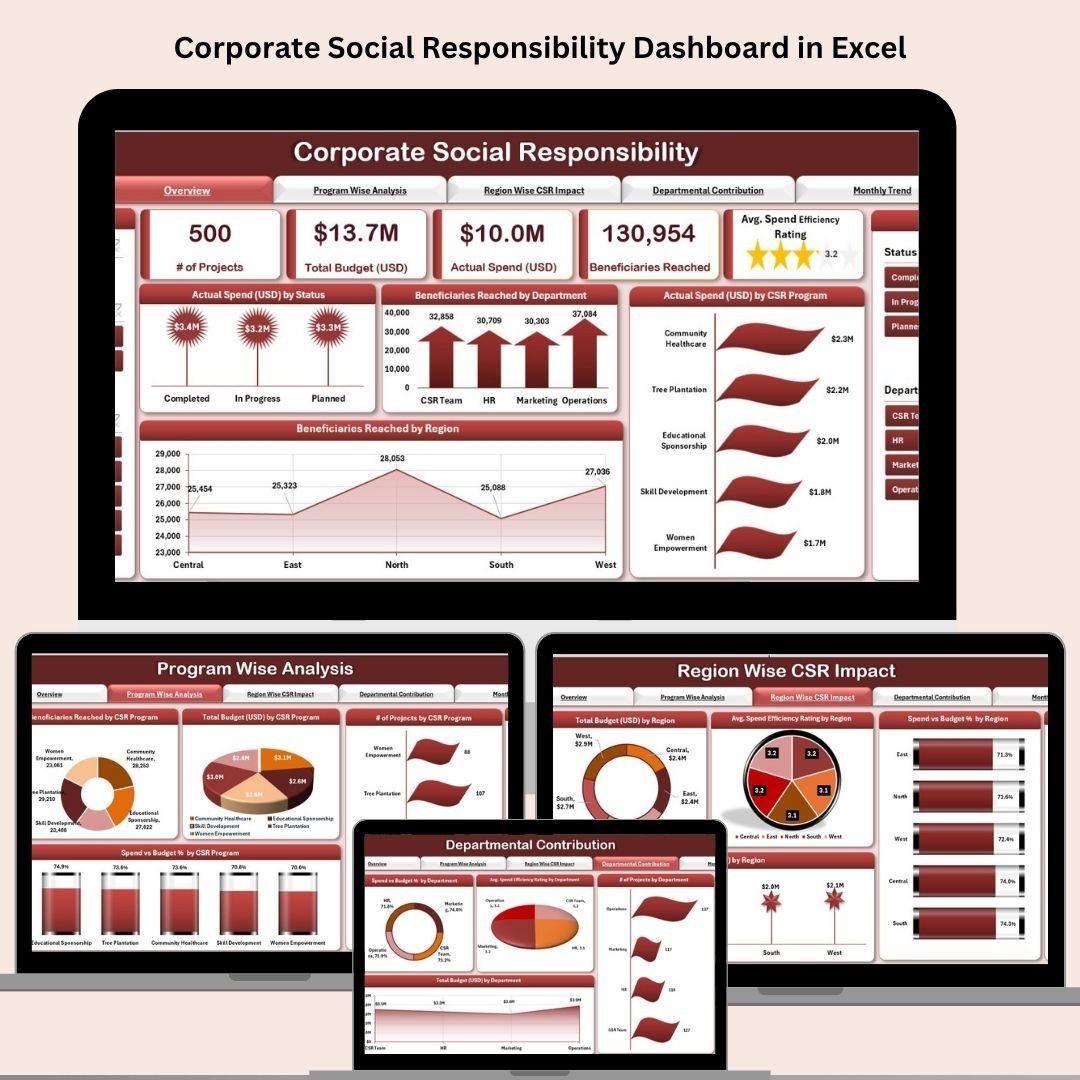


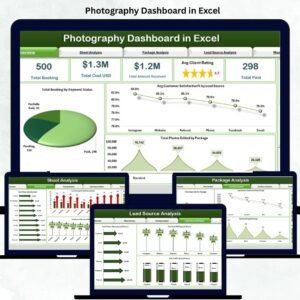
Ready to showcase your social impact like never before? The Corporate Social Responsibility Dashboard in Excel is a ready-to-use, interactive template designed for organizations that want to monitor, analyze, and present their CSR efforts with complete transparency—all within the simplicity of Microsoft Excel.
With 5 dynamic pages, smart slicers, auto-updating pivot charts, and KPI-driven cards, this dashboard helps you track your budget, beneficiaries, programs, and departmental performance effortlessly. 🎯
✨ Key Features of Corporate Social Responsibility Dashboard in Excel
📍 Page Navigator
Jump across all key areas—Overview, Program-Wise, Region-Wise, Departmental, and Monthly Trends—instantly with the top navigation menu.
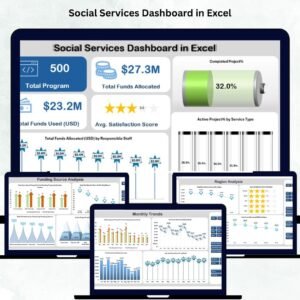
🎯 KPI Cards
Real-time updates for:
-
Total Budget
-
Actual Spend
-
Beneficiaries Reached
-
Projects Completed
-
Spend Efficiency Rating
📊 Interactive Charts
Get automatic visual insights with:
-
Doughnut Charts (Spend by Status)
-
Pie Charts (Reach by Department)
-
Bar & Column Charts (Region, Program, Department)
-
Line Charts (Trends over Time)
🔎 Slicers & Filters
Easily slice your data by:
-
CSR Program
-
Department
-
Region
-
Month & Year
📈 Pivot Table Driven
Everything is powered by clean, efficient pivot tables—no manual chart creation needed.
📦 What’s Inside the CSR Dashboard
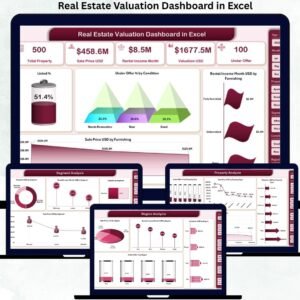
1️⃣ Overview Page
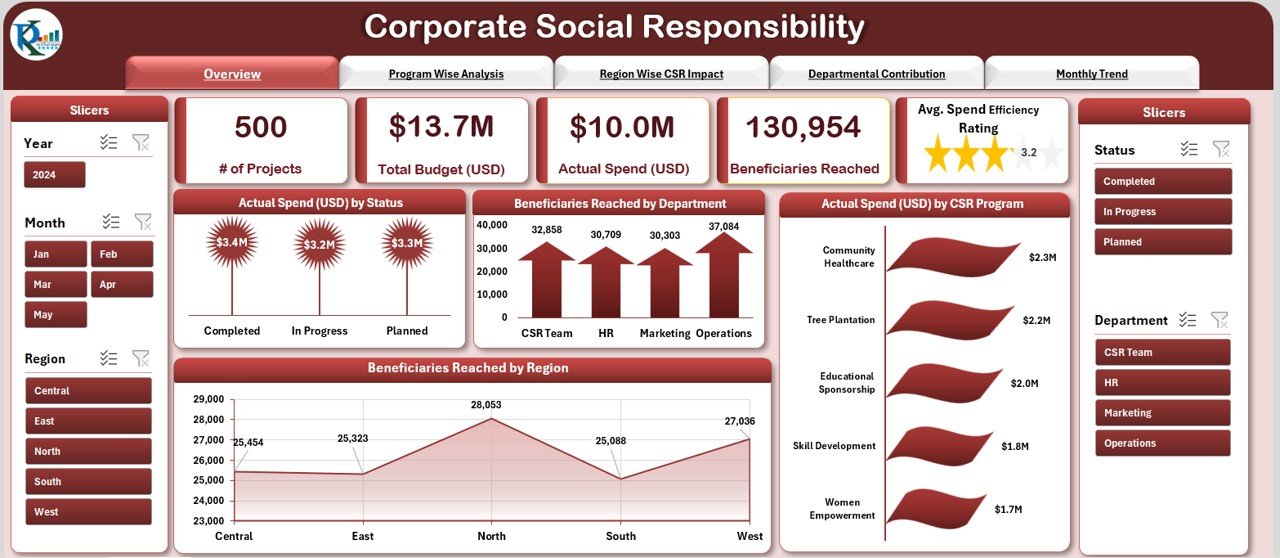
Bird’s-eye view of CSR impact: spending, project status, and outreach across departments and regions.
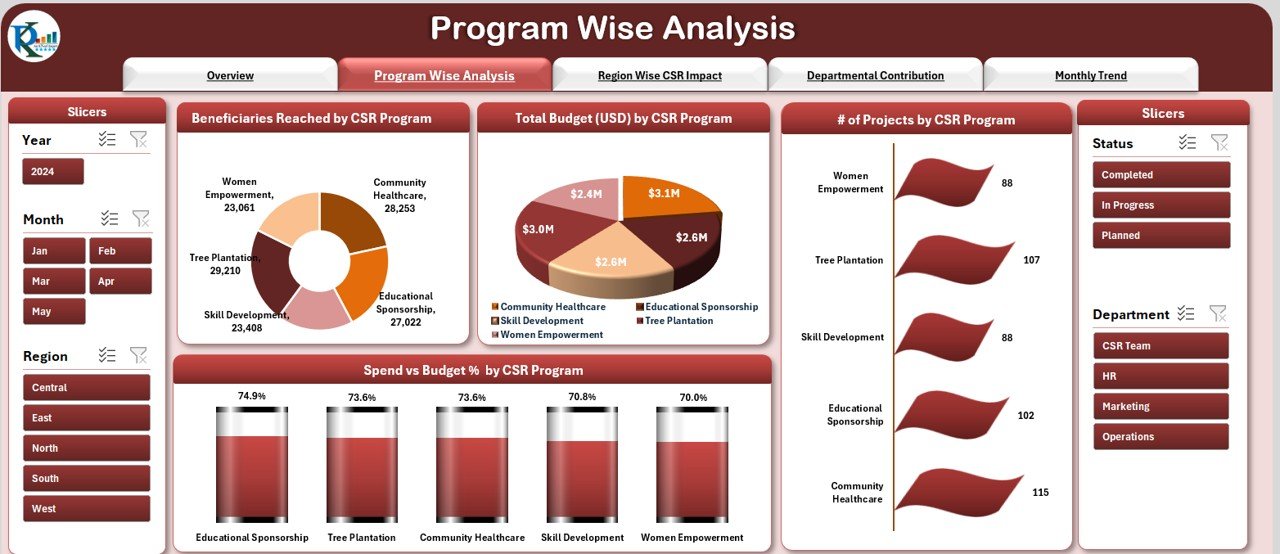
2️⃣ Program-Wise Analysis
Compare program budgets, beneficiaries, project counts, and spend vs. budget percentages to evaluate which initiatives drive the most impact.
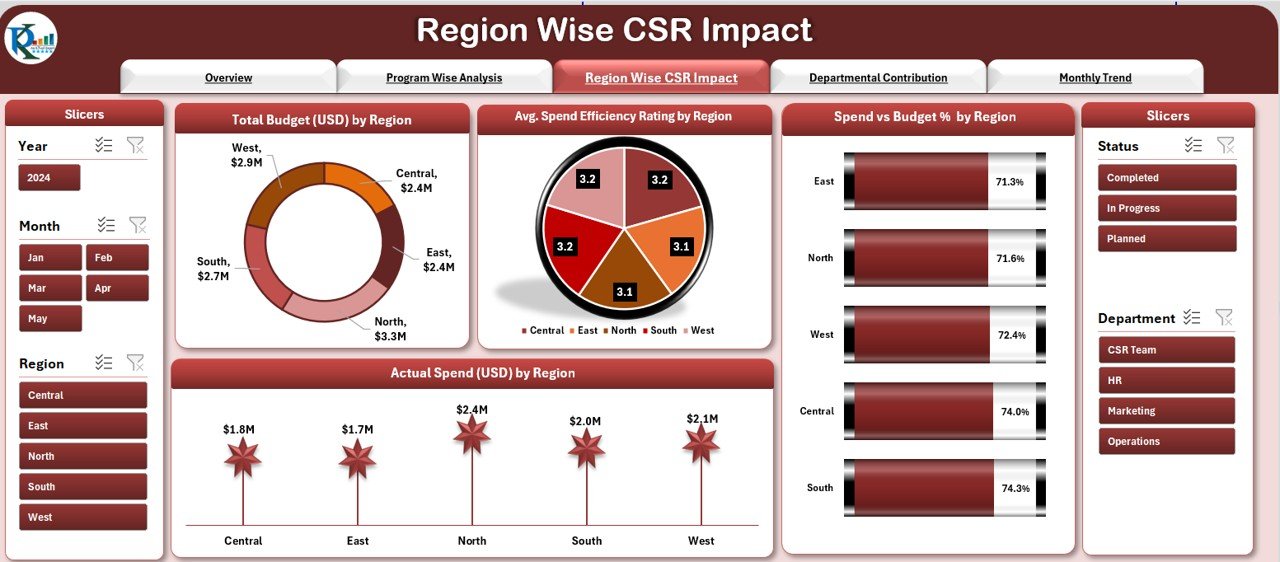
3️⃣ Region-Wise CSR Impact
Understand geographic differences in CSR performance and efficiency. Identify high-performing regions and areas needing more support.
4️⃣ Departmental Analysis
View performance and budget usage at the department level. Promote accountability and identify champions of cost-effective impact.
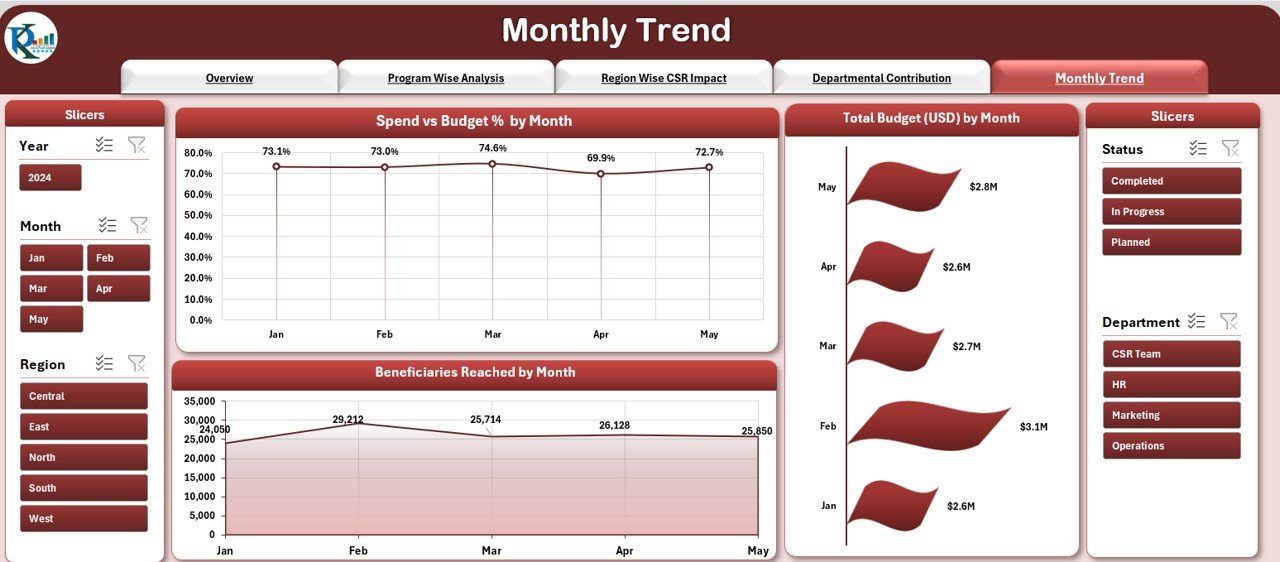
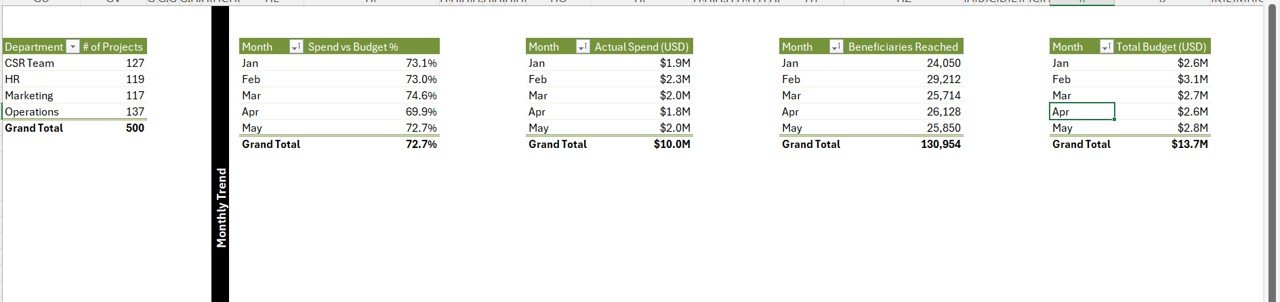
5️⃣ Monthly Trends
Track how CSR activities progress throughout the year. Spot patterns and adjust funding accordingly.
🔄 Data & Support Sheets
Structured input area and validation lists to keep your dashboard smooth and error-free.
🧠 How to Use the CSR Dashboard
-
✅ Download the Template
-
📥 Enter Your CSR Data in the Data Sheet
-
📌 Match Lookups with the Support Sheet
-
📊 Explore Pages via the Navigator
-
🔍 Use Slicers for powerful filtering
-
📤 Export Charts or Reports for presentations and stakeholders
No special Excel knowledge needed—everything is built-in and intuitive! 😎
👥 Who Can Benefit from This Dashboard
-
🏢 CSR Managers presenting impact reports
-
💼 Corporate Executives driving ESG strategy
-
🧑💻 Data Analysts creating actionable insights
-
🌱 Nonprofits tracking programs and spend
-
📈 Finance Teams monitoring budget vs. execution
-
🌍 NGOs evaluating beneficiary reach and resource allocation
If you’re managing social impact, this dashboard will transform how you present and plan your initiatives.
📘 Click here to read the Detailed blog post
🎥 Visit our YouTube channel to learn step-by-step video tutorials


Reviews
There are no reviews yet.