



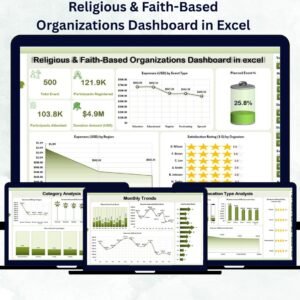
Running a temple, church, mosque, or faith-based charity requires more than devotion — it demands structure, transparency, and accountability. The Religious & Faith-Based Organizations Dashboard in Excel is a ready-to-use reporting tool that helps you track donations, events, satisfaction levels, and departmental performance — all in one interactive Excel file.
This powerful template combines data visualization, automation, and simplicity, enabling leaders to make evidence-based decisions that strengthen trust and optimize resource use. Whether you’re managing a single congregation or a global religious network, this dashboard helps you align your mission with measurable impact.
⚙️ Key Features of Religious & Faith-Based Organizations Dashboard in Excel
✅ 📂 Page Navigator – Quick navigation on the left-hand panel lets you switch between analytical pages with one click.
✅ 📊 Overview Page – At-a-Glance Summary

Gain a holistic view of your organization’s performance:
Four KPI Cards: Total Expenses (USD), Planned Event %, Satisfaction Rating (1-5), and Donation Total (USD).
Charts:
Expenses (USD) by Event Type
Planned Event %
Expenses (USD) by Region
Satisfaction Rating (1-5) by Organizer
✅ 🏢 Department Analysis Page
Dive into departmental efficiency:
Ongoing Event % by Department
Donation Amount (USD) by Department
Satisfaction Rating (1-5) by Department
Expense (USD) by Department
✅ 🎯 Category Analysis Page
Compare different categories — Charity, Education, Outreach, Cultural, etc.
Expense (USD) by Category
Donation Amount (USD) by Category
Satisfaction Rating (1-5) by Category
Planned Event % by Category
✅ 📍 Location Type Analysis Page
Perfect for multi-branch organizations:
Ongoing Event % by Location
Donation Amount (USD) by Location
Satisfaction Rating (1-5) by Location
Expense (USD) by Location
✅ 📅 Monthly Trends Page
Understand performance over time:
Planned Event % by Month
Donation Amount (USD) by Month
Expense (USD) by Month
Total Events by Month
✅ 📘 Support & Data Sheets
Data Sheet: Holds all raw inputs — donations, expenses, ratings, and event details.
Support Sheet: Lists departments, regions, and categories used for slicers and dropdowns.
💡 Why Use This Dashboard?
Faith-based organizations rely on integrity and accountability. This Excel dashboard ensures:
🌟 Transparency: Share clear financial and operational reports with stakeholders.
💰 Financial Stewardship: Track donations vs expenses instantly.
🎉 Event Optimization: Analyze participation and planning efficiency.
💬 Feedback Insights: Monitor satisfaction scores to enhance community engagement.
🧭 Strategic Decisions: Identify top-performing departments and programs.
🧩 How It Works
1️⃣ Input Data: Add donations, expenses, categories, and events to the Data Sheet.
2️⃣ Automatic Calculation: Formulas and pivot tables summarize key metrics.
3️⃣ Visualization: Charts and cards update automatically.
4️⃣ Filter & Analyze: Use slicers to compare by Month, Region, Department, or Category.
5️⃣ Instant Results: View real-time insights without manual recalculation.
🚀 Advantages of Using Religious & Faith-Based Organizations Dashboard
✅ Real-Time Performance Tracking – Monitor donations and events as they happen.
✅ Cost-Effective Solution – No subscriptions or extra software needed.
✅ Transparency & Accountability – Build trust through clear reporting.
✅ Data-Driven Decisions – Identify opportunities and improvement areas.
✅ Easy Collaboration – Share the dashboard via OneDrive or Excel Online.
✅ Scalable Design – Works for small local groups or large faith networks.
🙌 Who Can Benefit
⛪ Church and Ministry Leaders – Track tithes and attendance.
🕌 Mosque Committees – Manage Zakat funds and events.
🛕 Temple Trusts – Monitor festival donations and expenses.
🤝 Faith-Based NGOs – Measure program impact and sponsor engagement.
🎗️ Event Organizers – Plan and analyze community gatherings efficiently.
🌟 Best Practices for Using the Dashboard
✅ Update data regularly (after each event or month).
✅ Use consistent naming for departments and categories.
✅ Protect sensitive financial information.
✅ Apply color-coded formats for clear visuals.
✅ Monitor both MTD and YTD performance.
✅ Customize charts to match your organization’s theme.
📈 Use Cases
Church management and offering tracking.
Charity and community fund oversight.
Faith-based school or education outreach programs.
Cultural and religious event planning and review.
🔗 Click here to read the Detailed blog post
📺 Visit our YouTube channel for step-by-step video tutorials
👉 YouTube.com/@PKAnExcelExpert
Watch the step-by-step video tutorial:
Compatibility and Requirements
- Works in Microsoft Excel desktop (Excel 2016 or later, or Microsoft 365).
- The dashboard uses slicers to filter by month, region, department and category. Microsoft explains them in Use slicers to filter data.
Frequently Asked Questions
Which pages does the dashboard include?
It has an Overview page, a Department Analysis page, a Category Analysis page, a Location Type Analysis page and a Monthly Trends page. A page navigator on the left switches between them.
Which KPIs appear on the Overview page?
Four KPI cards: Total Expenses (USD), Planned Event %, Satisfaction Rating (1-5) and Donation Total (USD).
Where do I enter my data?
Enter donations, expenses, ratings and event details in the Data sheet. The Support sheet holds the lists of departments, regions and categories used for the slicers and dropdowns.
Can I compare donations and expenses by department?
Yes. The Department Analysis page shows Donation Amount (USD) and Expense (USD) by department, along with Ongoing Event % and Satisfaction Rating (1-5).
Is there a Power BI or Google Sheets version?
Yes. See the Religious & Faith-Based Organizations Dashboard in Power BI and the Religious & Faith-Based Organizations Dashboard in Google Sheets.
Related Faith-Based and Nonprofit Templates
- Religious & Faith-Based Organizations KPI Dashboard in Excel: a KPI view for faith-based groups
- Religious & Faith-Based Organizations Dashboard in Power BI: the Power BI edition
- Religious & Faith-Based Organizations Dashboard in Google Sheets: the Google Sheets edition
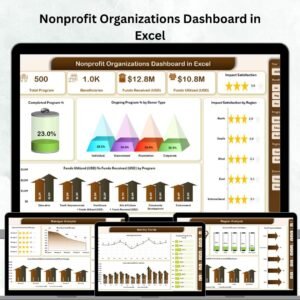
- Nonprofit Organizations Dashboard in Excel: a similar dashboard for general nonprofits
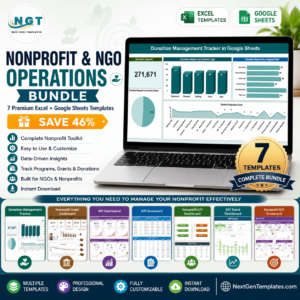
- Nonprofit & NGO Operations Bundle: 7 Excel and Google Sheets templates for nonprofits in one download
Browse all Excel dashboards.
















Reviews
There are no reviews yet.