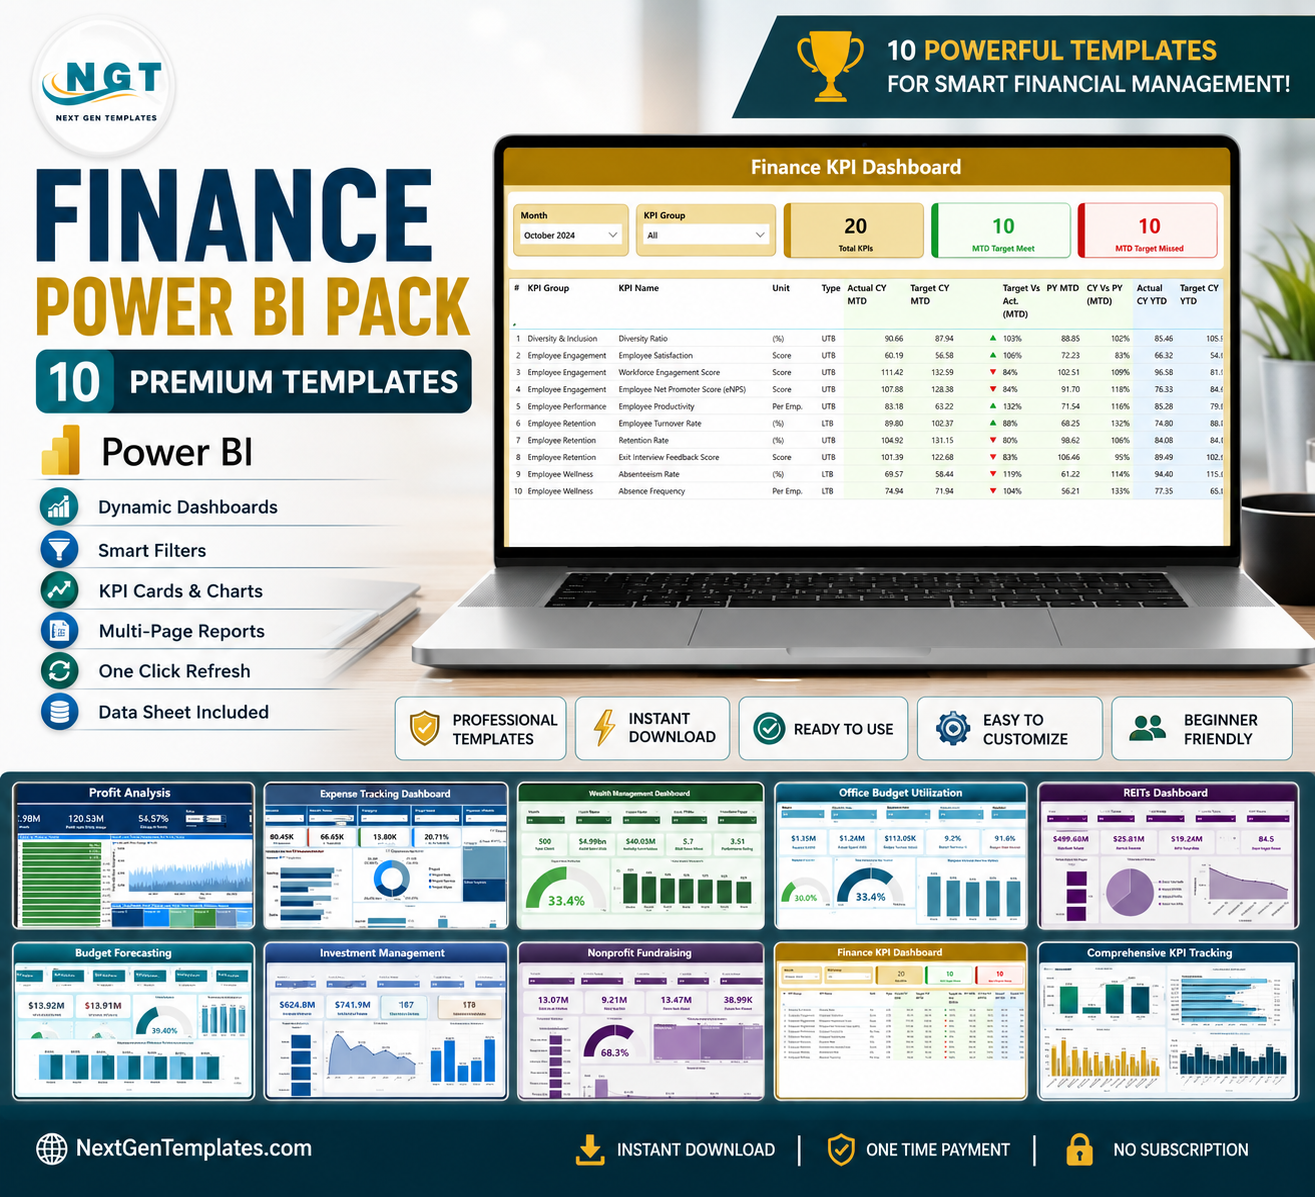
The Finance Power BI Pack is the complete Power BI toolkit for finance analysts and BI developers who are tired of rebuilding the same reports from scratch. It bundles 10 premium Power BI dashboards covering the entire finance function — expense tracking, revenue analysis, profit modelling, budgeting, forecasting, investments, wealth management, REITs, nonprofit fundraising and headline finance KPIs. Bought individually these templates cost $173.90; as a bundle you pay just $96.99 and save 44% ($76.91).
🔑 Key Features of the Finance Power BI Pack
🔹 10 Ready-to-Use Power BI Dashboards – a full finance analytics stack in native .pbix format.
🔹 100% Power BI – purpose-built for finance teams, no third-party visuals or add-ins required.
🔹 Save $76.91 vs Buying Individually – individual total $173.90, bundle just $96.99 (44% off).
🔹 Expense, Budget & Forecast Control – track spend, budget utilisation and forward forecasts with CY-vs-PY variance.
🔹 Revenue & Profit Intelligence – KPI cards, margin analysis and interactive What-if profit scenarios.
🔹 Investment, Wealth & REIT Analytics – portfolios, AUM, asset allocation, returns and property yields.
🔹 Nonprofit & Fundraising Tracking – donations, campaigns, donor retention and goal progress.
🔹 Interactive Slicers, Drill-Downs & KPI Cards – filter by department, period, category, vendor and more.
🔹 Plug-and-Play Setup – replace the sample data and every visual refreshes automatically.
🔹 Perfect for Finance Analysts & BI Developers – enterprise-grade reporting at a fraction of the cost.
📦 What’s Inside the Finance Power BI Pack
- Expense Tracking Dashboard in Power BI – analyze spending across departments, categories and vendors with CY-vs-PY variance and full drill-down.

Expense Tracking Dashboard in Power BI
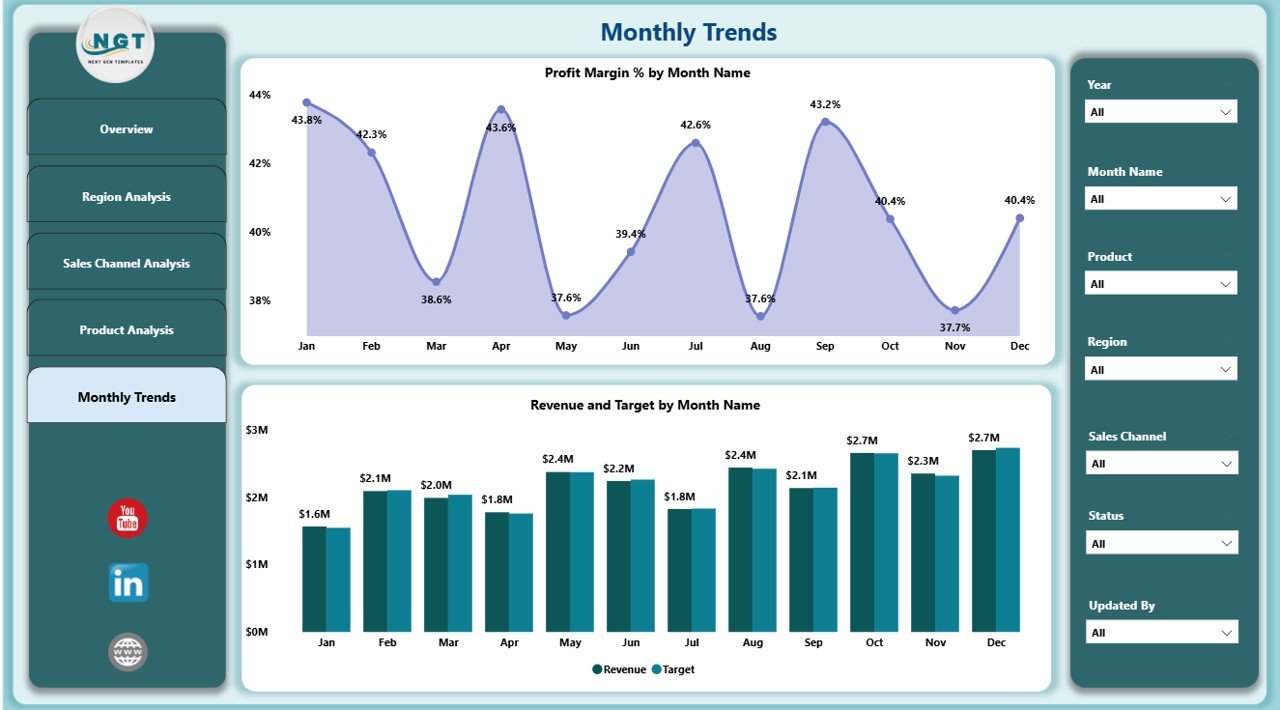
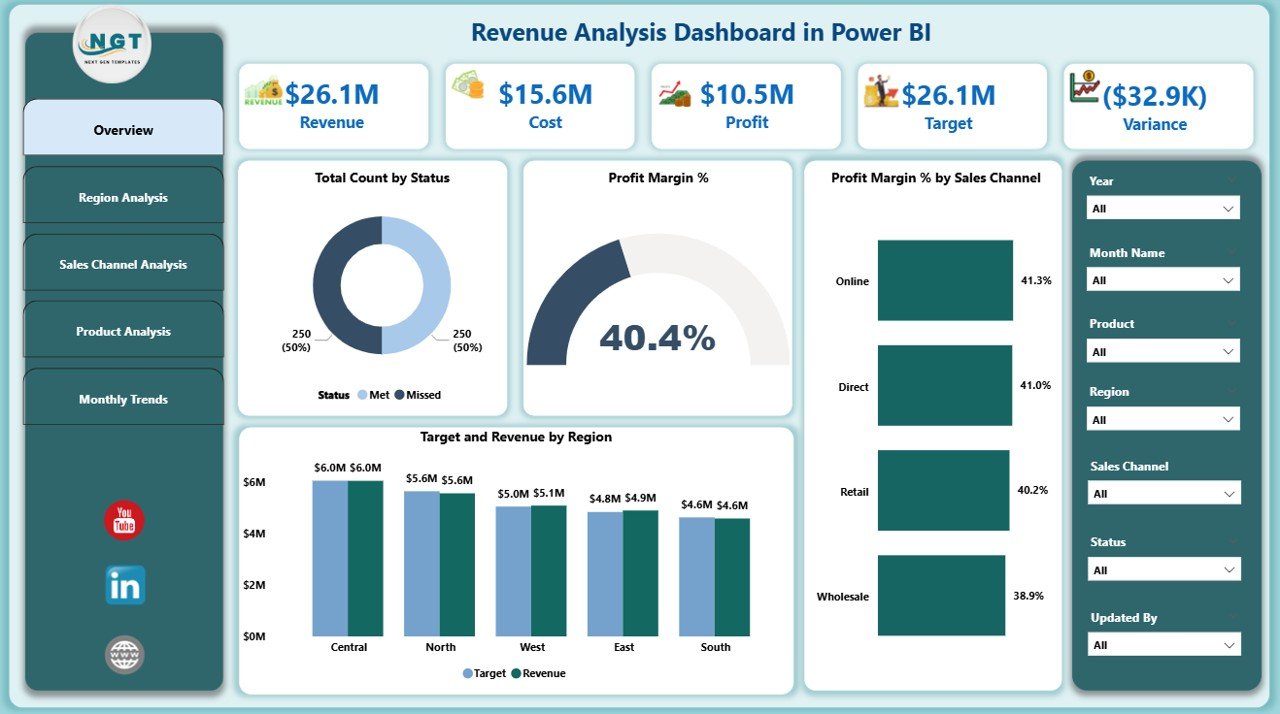
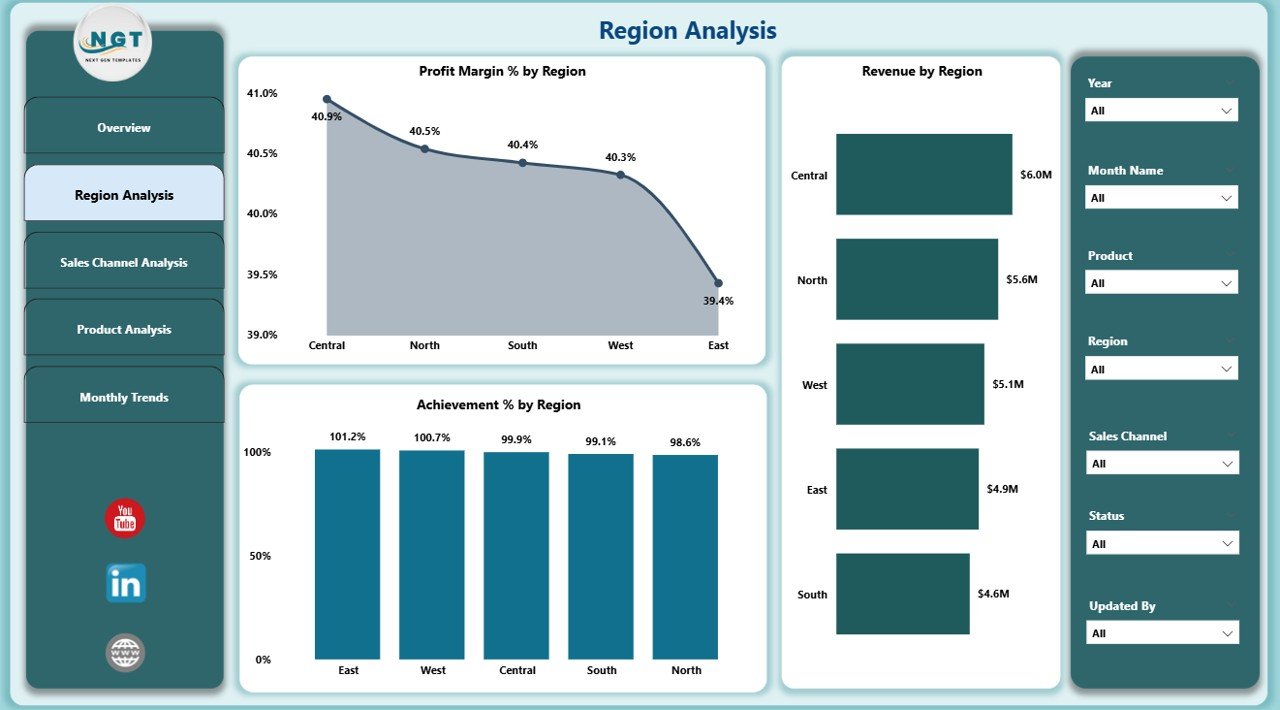
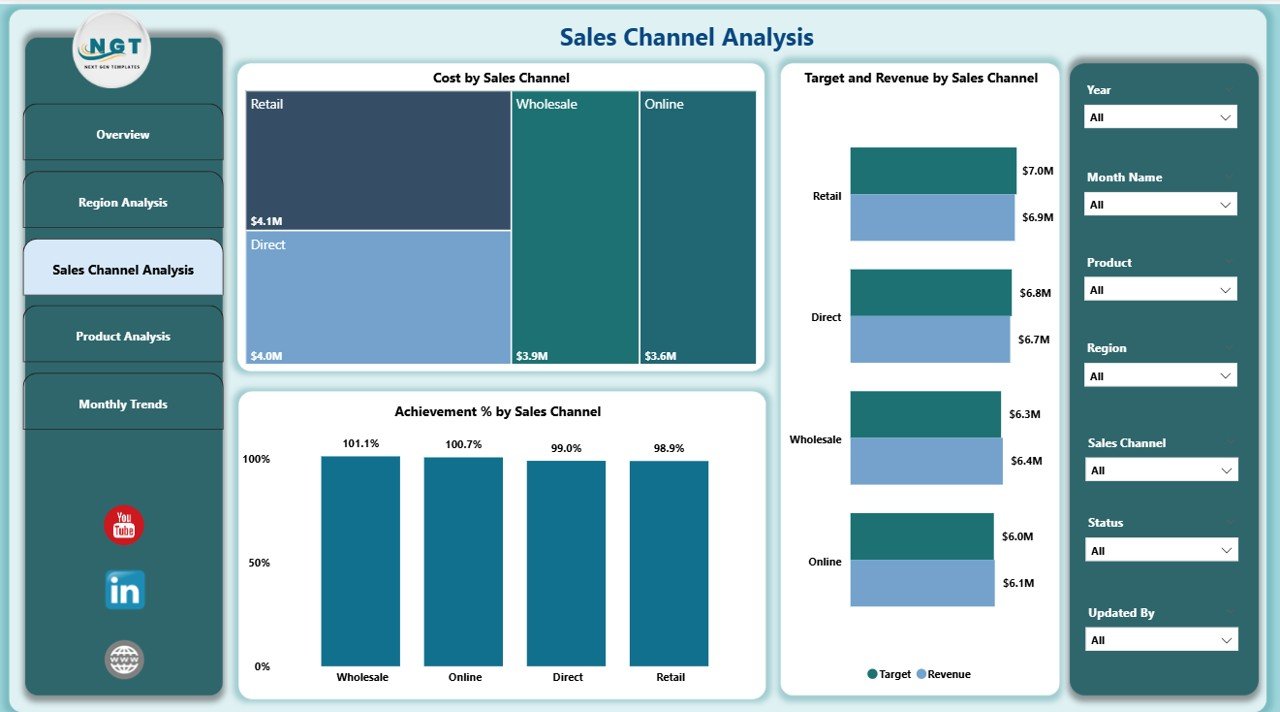
- Revenue Analysis Dashboard in Power BI – 5 pages of revenue intelligence with KPI cards for revenue, margin % and target achievement.
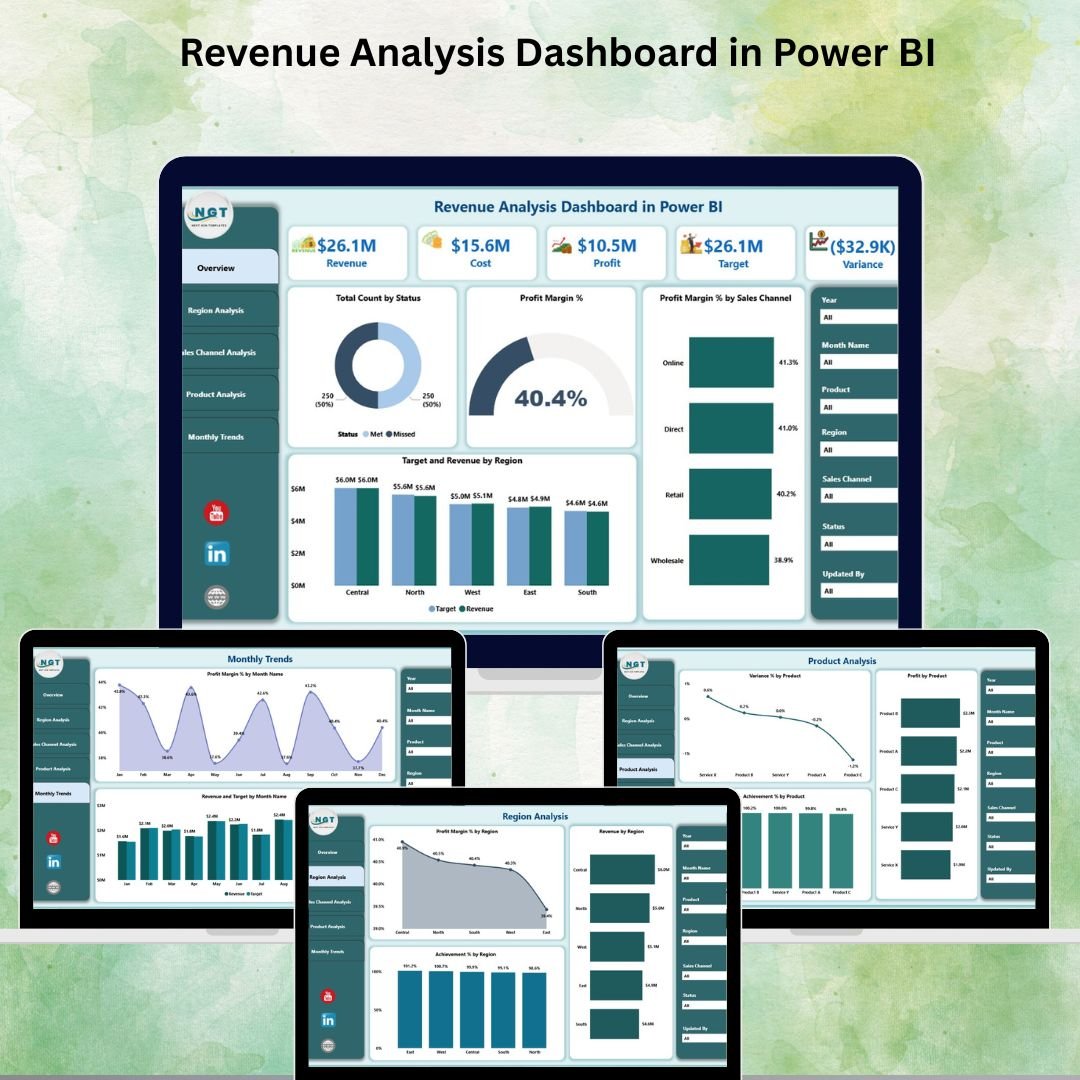
Revenue Analysis Dashboard in Power BI
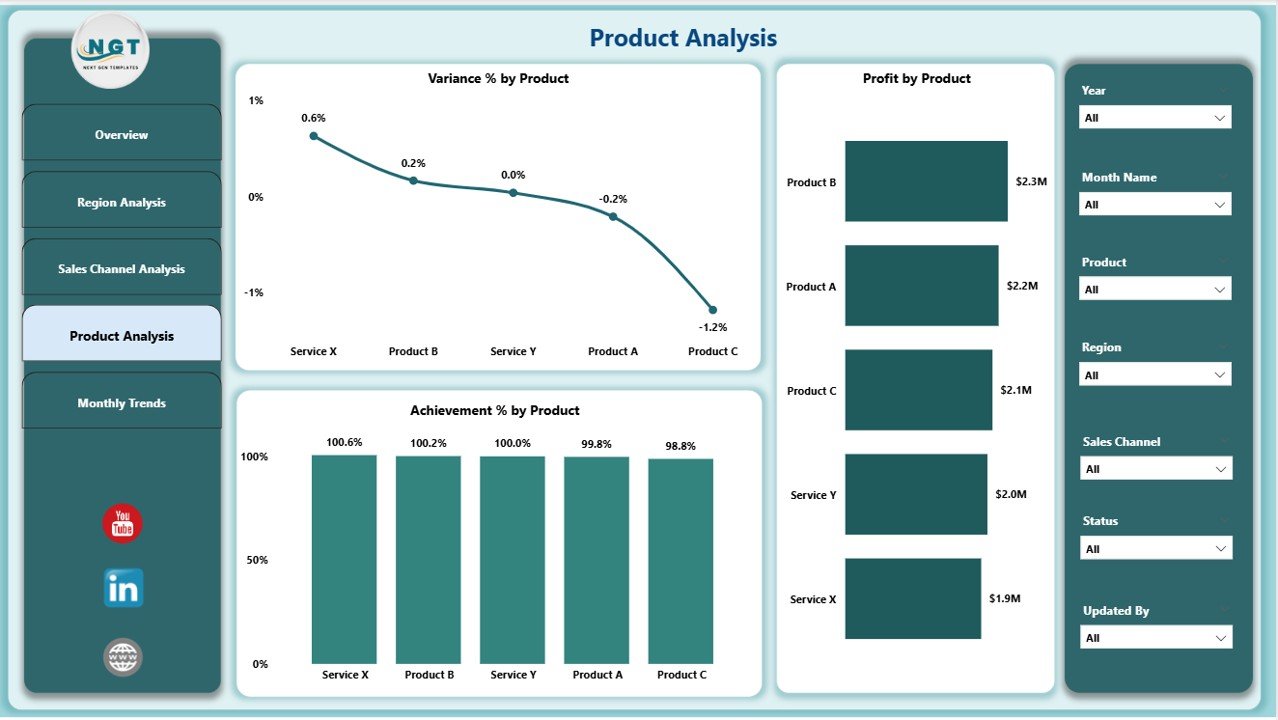
- Profit Analysis Dashboard using What-if Parameter in Power BI – model profit scenarios live using What-if parameters for price, cost and volume.
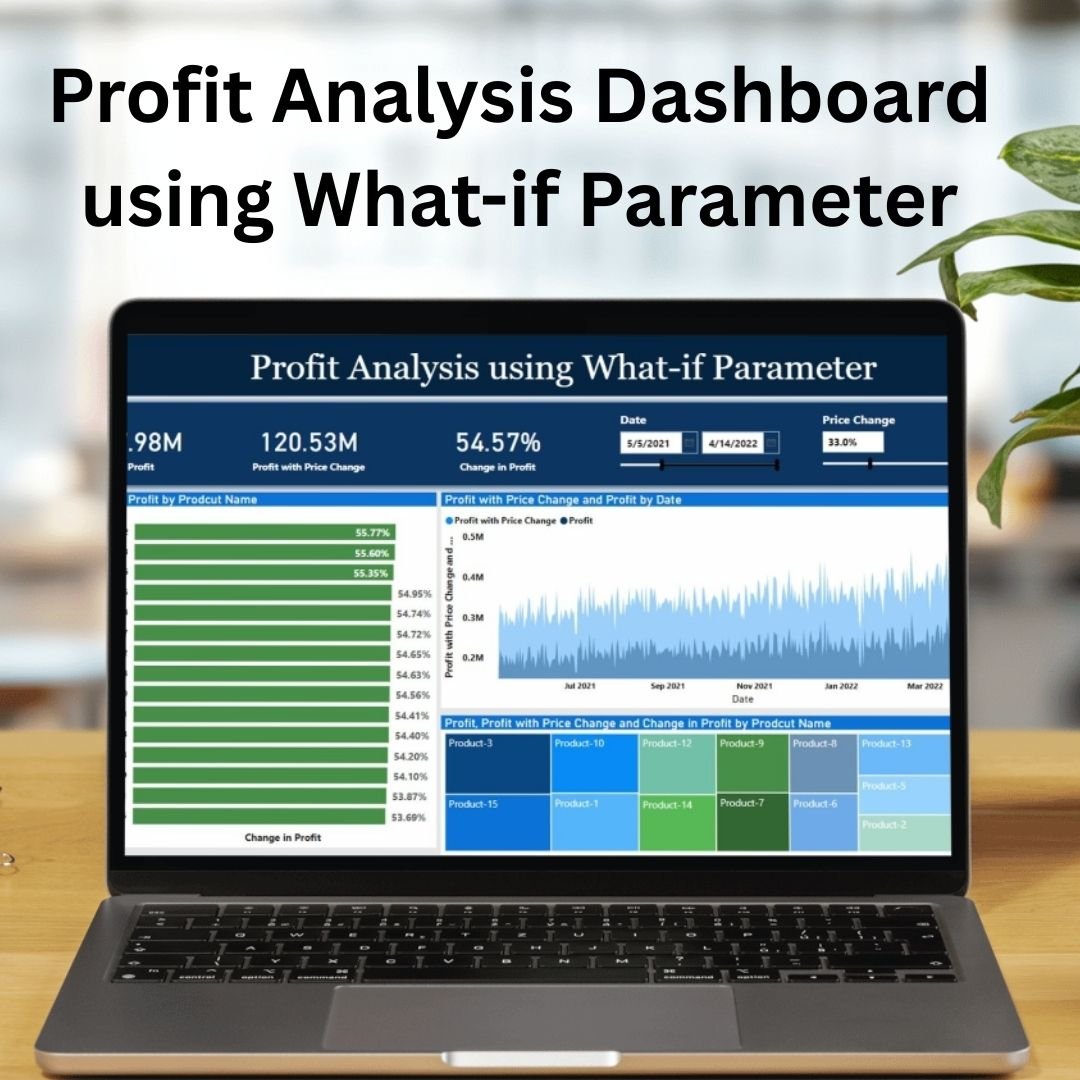
Profit Analysis Dashboard using What-if Parameter in Power BI
- Wealth Management Dashboard in Power BI – track client portfolios, AUM, asset allocation and returns in one advisor-ready view.

Wealth Management Dashboard in Power BI
- Office Budget Utilization Dashboard in Power BI – monitor office budget vs actual spend by department, cost centre and category.
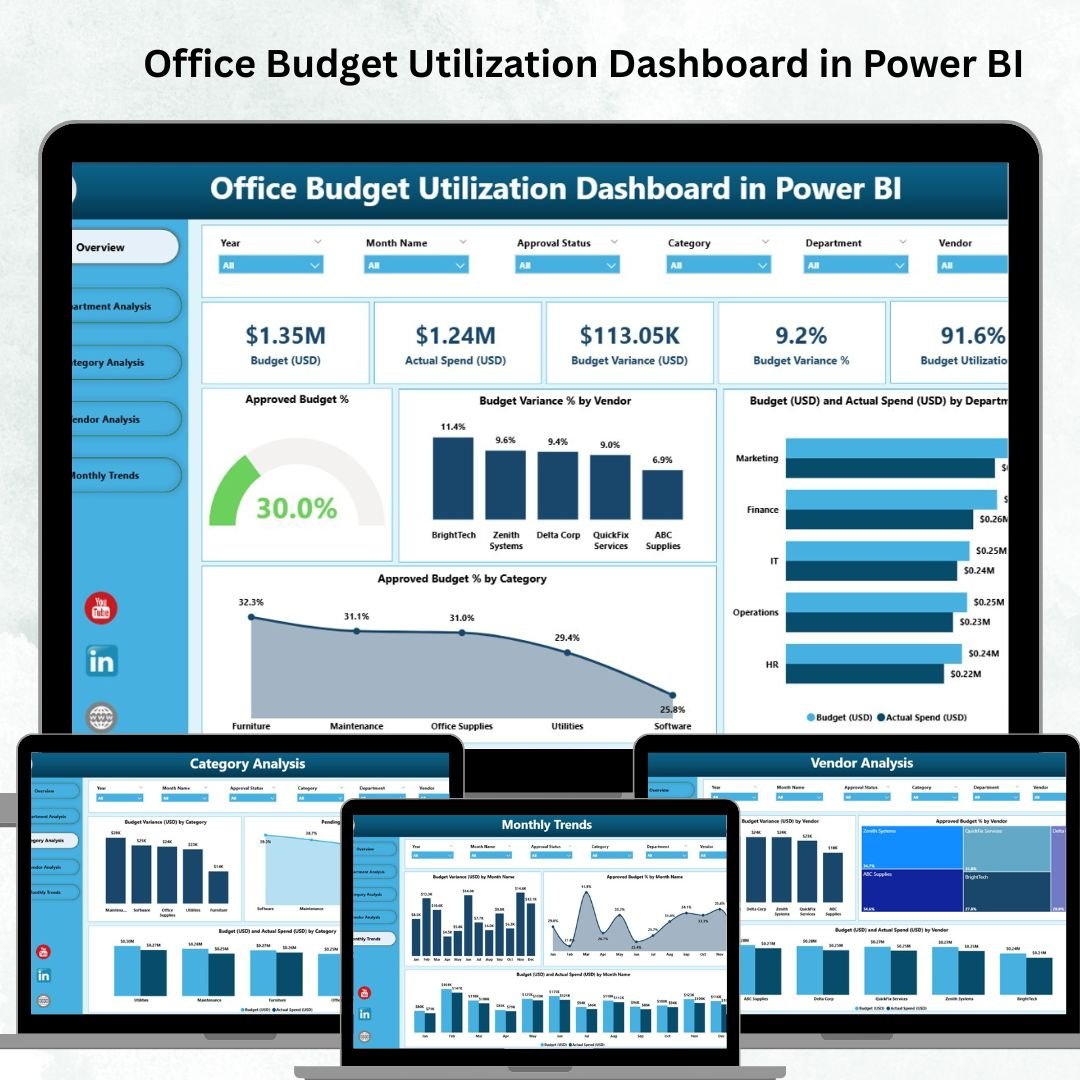
Office Budget Utilization Dashboard in Power BI
- Real Estate Investment Trusts (REITs) Dashboard in Power BI – analyse REIT performance, occupancy, NOI, FFO and dividend yields at a glance.
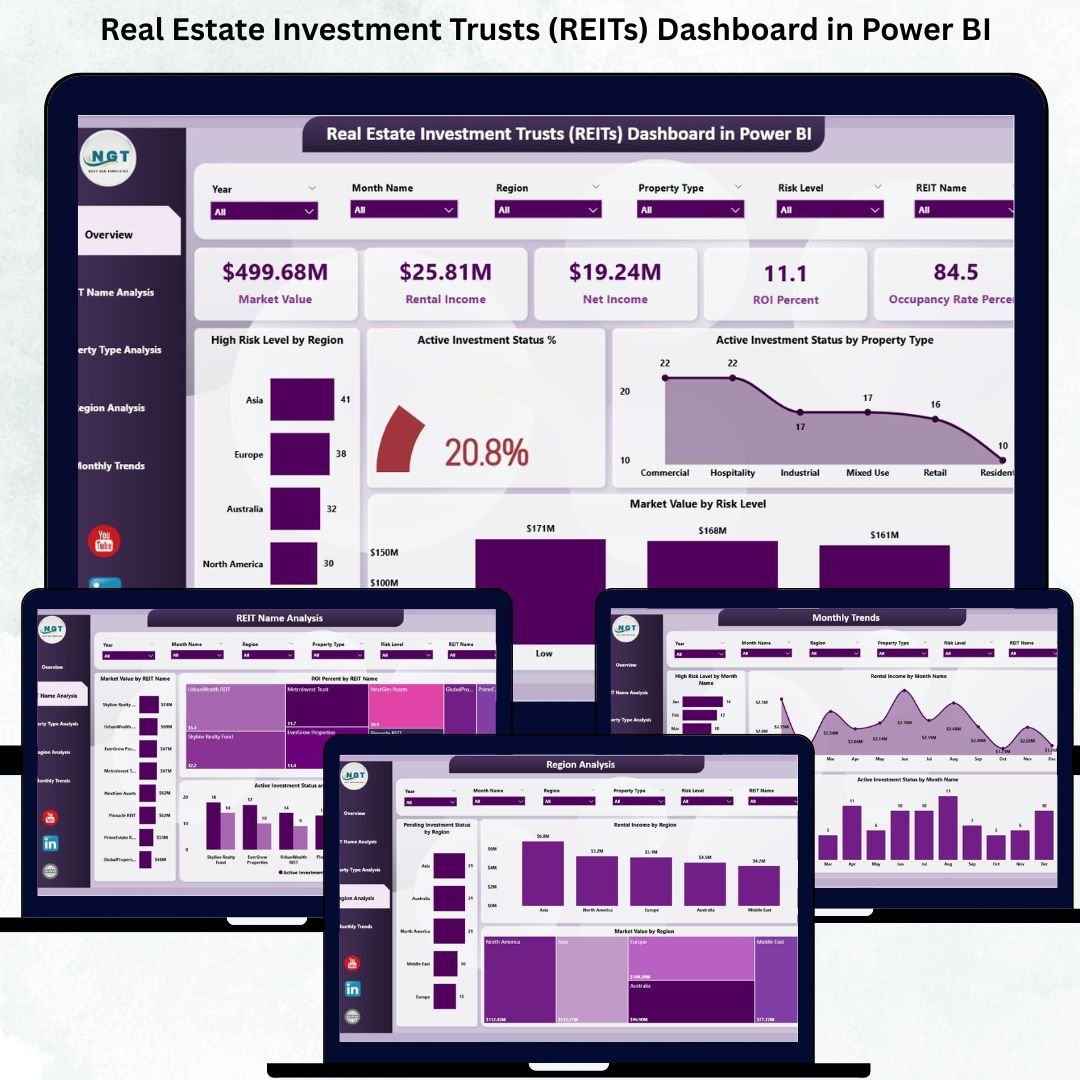
Real Estate Investment Trusts (REITs) Dashboard in Power BI
- Budget Forecasting Dashboard in Power BI – project budgets forward with trend-based forecasts and live variance tracking.
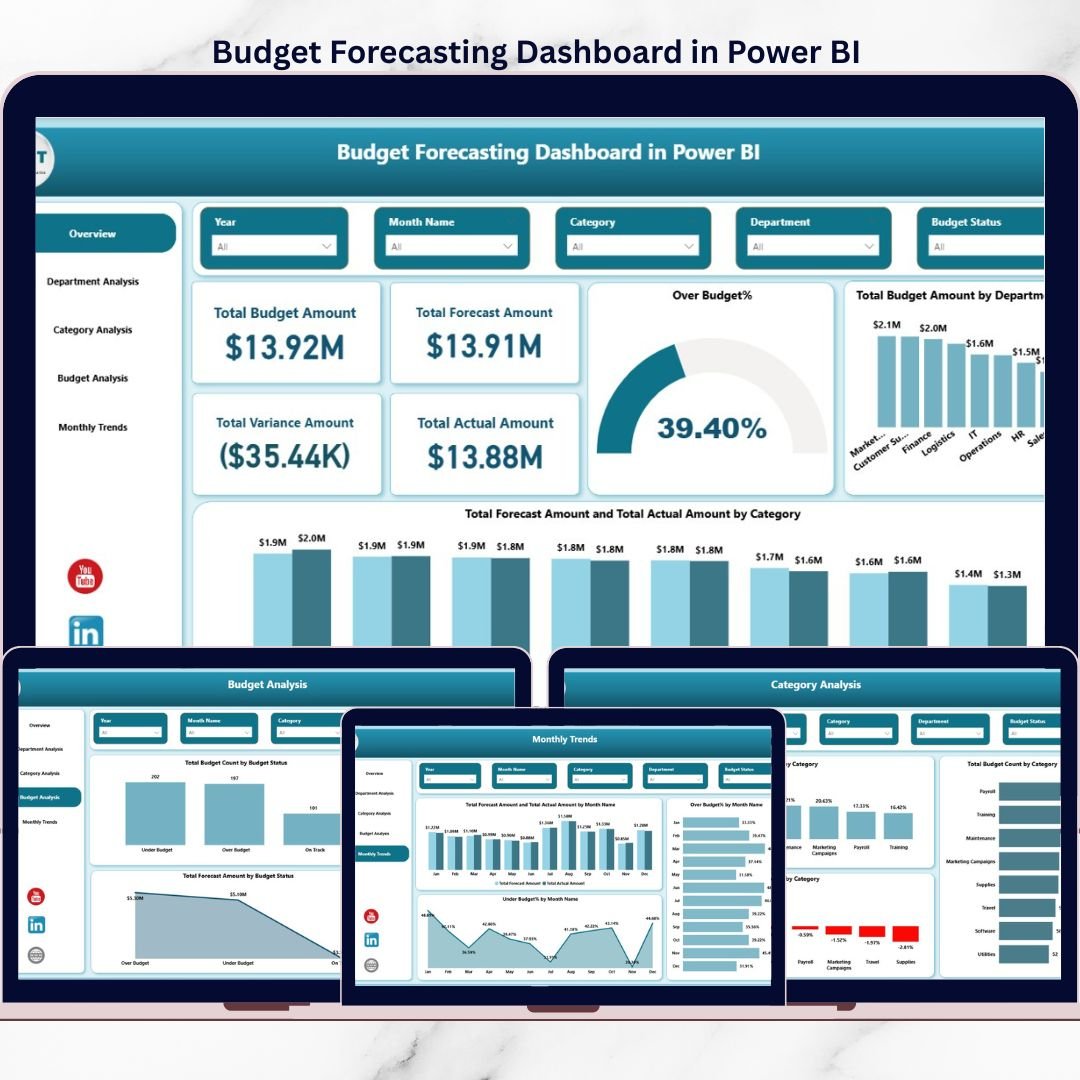
Budget Forecasting Dashboard in Power BI
- Investment Management Dashboard in Power BI – track holdings, returns, risk and asset allocation across your investment book.
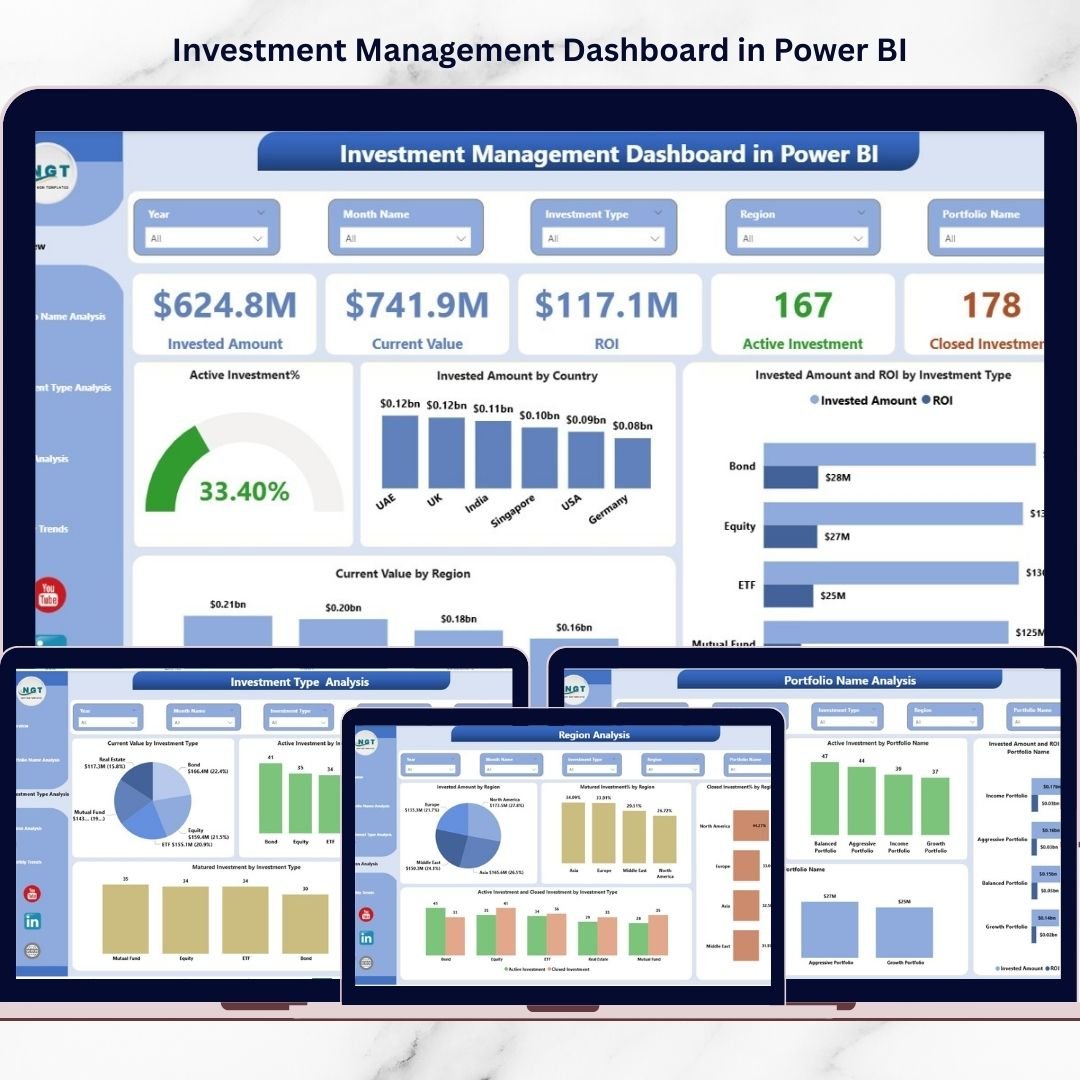
Investment Management Dashboard in Power BI
- Nonprofit Fundraising Dashboard in Power BI – monitor donations, campaigns, donor retention and fundraising goals in real time.
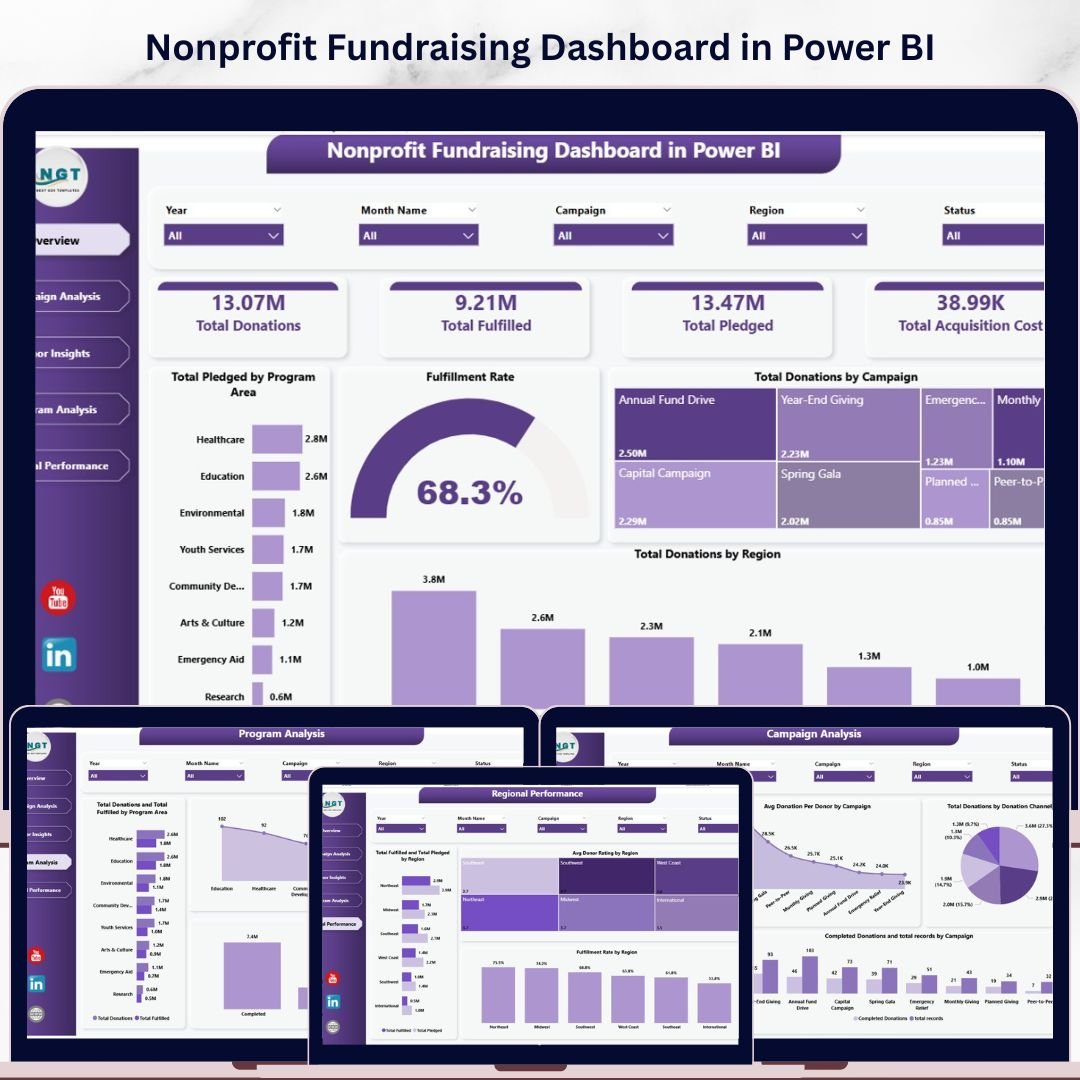
Nonprofit Fundraising Dashboard in Power BI
- Finance KPI Dashboard in Power BI – headline finance KPIs — revenue, profit, cash and margins — in one executive scorecard.

Finance KPI Dashboard in Power BI
💡 Smart Comparison — Individual vs Bundle
| # | Dashboard | Platform | Individual Price |
|---|---|---|---|
| 1 | Expense Tracking Dashboard | Power BI | $17.99 |
| 2 | Revenue Analysis Dashboard | Power BI | $17.99 |
| 3 | Profit Analysis Dashboard using What-if Parameter | Power BI | $17.99 |
| 4 | Wealth Management Dashboard | Power BI | $17.99 |
| 5 | Office Budget Utilization Dashboard | Power BI | $17.99 |
| 6 | Real Estate Investment Trusts (REITs) Dashboard | Power BI | $17.99 |
| 7 | Budget Forecasting Dashboard | Power BI | $17.99 |
| 8 | Investment Management Dashboard | Power BI | $17.99 |
| 9 | Nonprofit Fundraising Dashboard | Power BI | $17.99 |
| 10 | Finance KPI Dashboard | Power BI | $11.99 |
| Individual Total | $173.90 | ||
| Finance Power BI Pack Price | $96.99 (Save 44%) | ||
⚙️ How to Use the Finance Power BI Pack
1️⃣ Download the Bundle – instantly access all 10 Power BI templates after purchase.
2️⃣ Open Each .pbix – in Power BI Desktop (free from Microsoft).
3️⃣ Load Your Data – replace the sample tables with your own via Power Query.
4️⃣ Refresh & Analyze – KPI cards, charts and What-if parameters update automatically.
5️⃣ Filter & Publish – use slicers to build stakeholder views and publish to the Power BI Service.
👥 Who Can Benefit from This Finance Power BI Pack
🔹 Finance Analysts & FP&A Teams
🔹 BI Developers & Power BI Consultants
🔹 CFOs, Finance Directors & Controllers
🔹 Investment & Wealth Management Advisors
🔹 Budget Owners & Cost-Centre Managers
🔹 Nonprofit Finance & Fundraising Teams
🔹 Accountants, Bookkeepers & Business Owners
Get All 10 Finance Power BI Dashboards in One Pack
Was $173.90 → Now $96.99
Save 44% ($76.91)


Reviews
There are no reviews yet.