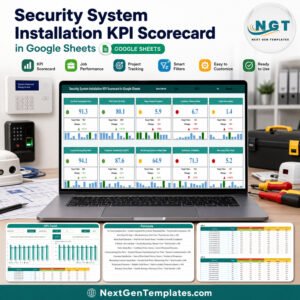
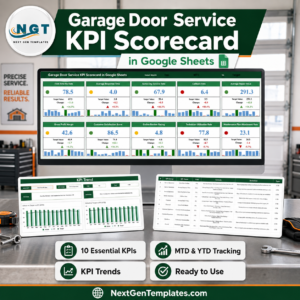
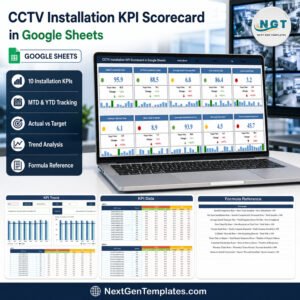
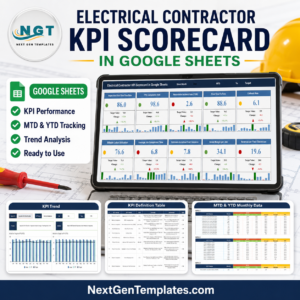
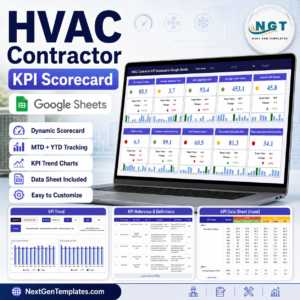
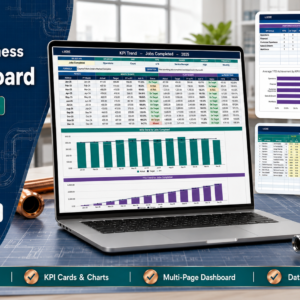
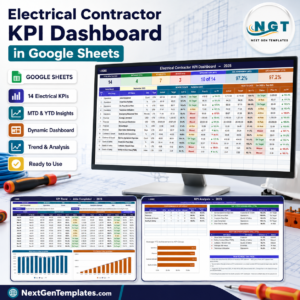
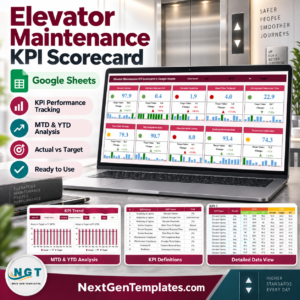
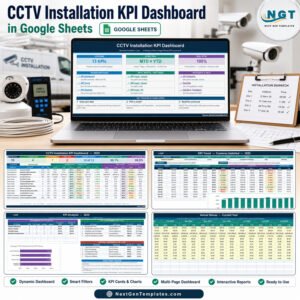
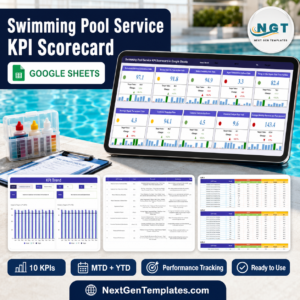
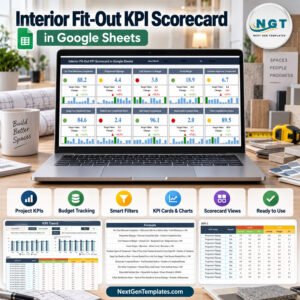
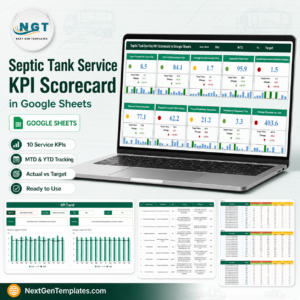
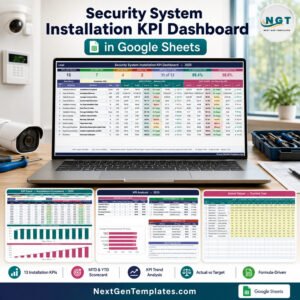
13 security installation KPIs, 5 business groups, 12 monthly periods, and MTD plus YTD views are brought together in the Security System Installation KPI Dashboard in Google Sheets. The formula-driven workbook compares actuals with targets and prior-year values, applies direction-aware traffic lights, and ranks the strongest and weakest results. This security installation KPI template costs $8.99 on sale, works in a browser, and becomes an editable copy in your own Google Drive. No add-on, macro, connector, or recurring subscription is required.

Key Features of the Security System Installation KPI Dashboard in Google Sheets
- 13 installation KPIs: delivery, sales, service quality, recurring customer revenue, and workforce performance in one monthly review.
- MTD and YTD scorecard: actual, target, achievement, status, prior year, and change versus prior year appear side by side.
- Direction-aware scoring: 9 upper-the-better and 4 lower-the-better KPIs are calculated correctly, so lower time or defect rates can score above target.
- Clear traffic lights: On Target begins at 100%, At Risk covers 95% to 99%, and Missed is below 95% in the supplied formulas.
- Month selector: choose a month and the dashboard, KPI Trend, and KPI Analysis pages follow the selection.
- KPI Trend: inspect one metric across 12 months with MTD and YTD tables plus Actual, Target, and Prior Year charts.
- KPI Analysis: compare five group roll-ups and review automatically ranked top-five and bottom-five YTD KPIs.
- Editable definitions: KPI names, units, formulas, descriptions, owners, priority, frequency, and UTB/LTB direction remain visible in cells.
- Three input sheets: maintain actual, target, and previous-year values in clearly separated monthly tables.
- Google Sheets collaboration: share the copy with selected colleagues using normal Drive permissions.

What’s Inside the Security System Installation KPI Dashboard in Google Sheets
KPI Dashboard: the main scorecard displays all 13 KPIs. In the supplied September 2025 sample, the YTD header shows 7 On Target, 4 At Risk, 2 Missed, 11 of 13 improving against prior year, 99.4% average MTD achievement, and 98.6% average YTD achievement. These are fictional demonstration values, not security-industry benchmarks.
KPI Trend: select a KPI such as Installations Completed and review January through December. The table shows monthly and cumulative results, while the two charts make Actual, Target, and Prior Year movement easier to compare.

KPI Analysis: group-level counts and average achievement sit beside top-five and bottom-five YTD rankings. Installation Delivery, Sales & Revenue, Service Quality, Recurring & Customer, and Workforce are the five supplied groups.

Input sheets: KPI Input – Actual, KPI Input – Target, and KPI Input – PY provide monthly entry grids. The screenshot below shows the Actual sheet; its yellow cells hold the values you replace. The other two inputs use the same monthly structure for targets and prior-year figures.

KPI Definition: the master list contains Installations Completed, Installation Revenue, Average Contract Value, Lead-to-Sale Conversion, On-Time Installation Rate, First-Time Fix Rate, Average Installation Time, Callback / Rework Rate, Warranty Claim Rate, False Alarm Rate, Monitoring Subscription Attach Rate, Customer Satisfaction (CSAT), and Technician Utilisation.

The 13 Security System Installation KPIs
| Group | KPIs | Direction |
|---|---|---|
| Installation Delivery | Installations Completed; On-Time Installation Rate; First-Time Fix Rate; Average Installation Time | Average Installation Time is lower-the-better |
| Sales & Revenue | Installation Revenue; Average Contract Value; Lead-to-Sale Conversion | Upper-the-better |
| Service Quality | Callback / Rework Rate; Warranty Claim Rate; False Alarm Rate | Lower-the-better |
| Recurring & Customer | Monitoring Subscription Attach Rate; Customer Satisfaction (CSAT) | Upper-the-better |
| Workforce | Technician Utilisation | Upper-the-better |
Security System Installation KPI Dashboard vs. Excel vs. Paid Field-Service Software – Where This Fits
| Area | This Google Sheets KPI dashboard | Excel KPI workbook | Paid field-service software |
|---|---|---|---|
| Cost | $8.99 sale price, one time | Template plus Microsoft 365 if needed | Recurring per-user subscription |
| Setup | Make a copy and replace monthly totals | Download and edit locally | Configuration and onboarding |
| Collaboration | Native browser sharing | Best through OneDrive | Native, normally seat-based |
| Custom KPIs | Editable master definition table | Editable workbook | Depends on plan and permissions |
| Five-user year-one template cost | $8.99 total | Template plus licences | Usually hundreds or more |
| Quoting, scheduling, dispatch, invoicing | No | No | Often included |
| Automatic data capture | No; monthly totals are entered by you | Usually manual | Often connected to live jobs |
Who This Template Is For – and Who It’s Not For
It is designed for CCTV, alarm, access-control, intercom, and integrated security installers that already have monthly business totals and need a repeatable management review. Owners, operations managers, sales leaders, quality managers, monitoring managers, and field-service supervisors can use the same view without exposing individual customer or site records.
It is not estimating, system design, installation scheduling, dispatch, CRM, monitoring-centre, incident-response, warranty-administration, or compliance software. It does not store camera feeds, alarm events, access credentials, customer names, addresses, technician timesheets, or job-level records. It does not certify performance against any licensing rule, electrical code, fire or life-safety standard, privacy law, insurer requirement, or manufacturer specification.
How to Use the Security System Installation KPI Dashboard in Google Sheets
- Open the downloaded PDF and use its Google Sheets link to make an editable copy in your Drive.
- Review the KPI Definition sheet and adapt the names, formulas, owners, priorities, and UTB/LTB direction to your business.
- Replace the fictional sample values on KPI Input – Actual, KPI Input – Target, and KPI Input – PY.
- Select a month on KPI Dashboard and read MTD and YTD achievement, status, and prior-year comparisons.
- Use KPI Trend for a single metric and KPI Analysis for group roll-ups and ranked exceptions.
- Share the copy only with the colleagues who should edit the monthly inputs. See Google’s guidance on sharing files.
Real-World Use Cases
An operations manager compares Installations Completed, On-Time Installation Rate, First-Time Fix Rate, and Average Installation Time before a monthly crew-planning meeting.
A sales director reads Installation Revenue beside Average Contract Value and Lead-to-Sale Conversion to separate volume, deal-size, and conversion issues.
A quality manager follows Callback / Rework Rate, Warranty Claim Rate, and False Alarm Rate, all correctly scored as lower-the-better metrics.
A monitoring manager pairs Monitoring Subscription Attach Rate with Customer Satisfaction instead of reviewing recurring revenue and service perception in isolation.
Frequently Asked Questions
Is this the dashboard or the scorecard?
This is the KPI Dashboard, with MTD and YTD tables, prior-year comparisons, KPI Trend, KPI Analysis, and three monthly input sheets. The Security System Installation KPI Scorecard in Google Sheets is a separate card-based template. They are different products.
Do I need paid Google Workspace?
No. A standard Google account can copy and edit the workbook. Normal Google Drive sharing controls collaboration.
Can I change the 13 KPIs?
Yes. The KPI Definition sheet is the master register. Keep names consistent across the definition and input tables so the lookups continue to match.
How are lower-is-better metrics handled?
UTB achievement is Actual divided by Target; LTB achievement is Target divided by Actual. The four supplied LTB metrics are Average Installation Time, Callback / Rework Rate, Warranty Claim Rate, and False Alarm Rate.
Does it connect to job-management or monitoring software?
No. It is a monthly reporting layer. You enter aggregate actual, target, and previous-year figures manually.
Are the screenshot values benchmarks?
No. All supplied figures are fictional sample data. Replace them with your own approved management totals.
Does it prove regulatory or safety compliance?
No. A KPI status is an internal management signal only; it is not an audit, certification, inspection, or statement of compliance.
About the Author
Built by PK – Microsoft Certified Professional with 15+ years of Excel, Google Sheets, and Power BI experience. Founder of NextGenTemplates, reaching 300K+ subscribers across YouTube channels. Every template is hand-built and tested before release.
Explore Related Templates
- Security System Installation KPI Scorecard in Google Sheets – the separate card-based format for the same trade.
- CCTV Installation KPI Scorecard in Google Sheets – a focused installation scorecard.
- Fire Safety Services KPI Dashboard in Google Sheets – another field-service dashboard using monthly review logic.
- Elevator Maintenance KPI Dashboard in Google Sheets – KPI tracking for a maintenance-service operation.
- Browse the Google Sheets KPI Dashboard category.
Replace scattered monthly summaries with one transparent review board. Get this editable security installation dashboard for a one-time $8.99 sale price.
Watch the step-by-step video Demo:
Last updated: September 11, 2026.