

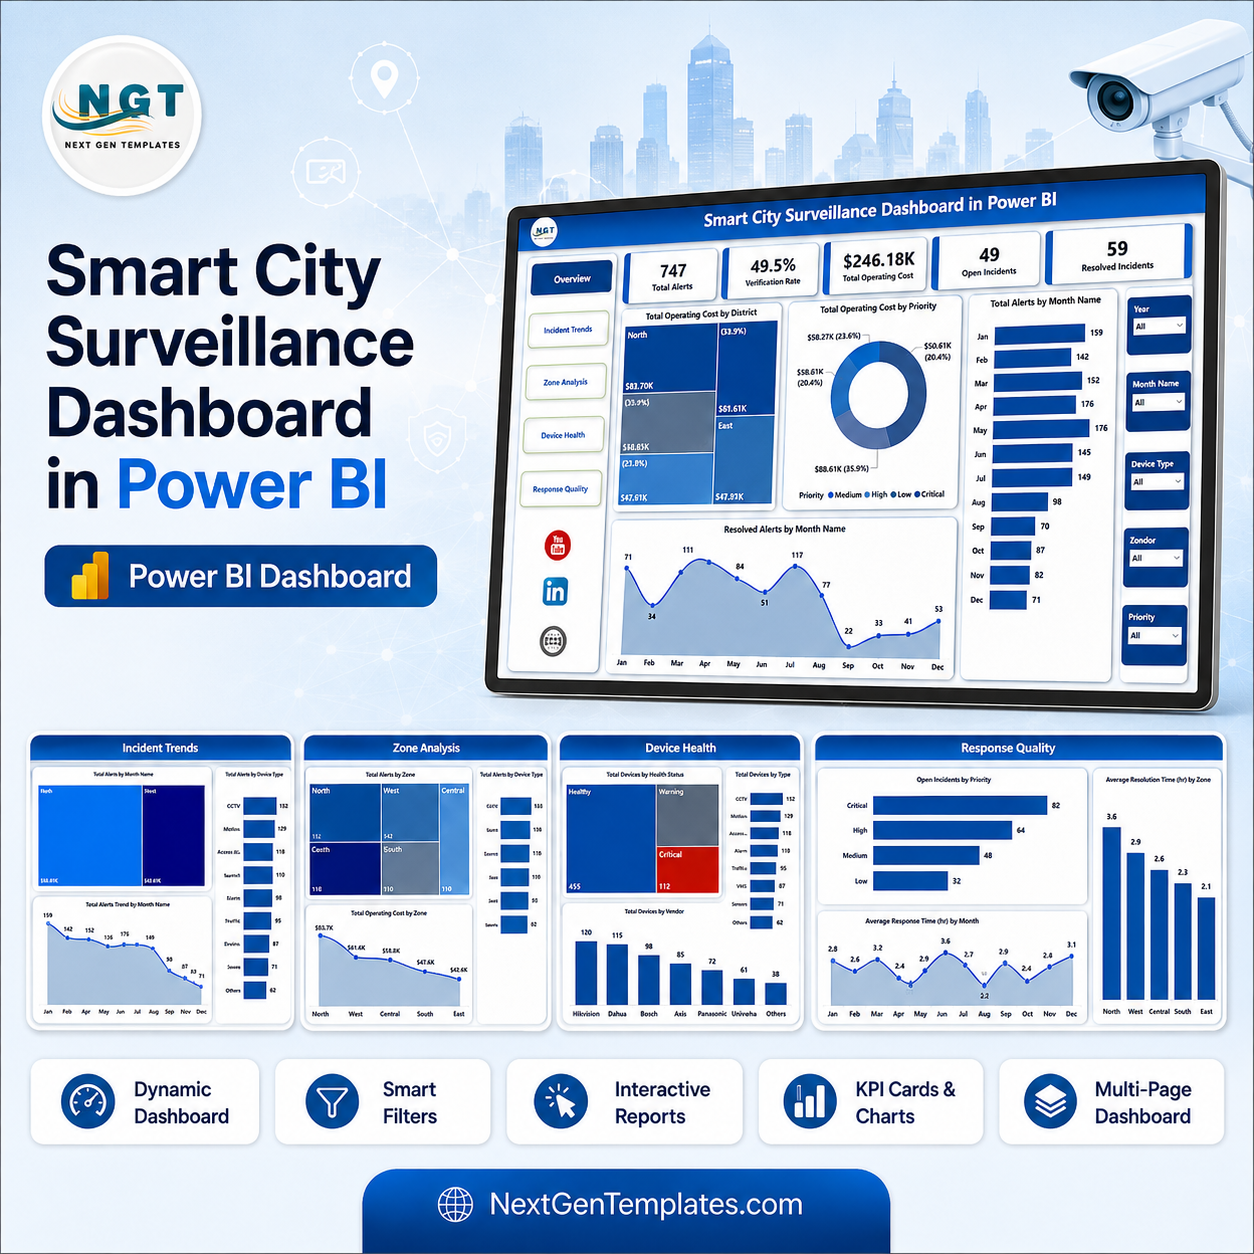
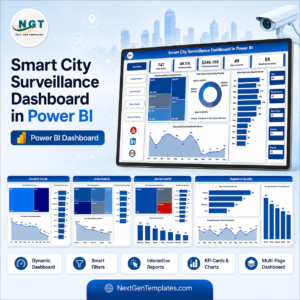
Smart City Surveillance Dashboard in Power BI is a ready-to-use report template for city surveillance teams, command centers, CCTV operations, security vendors, and public safety analysts. The report gives 5 Power BI pages, 5 top-level KPI cards, 15 operational charts, and slicer-led filtering for fast review. At the sale price of $17.99, it gives teams a one-time purchase option instead of a monthly BI or security reporting subscription. Use it to track verified alerts, verification rate, total operating cost, open incidents, escalated incidents, response time, district performance, vendor output, device health, and incident quality from one editable .pbix file.
Key Features of Smart City Surveillance Dashboard in Power BI
- 5 Power BI report pages: Overview, Incident Trends, Zone Analysis, Device Health, and Response Quality.
- High-level KPI cards for Verified Alerts, Verification Rate, Total Operating Cost, Open Incidents, and Escalated Incidents.
- Charts for district, zone, vendor, device type, priority, month, shift, and incident type analysis.
- Slicers for quickly filtering the dashboard and reviewing selected segments.
- Editable Power BI file so you can replace sample data with your own surveillance records.
- Built for security, government, smart city, and public safety reporting workflows.
What’s Inside the Smart City Surveillance Dashboard in Power BI
Overview Page
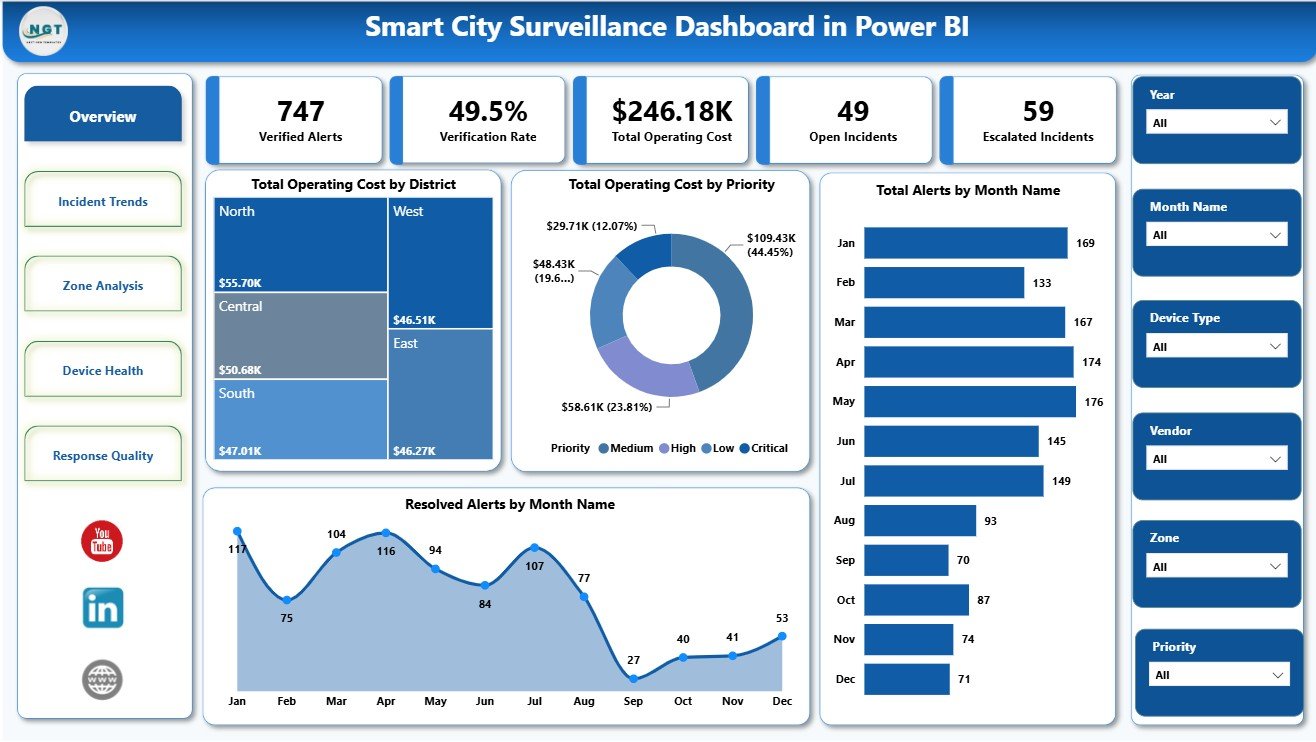
The Overview page starts with KPI cards for Verified Alerts, Verification Rate, Total Operating Cost, Open Incidents, and Escalated Incidents. These cards help decision makers see the current state of alert verification, cost pressure, and unresolved security workload before moving into deeper analysis.
Total Operating Cost by District: This chart compares cost across districts so managers can see which areas are consuming the largest operating budget. It is useful for reviewing staffing, camera coverage, maintenance pressure, and response intensity by location.
Total Operating Cost by Priority: This visual breaks cost by priority level so teams can understand whether high-priority incidents are driving most spend. It helps separate routine monitoring cost from urgent response cost.
Total Alerts by Month Name: This monthly trend shows how alert volume changes across the reporting period. It helps identify seasonal spikes, campaign effects, recurring public safety issues, or operational anomalies.
Resolved Alerts by Month Name: This chart tracks resolved alert count by month. It helps managers compare alert inflow against closure activity and spot months where resolution capacity may need attention.
Incident Trends
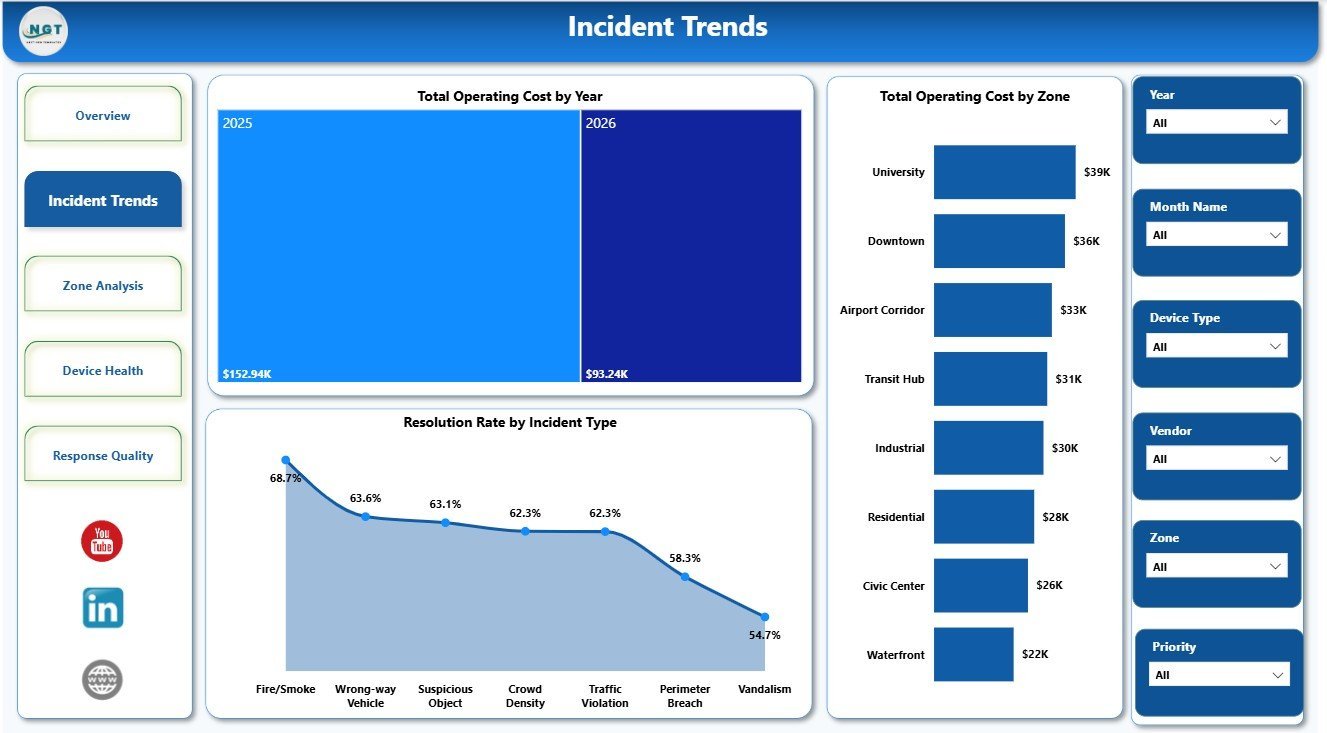
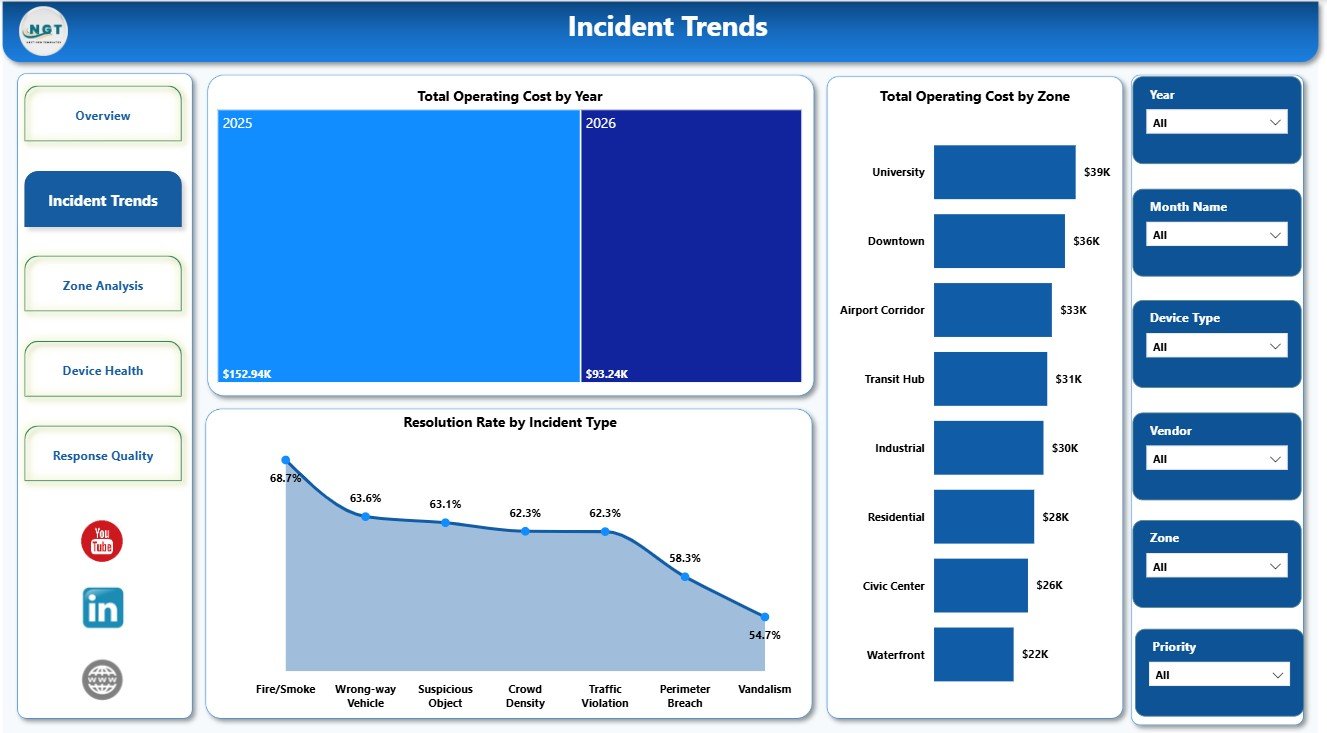
The Incident Trends page includes Total Operating Cost by Year, Total Operating Cost by Zone, and Resolution Rate by Incident Type. These visuals help teams understand long-term cost movement, compare zones, and find which incident types are being resolved more consistently.
Zone Analysis
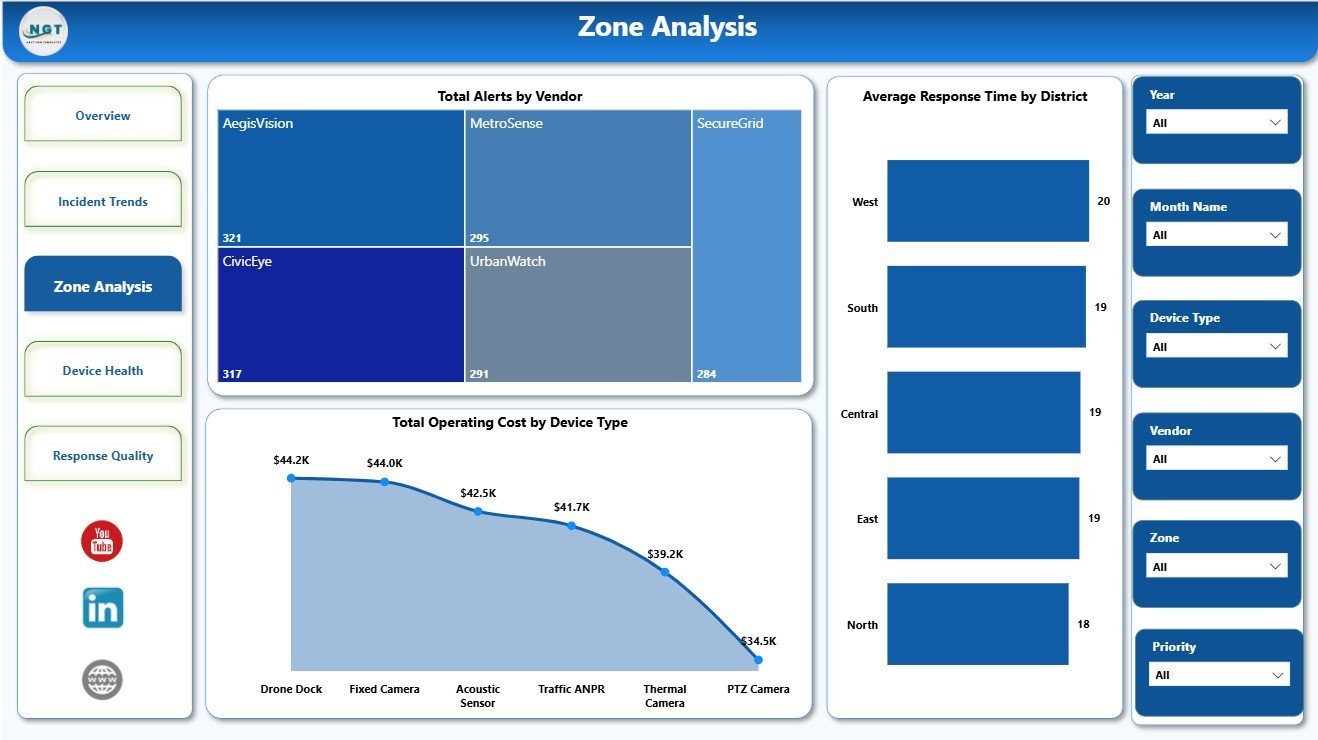
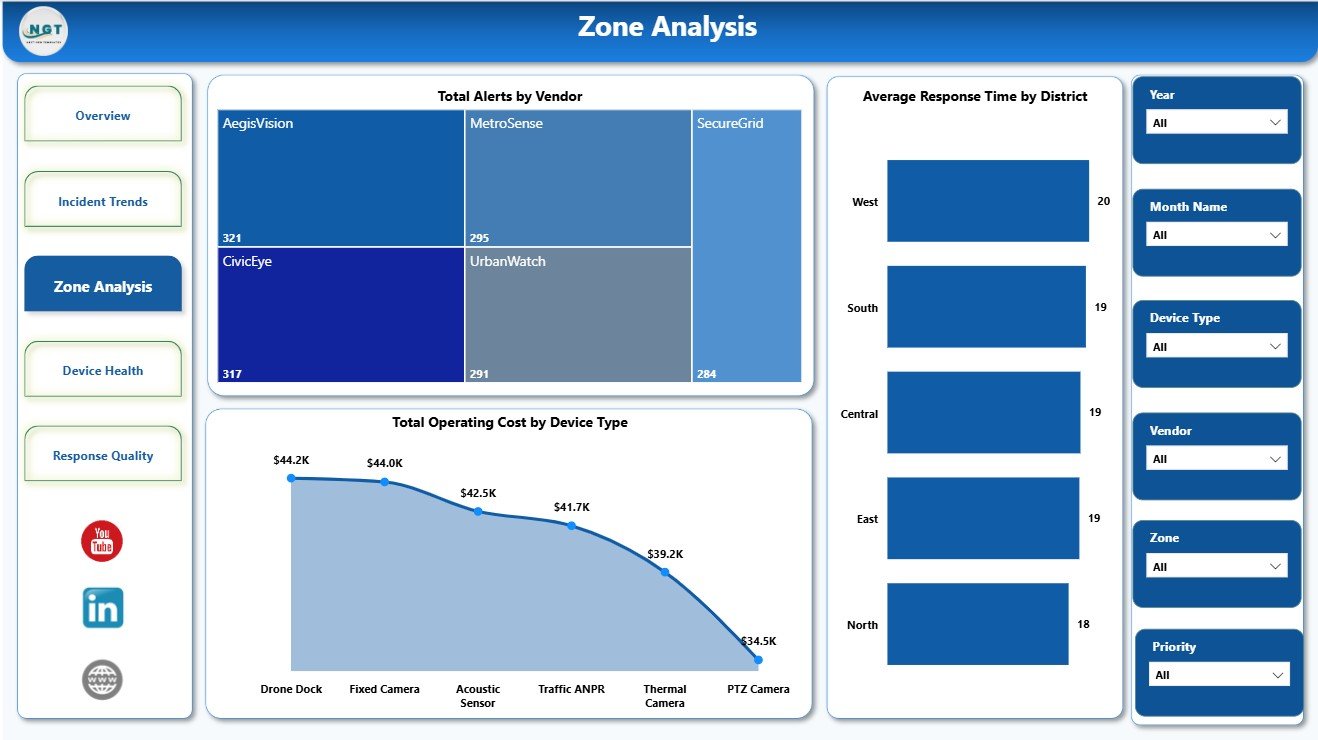
The Zone Analysis page reviews Total Alerts by Vendor, Average Response Time by District, and Total Operating Cost by Device Type. It helps users compare vendor alert load, identify districts with slower response, and evaluate whether certain device types carry higher operating costs.
Device Health
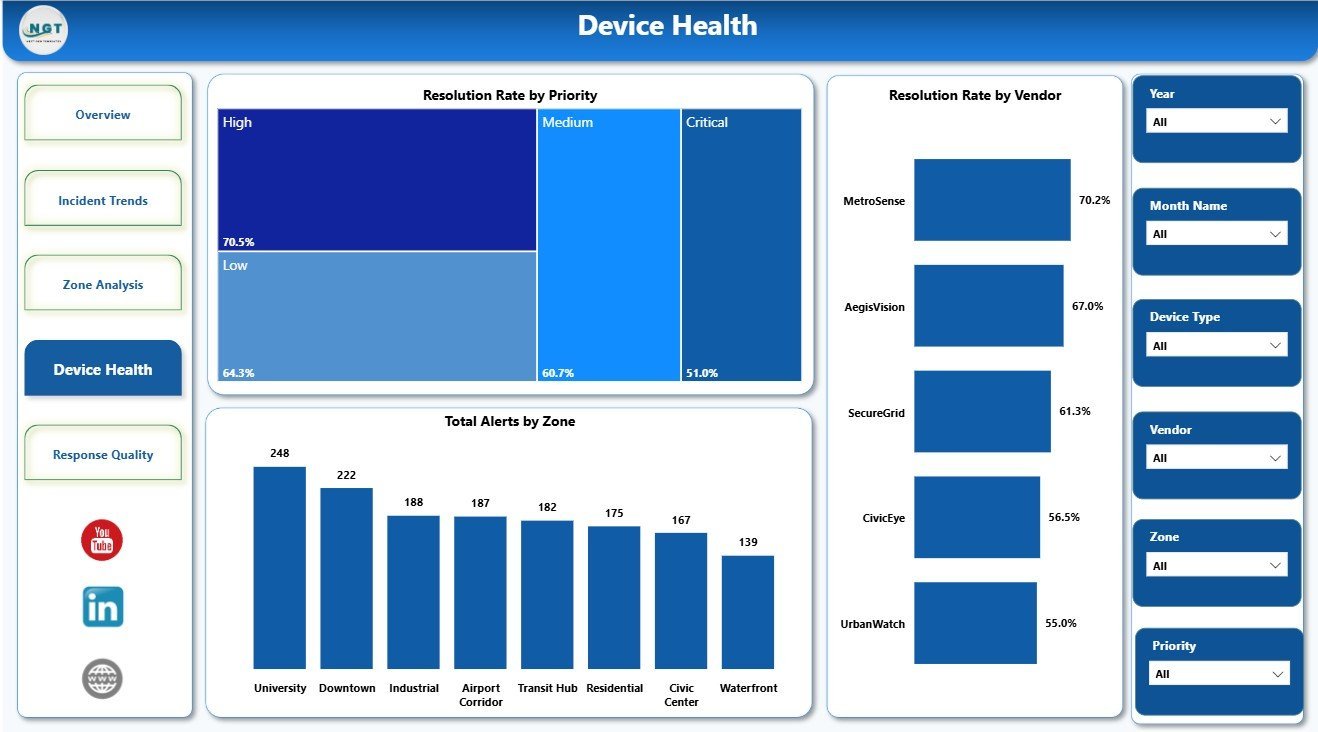
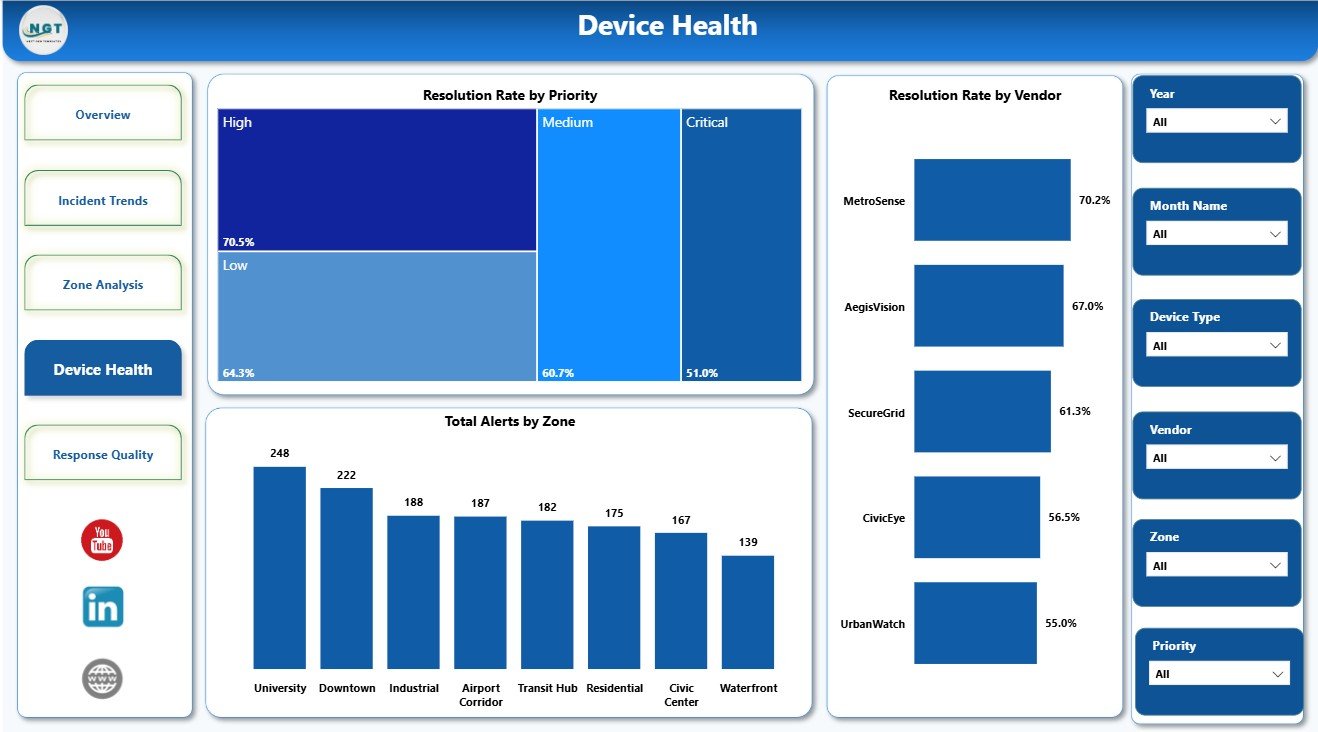
The Device Health page includes Resolution Rate by Priority, Resolution Rate by Vendor, and Total Alerts by Zone. It supports quick review of alert closure quality across vendors, priorities, and geographic zones.
Response Quality
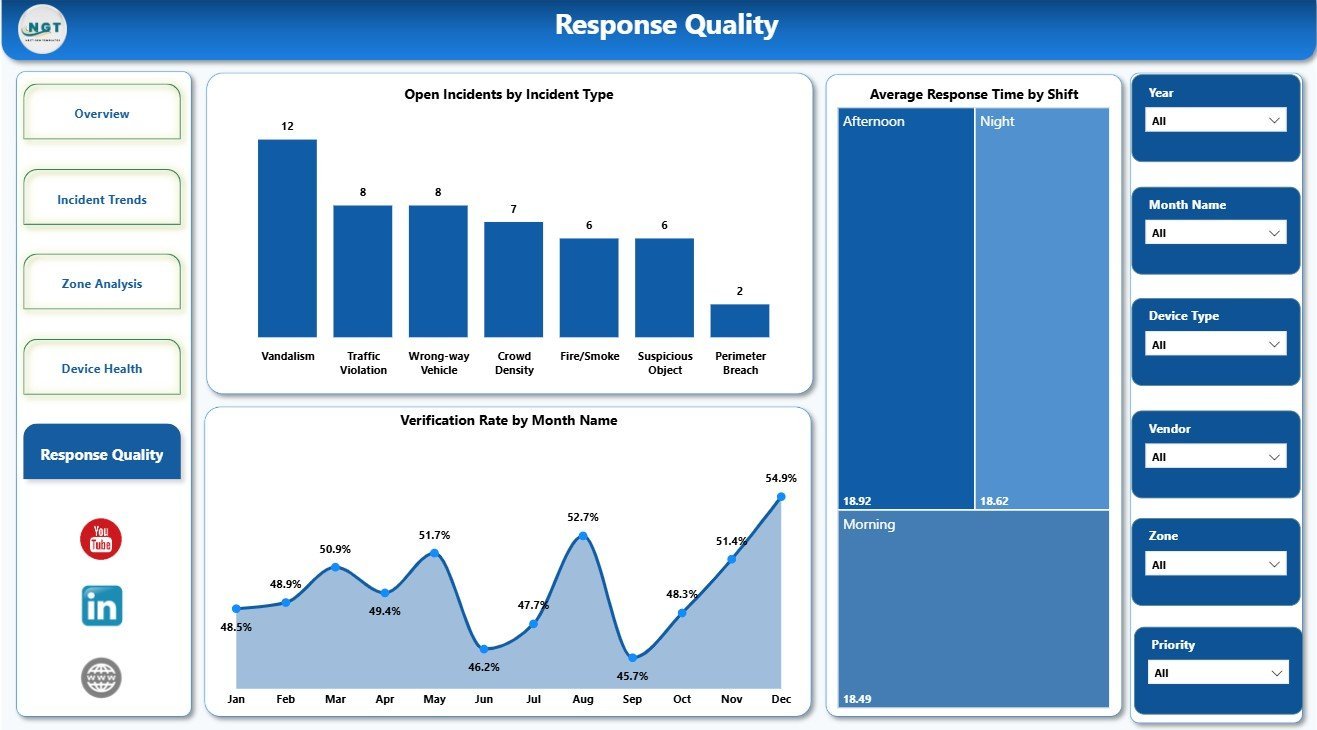
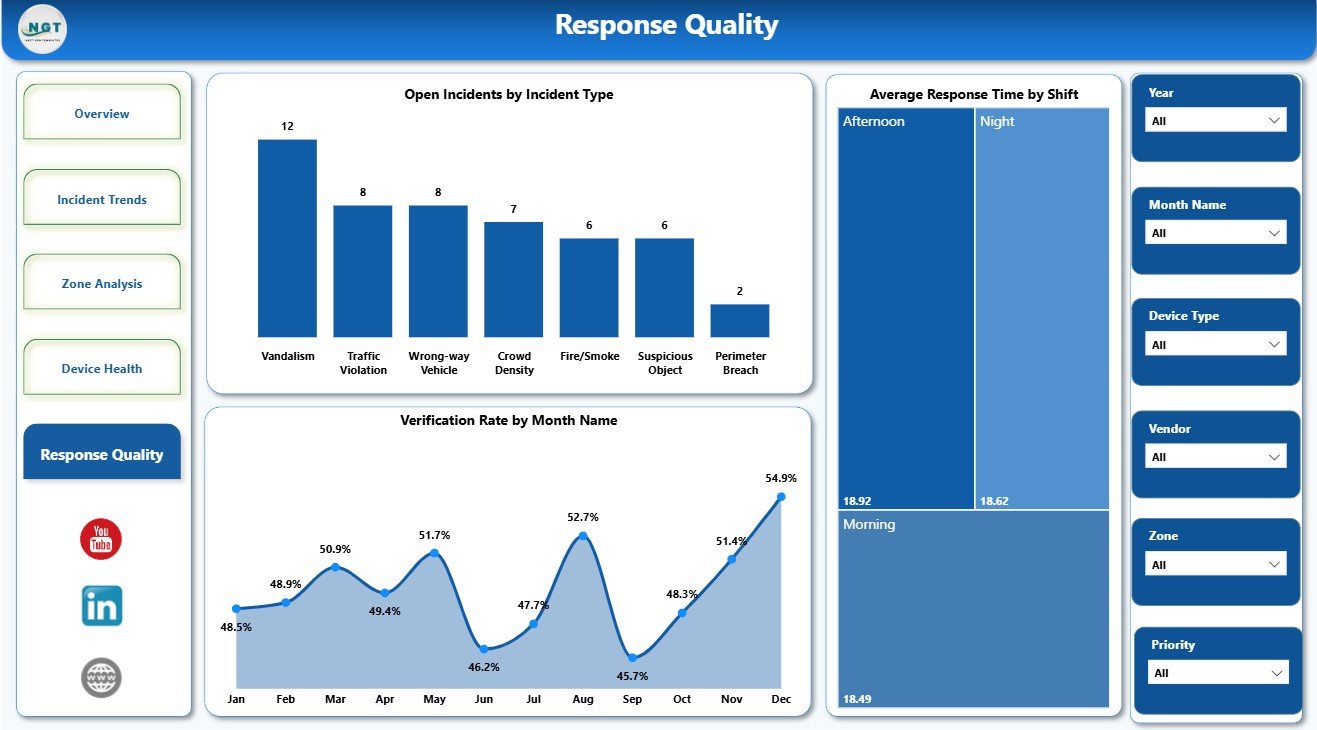
The Response Quality page focuses on Open Incidents by Incident Type, Average Response Time by Shift, and Verification Rate by Month Name. It is useful for reviewing where incidents remain open, which shifts respond fastest, and whether verification quality is improving over time.
Smart City Surveillance Dashboard in Power BI vs. Tableau vs. Paid Security SaaS – Where This Fits
| Feature | This Power BI template | Tableau alternative | Paid security SaaS |
|---|---|---|---|
| Cost | $17.99 one-time sale price | License and build time | Recurring subscription |
| Platform | Power BI Desktop | Tableau Desktop or Server | Vendor cloud platform |
| Setup time | Open .pbix and replace sample data | Requires dashboard build | Requires onboarding |
| Customizable fields | Editable model and visuals | Editable with Tableau skills | Limited by vendor settings |
| Live camera monitoring | No | No | Possible in specialist platforms |
| Year-1 cost at 5 users | Template cost plus Power BI licensing if sharing online | Usually higher | Usually much higher |
Who This Template Is For – and Who It’s Not For
This dashboard is for smart city operations teams, municipal safety analysts, security operations centers, CCTV monitoring vendors, and consultants who need a Power BI reporting layer for surveillance alerts. It is not a live CCTV feed, dispatch system, case management app, or automated incident routing platform.
How to Use the Smart City Surveillance Dashboard in Power BI
- Download and unzip the file.
- Open the .pbix file in Power BI Desktop.
- Review the sample data structure and replace it with your own surveillance data source.
- Refresh the report and check each page for updated metrics.
- Use slicers to review districts, zones, vendors, priorities, incident types, shifts, months, and device categories.
Real-World Use Cases
Municipal command center lead: reviews verified alerts, open incidents, escalations, and cost before the weekly safety briefing.
Security vendor manager: compares resolution rates, alert volume, and response time by vendor, zone, and shift.
Public safety analyst: uses the trend pages to identify costly districts, slow-response areas, and recurring incident types.
Frequently Asked Questions
Do I need Power BI Desktop?
Yes. Open the .pbix file in Power BI Desktop, which is free from Microsoft.
Can I replace the sample data?
Yes. The template is designed so you can connect or replace the sample data with your own surveillance records.
Does this include live CCTV monitoring?
No. This is a Power BI analytics dashboard for alert, incident, cost, response, and device reporting.
How many pages are included?
The report includes 5 pages: Overview, Incident Trends, Zone Analysis, Device Health, and Response Quality.
Can I filter the report?
Yes. The dashboard includes slicers for quick filtering and focused review.
Is there an Excel version?
Yes. You can also review the Smart City Surveillance Dashboard in Excel.
About the Author
Built by PK – Microsoft Certified Professional with 15+ years of Excel, Google Sheets, and Power BI experience. Founder of NextGenTemplates, reaching 300K+ subscribers across YouTube channels. Every template is hand-built and tested before release.
Explore Related Templates
- Smart City Surveillance Dashboard in Excel
- AI Chatbot Providers Dashboard in Power BI
- Power BI Dashboard templates
- Power BI templates
Download the Smart City Surveillance Dashboard in Power BI today and start reviewing alert verification, incident trends, operating cost, device health, and response quality in Power BI.
Last updated: August 12, 2026.





























Reviews
There are no reviews yet.