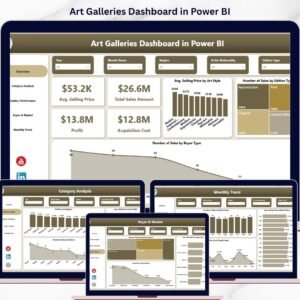

Want to turn scattered gallery data into powerful business insights? The Art Galleries Dashboard in Power BI is a ready-to-use solution designed to help gallery owners, managers, curators, and analysts track sales, profit, buyer trends, acquisition cost, and monthly performance from one interactive dashboard. Instead of wasting time with disconnected spreadsheets and manual reports, you can monitor your gallery’s performance with clear visuals, smart charts, and decision-ready KPIs. This dashboard helps you understand what sells, who buys, which exhibitions perform best, and where your costs are rising. If you want to improve pricing, strengthen planning, and grow your gallery with confidence, this dashboard is the smart tool you need.
Key Features of Art Galleries Dashboard in Power BI
🎨 Interactive 5-Page Dashboard
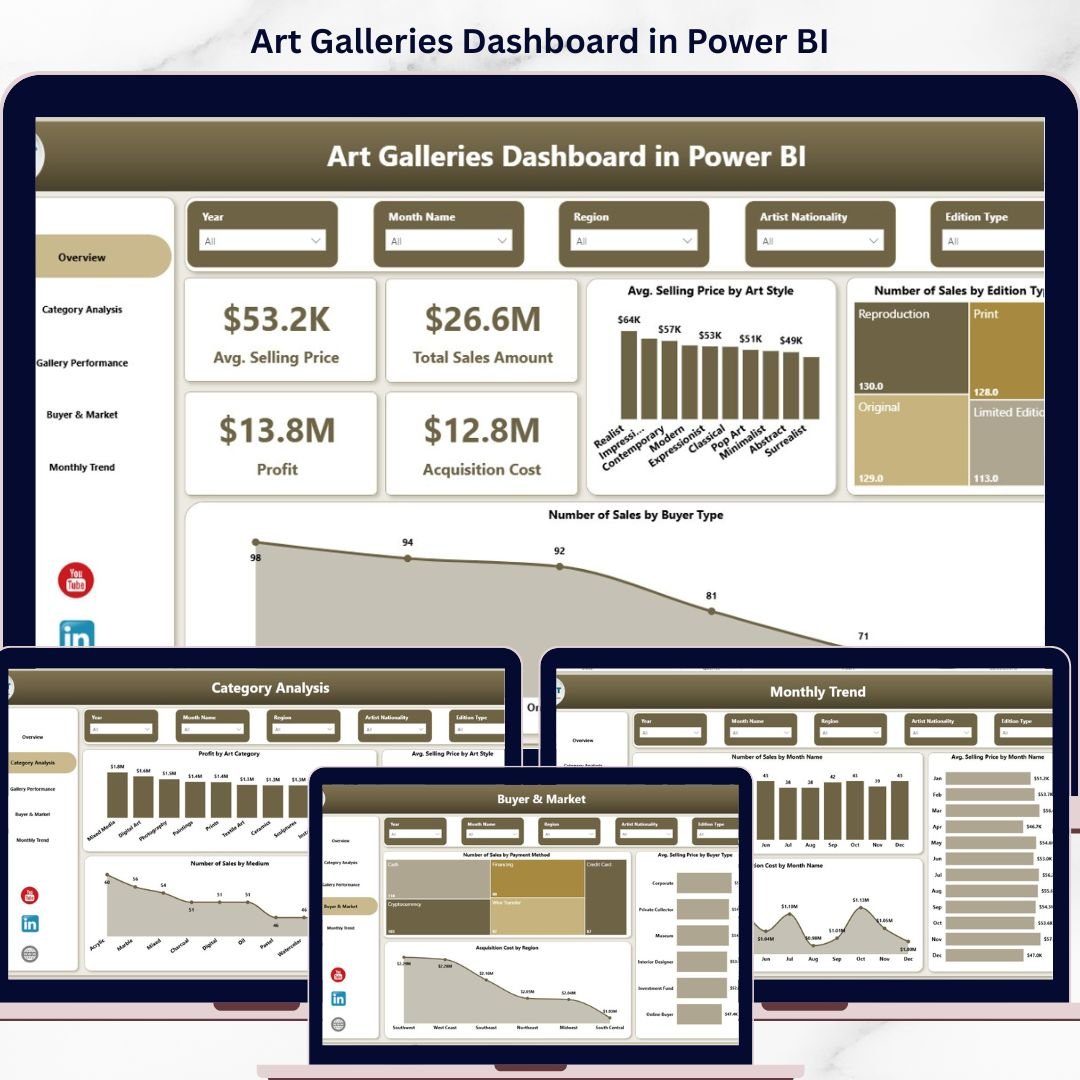
This dashboard comes with 5 professionally designed pages that cover every major part of your gallery business, from financial performance to buyer behavior and monthly trends.
💰 Powerful KPI Cards
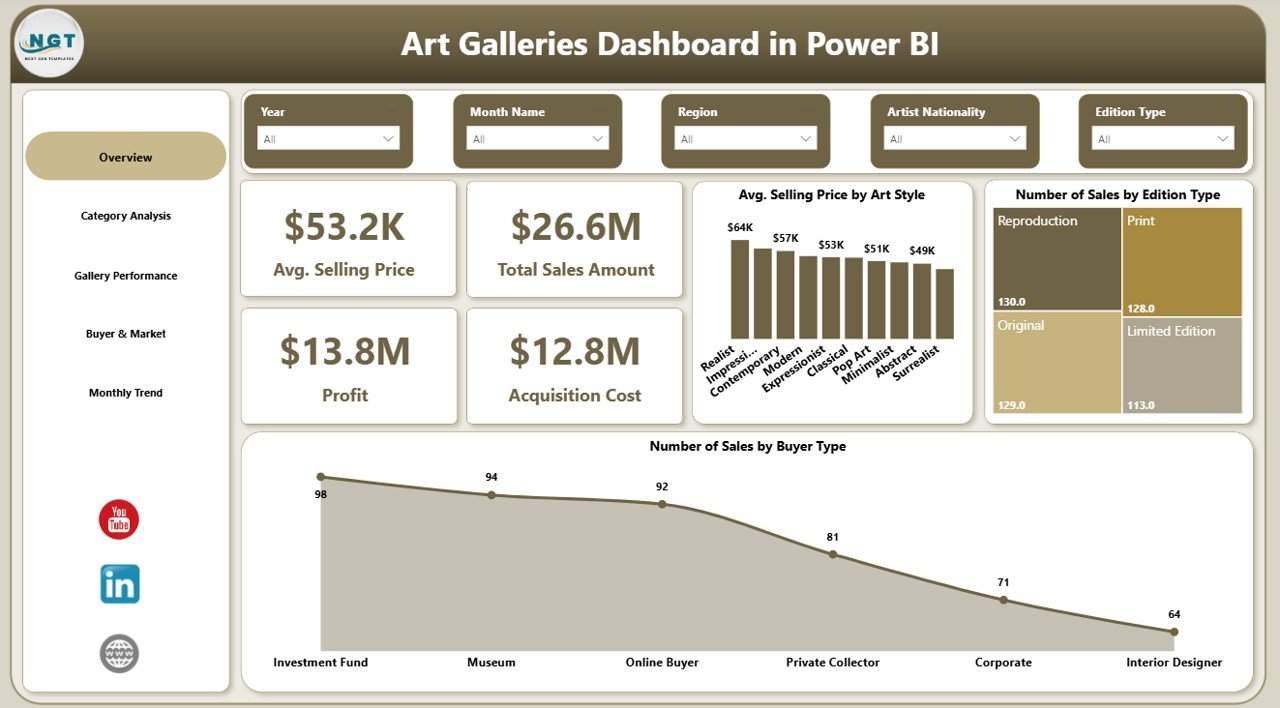
Track your most important metrics at a glance, including Average Selling Price, Total Sales Amount, Profit, and Acquisition Cost.
📊 Visual Sales and Profit Analysis
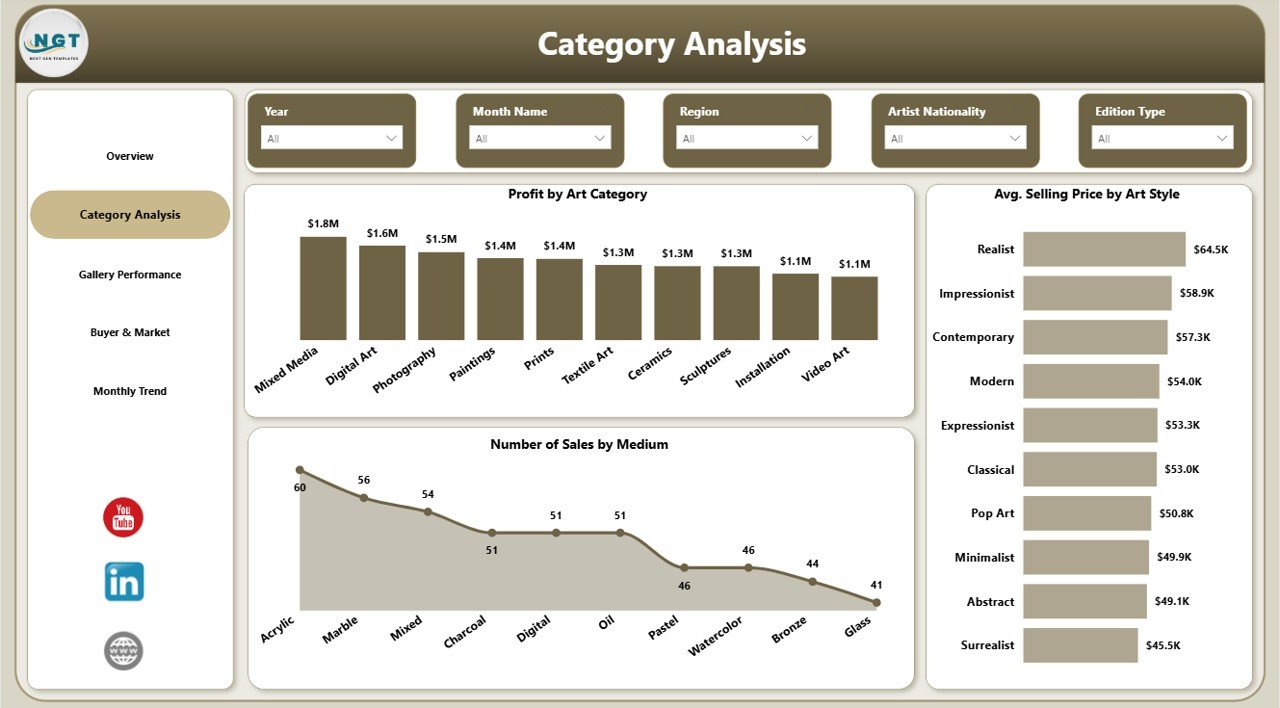
Understand performance through charts such as Average Selling Price by Art Style, Profit by Art Category, and Number of Sales by Medium.
🖼️ Gallery and Exhibition Insights
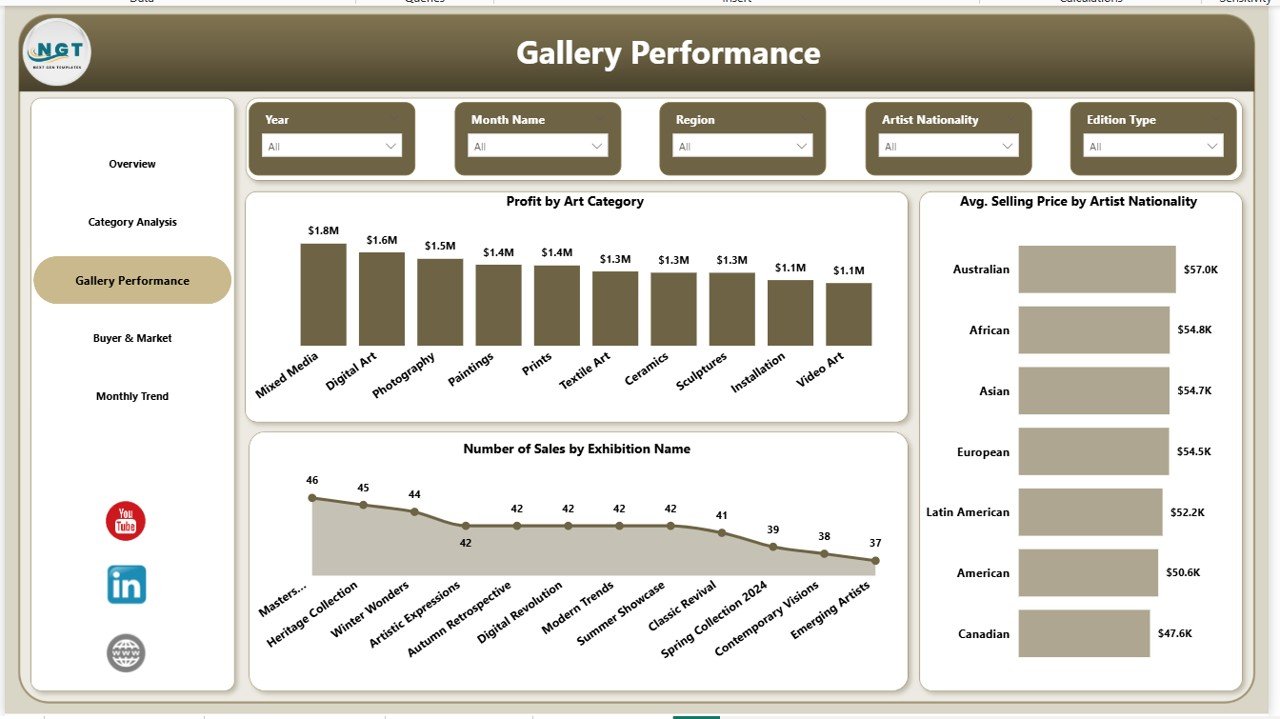
Analyze which exhibitions perform better, which artist nationalities attract higher prices, and which art categories generate stronger profit.
👥 Buyer and Market Analysis
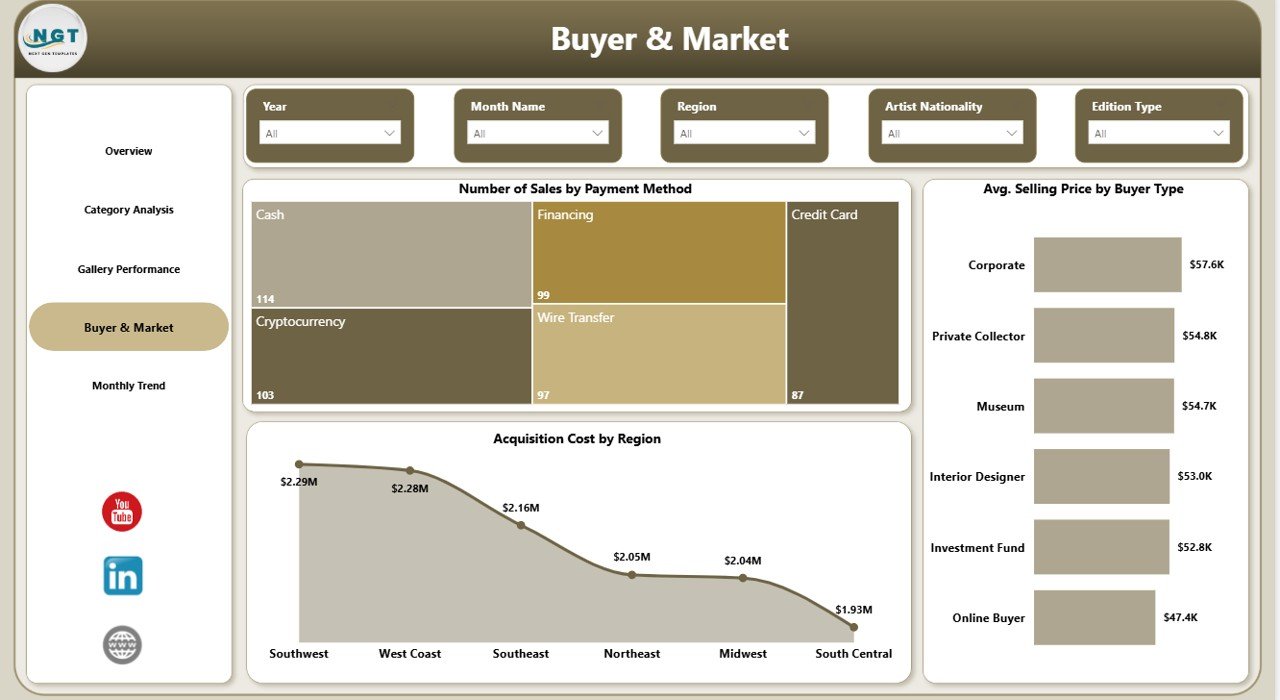
Explore Number of Sales by Payment Method, Average Selling Price by Buyer Type, and Acquisition Cost by Region to better understand buyers and market patterns.
📅 Monthly Trend Tracking
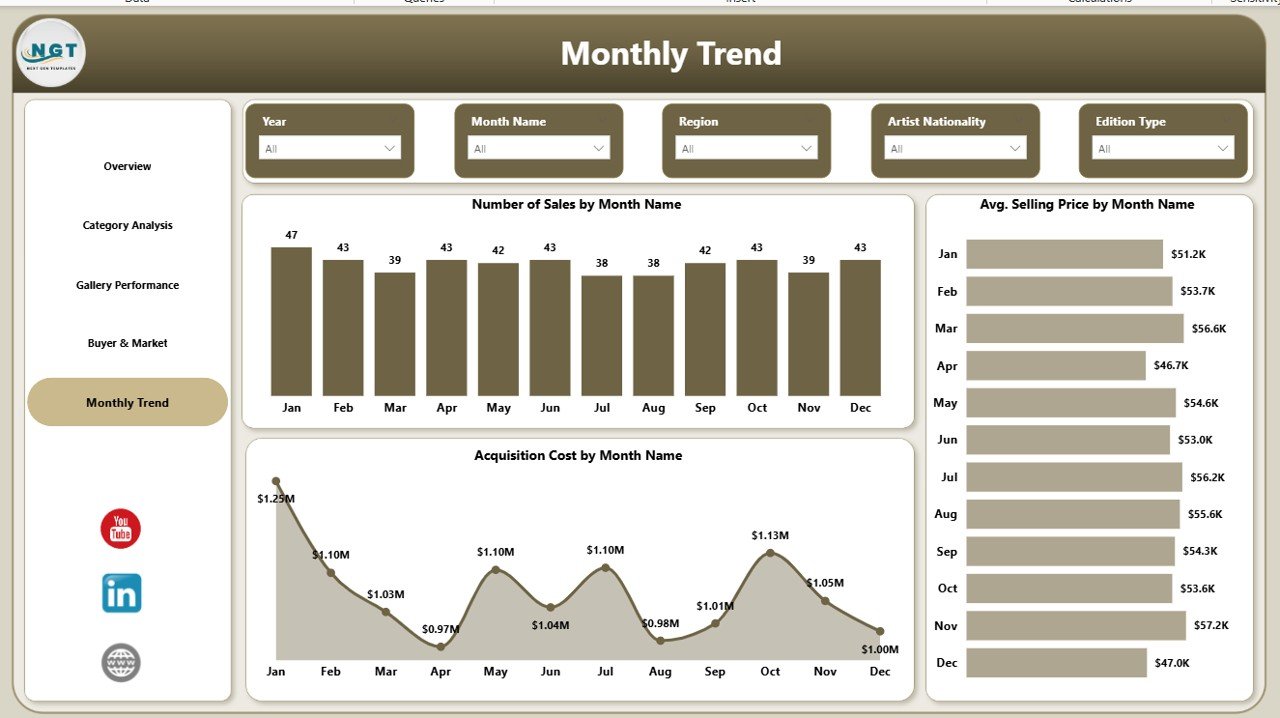
Monitor Number of Sales, Average Selling Price, and Acquisition Cost by Month to identify seasonal patterns and improve future planning.
⚡ Easy-to-Use Power BI Experience
Use slicers, filters, and interactive visuals to review your data from multiple angles without touching the raw dataset.
What’s Inside the Art Galleries Dashboard in Power BI
🧾 Overview Page
Get a quick snapshot of your gallery’s overall performance with KPI cards and high-level visuals.
🎭 Category Analysis Page
Review Profit by Art Category, Average Selling Price by Art Style, and Number of Sales by Medium to understand which artistic segments perform best.
🏛️ Gallery Performance Page
Track Profit by Art Category, Average Selling Price by Artist Nationality, and Number of Sales by Exhibition Name for deeper gallery-level insights.
🌍 Buyer & Market Page
See how buyer behavior and market conditions affect sales performance and acquisition spending.
📈 Monthly Trend Page
Analyze changes over time and discover when your gallery performs best during the year.
How to Use the Art Galleries Dashboard in Power BI
✅ Prepare your gallery data in a clean and structured format.
✅ Include fields like art style, category, medium, exhibition name, buyer type, payment method, region, sales amount, and acquisition cost.
✅ Connect the data to Power BI and refresh the dashboard.
✅ Start with the Overview Page for a quick business snapshot.
✅ Move to the detailed pages to explore categories, buyers, gallery performance, and monthly trends.
✅ Use the insights to improve pricing, reduce unnecessary costs, plan exhibitions better, and target the right buyers.
Because the dashboard is visual and interactive, you can move from raw data to action in just a few clicks.
Who Can Benefit from This Art Galleries Dashboard in Power BI
👑 Gallery Owners who want better control over sales, profit, and acquisition spending.
📋 Gallery Managers who need clear reporting for operations and performance review.
🧠 Business Analysts who want faster access to meaningful gallery insights.
🖌️ Curators who need category, exhibition, and artist-related performance data.
🤝 Sales Teams who want to understand buyer behavior and improve sales targeting.
📣 Marketing Teams who want to use buyer and market insights for smarter campaigns.
This dashboard is perfect for art galleries that want to stop guessing and start making data-driven decisions.
Click hare to read the Detailed blog post
Watch the step-by-step video tutorial:
Learn more about the full dashboard features, benefits, and use cases in our detailed blog post.
Visit our YouTube channel to learn step-by-step video tutorials
Explore helpful tutorials, dashboard demos, and practical reporting ideas to get the most from your Power BI and Excel tools.
Compatibility and Requirements
- Works in Power BI Desktop, which is free to download from Microsoft. Get it from Get Power BI Desktop.
- Your gallery data needs fields such as art style, category, medium, exhibition name, buyer type, payment method, region, sales amount and acquisition cost.
Frequently Asked Questions
How many pages does the dashboard have?
Five pages: Overview, Category Analysis, Gallery Performance, Buyer & Market and Monthly Trend.
Which KPIs does it show?
Average Selling Price, Total Sales Amount, Profit and Acquisition Cost, shown as KPI cards on the Overview page.
What data do I need to prepare?
A clean table with art style, category, medium, exhibition name, buyer type, payment method, region, sales amount and acquisition cost. Connect it to Power BI and refresh the dashboard.
Can I see which exhibitions perform best?
Yes. The Gallery Performance page shows Number of Sales by Exhibition Name, along with Profit by Art Category and Average Selling Price by Artist Nationality.
Can I track seasonal patterns?
Yes. The Monthly Trend page shows Number of Sales, Average Selling Price and Acquisition Cost by Month.
Related Templates
- Power BI Dashboard Mega Collection: 15 Power BI dashboard templates in one download
- Marketing and Social Media Analytics Kit: includes Power BI templates for campaign and audience reporting
- Retail & Store Analytics Bundle: sales and store reporting templates for Excel and Google Sheets
- NextGen Ultimate Business Bundle: 25 templates across Excel, Power BI and Google Sheets
Browse all Power BI dashboards or see the Power BI KPI dashboards.