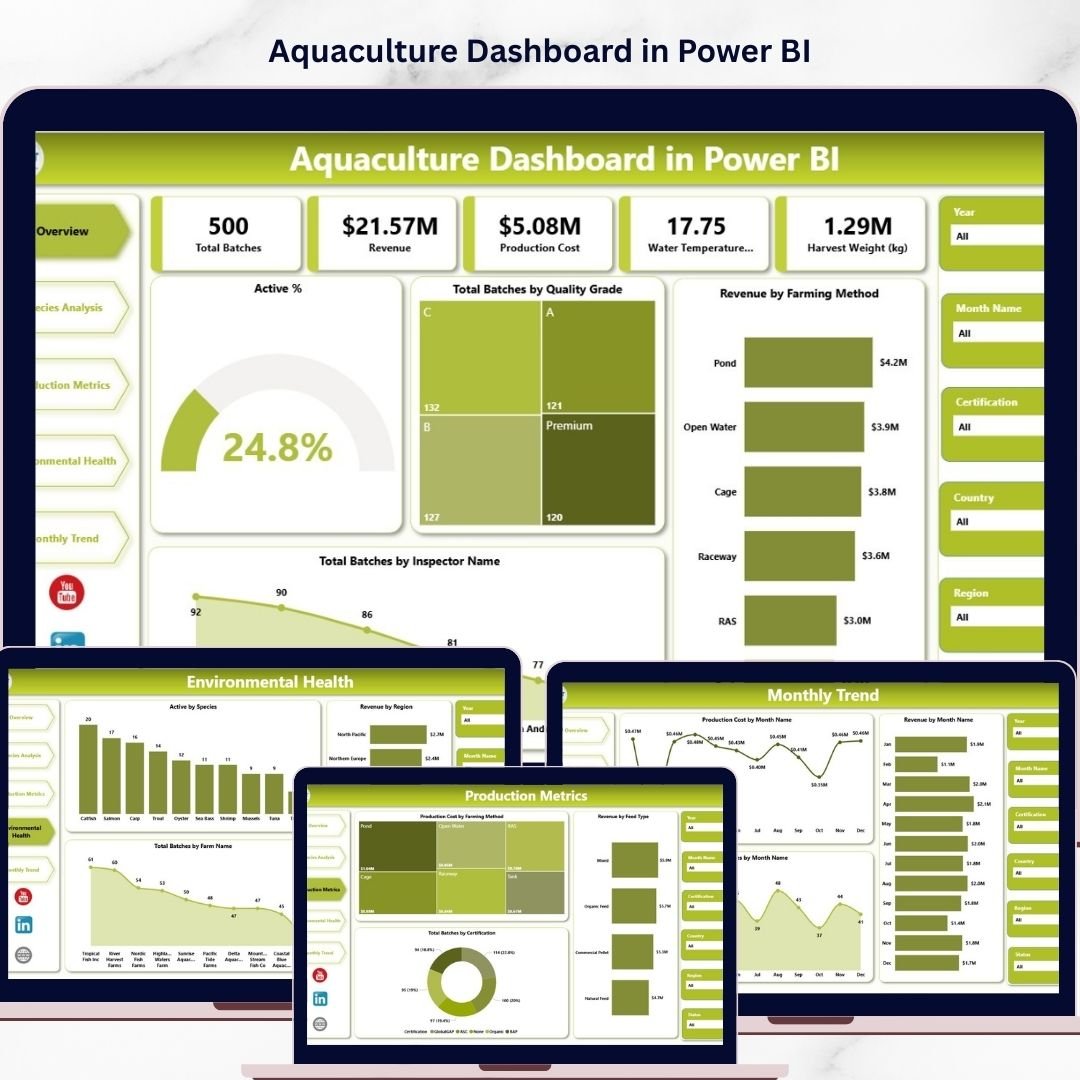

Aquaculture Dashboard has become one of the fastest-growing sectors in the global food industry. As seafood consumption increases worldwide, aquaculture farms must manage production efficiently while maintaining environmental sustainability and profitability. Modern aquaculture operations involve monitoring multiple variables such as species growth, feed performance, disease outbreaks, water conditions, production costs, and revenue generation.
However, many aquaculture farms still rely on scattered spreadsheets and manual reports to track their operational data. As a result, managers often struggle to analyze production performance, identify cost inefficiencies, and respond quickly to environmental risks.
To solve this challenge, many aquaculture businesses are adopting data-driven dashboards that centralize farm data and transform it into actionable insights. One powerful analytical solution is the Aquaculture Dashboard in Power BI.
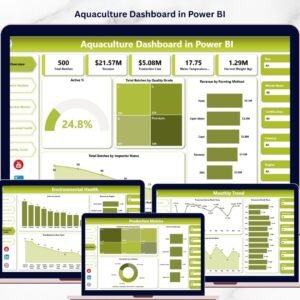
The Aquaculture Dashboard in Power BI is a ready-to-use interactive business intelligence solution designed to help aquaculture businesses monitor production, analyze farm performance, evaluate species profitability, and track environmental conditions in real time. By leveraging Microsoft Power BI’s powerful data visualization capabilities, this dashboard converts raw aquaculture data into clear charts, KPIs, and interactive reports.
Instead of manually reviewing multiple datasets, farm managers can view all critical aquaculture metrics in a single centralized dashboard. With interactive slicers and dynamic visuals, users can filter data by species, farm location, region, farming method, or month.
This dashboard is particularly valuable for farms that cultivate multiple species or operate across multiple locations. It helps managers evaluate production efficiency, species performance, cost structures, and revenue trends simultaneously.
The dashboard includes five analytical pages, each designed to provide insights into different operational areas such as production metrics, environmental health, and seasonal trends.
Whether you manage fish farms, shrimp farms, aquaculture hatcheries, or multi-species aquaculture operations, this Power BI dashboard provides a comprehensive analytics system to monitor farm operations and improve decision-making.
By transforming complex aquaculture datasets into intuitive visual insights, this dashboard empowers managers to optimize production strategies, reduce operational risks, control costs, and increase farm profitability.
🚀 Key Feature of Aquaculture Dashboard in Power BI
📊 Interactive Aquaculture Analytics Dashboard
Visualize farm production, revenue performance, and environmental metrics through dynamic Power BI visuals.
🐟 Species Performance Analysis
Compare production cost, revenue, and batch volume across different aquatic species.
💰 Revenue & Profit Monitoring
Track financial performance across farming methods, regions, and species.
📦 Production Batch Tracking
Monitor production batches and evaluate output efficiency.
🌿 Environmental Health Insights
Analyze environmental conditions and species activity levels across farms.
📈 Farming Method Comparison
Evaluate cost efficiency and revenue performance for different aquaculture techniques.
📅 Monthly Production Trend Analysis
Track seasonal trends in production, revenue, and operational costs.
🎛 Dynamic Filters & Slicers
Analyze farm data instantly by species, region, farm name, or month.
📊 Power BI Interactive Visualizations
Convert raw aquaculture data into easy-to-understand charts and insights.
⚙️ Flexible Data Integration
Connect Power BI with Excel files or databases to automatically refresh dashboard insights.
📊 What’s Inside the Aquaculture Dashboard in Power BI
The dashboard contains five analytical pages designed to provide a comprehensive view of aquaculture operations.
🏠 Overview Page – Farm Performance Snapshot
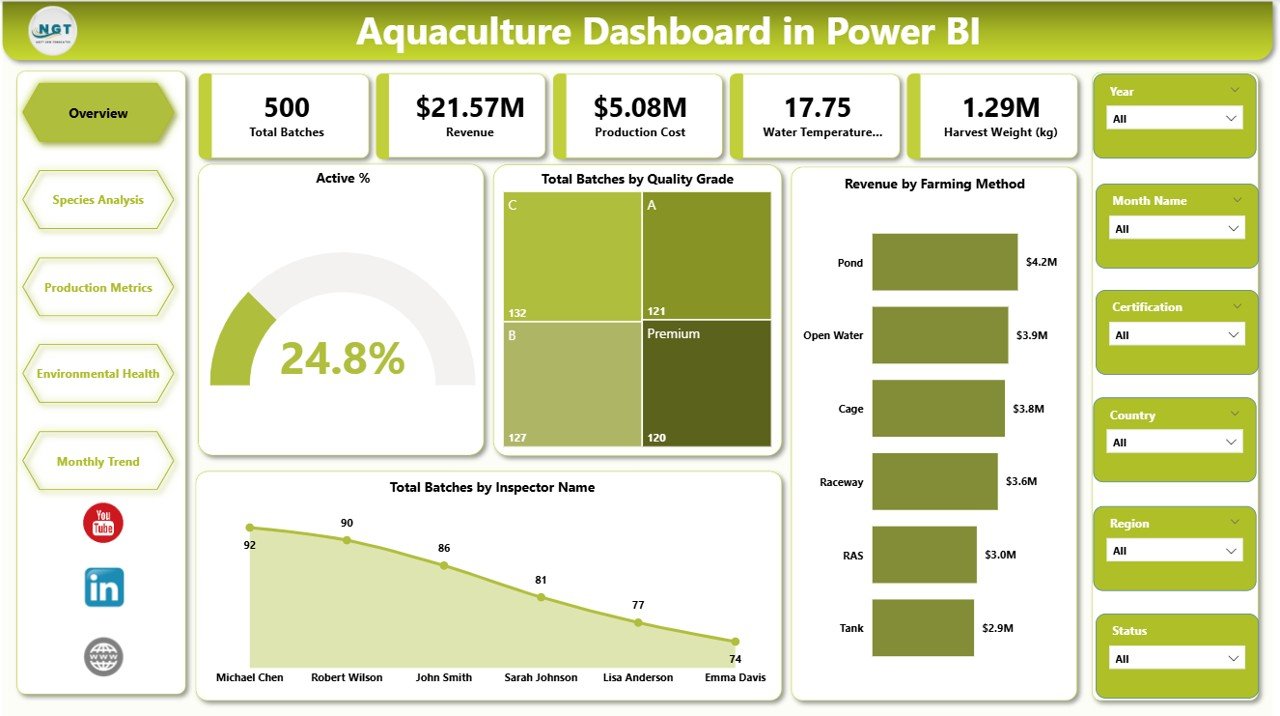
The Overview Page serves as the main dashboard that provides a high-level summary of aquaculture operations.
This page contains KPI cards and charts that quickly highlight farm performance.
Key KPI indicators include:
• Active % – Percentage of currently active aquaculture batches
• Total Batches by Quality Grade – Distribution of batches by product quality
• Revenue by Farming Method – Revenue generated from different aquaculture techniques
• Total Batches by Inspector Name – Distribution of inspections across farms
These insights allow managers to quickly understand operational performance.
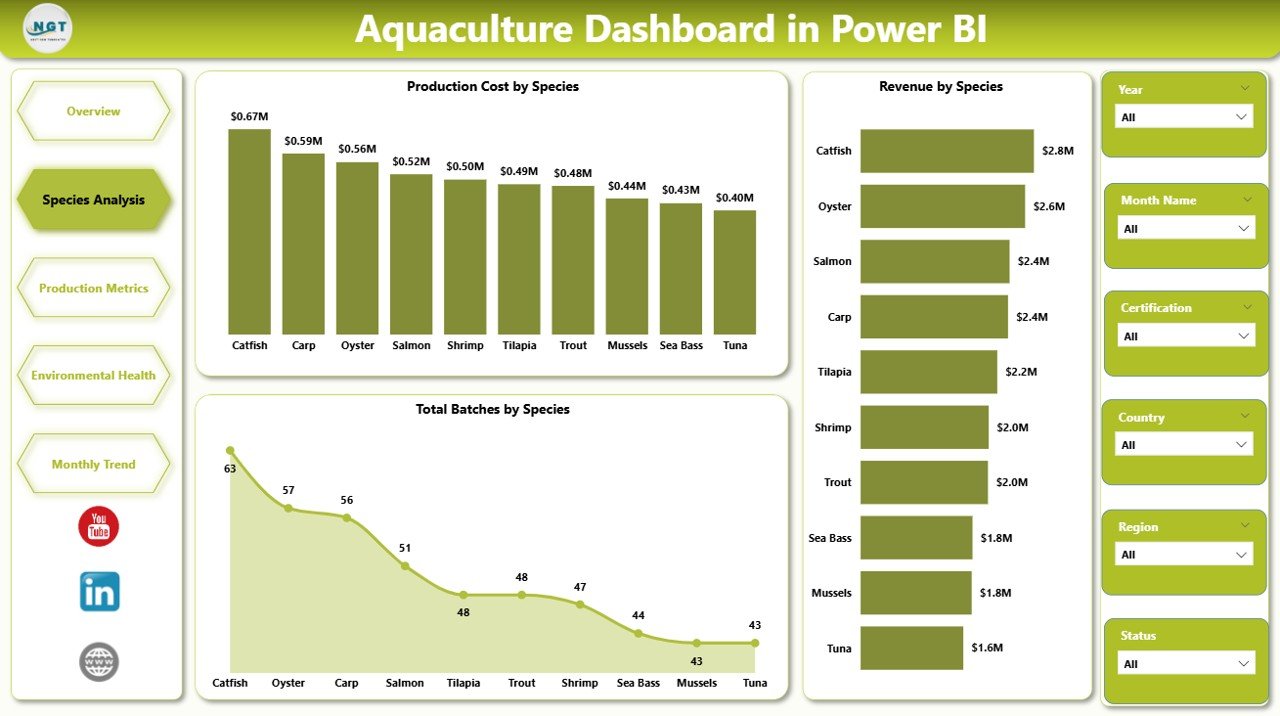
🐟 Species Analysis Page
Aquaculture farms often cultivate multiple species such as tilapia, shrimp, salmon, or carp.
The Species Analysis Page helps managers compare species performance.
Charts included:
• Production Cost by Species
• Revenue by Species
• Total Batches by Species
These insights help farm managers identify high-profit species and optimize production planning.
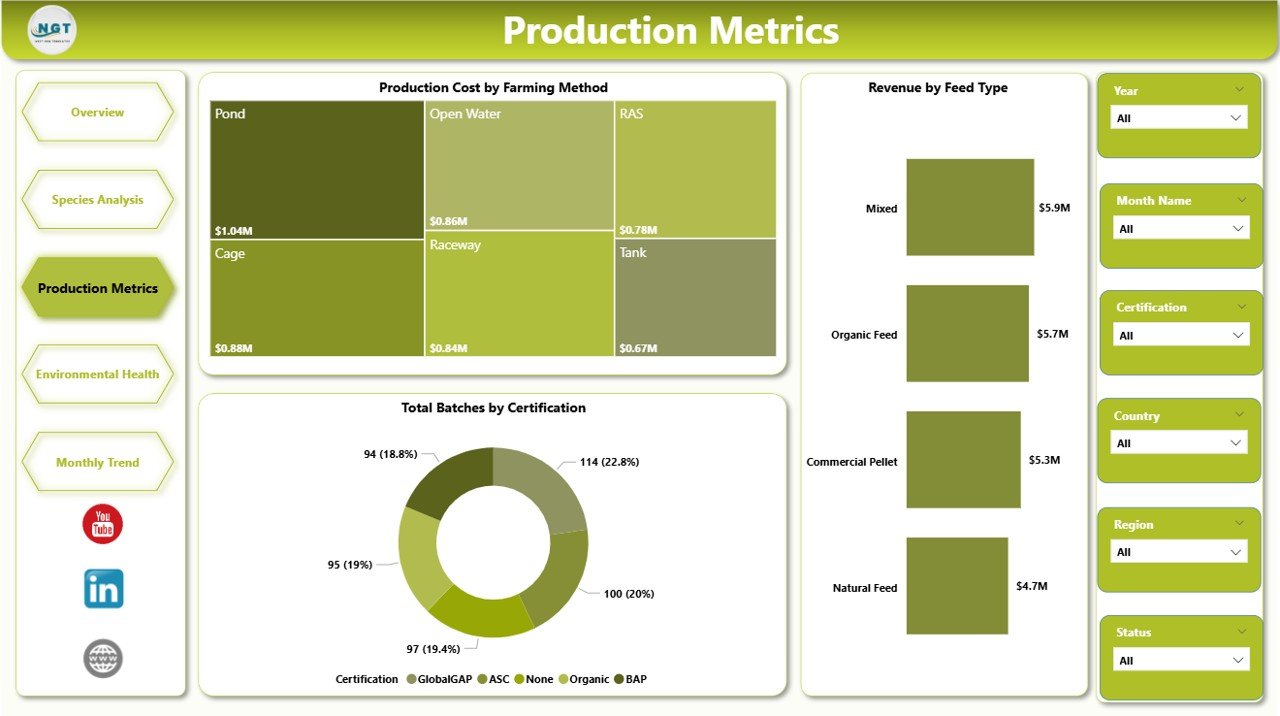
⚙️ Production Metrics Page
The Production Metrics Page focuses on production efficiency and operational cost management.
Charts included:
• Production Cost by Farming Method
• Revenue by Feed Type
• Total Batches by Certification
These insights help farms evaluate feeding strategies, certification compliance, and cost efficiency.
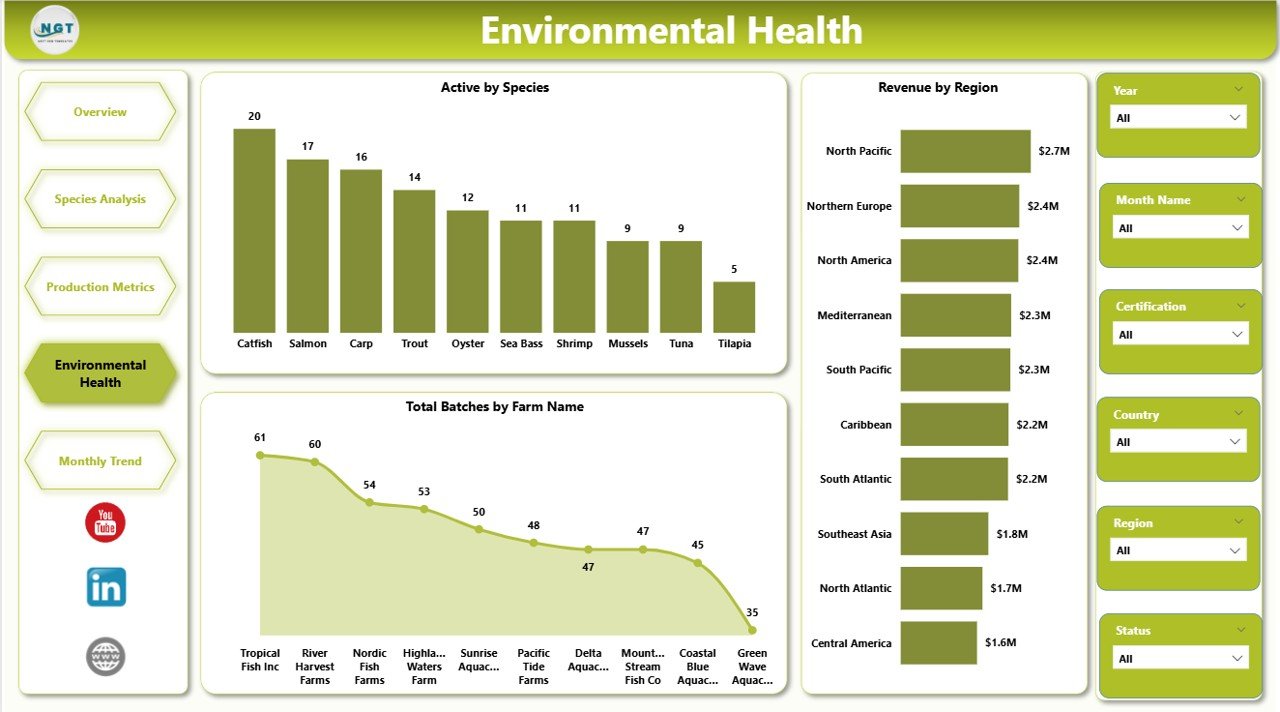
🌿 Environmental Health Page
Environmental conditions play a crucial role in aquaculture productivity.
The Environmental Health Page focuses on monitoring environmental and farm performance indicators.
Charts included:
• Active by Species
• Revenue by Region
• Total Batches by Farm Name
This analysis helps identify environmental risks and monitor farm productivity across regions.
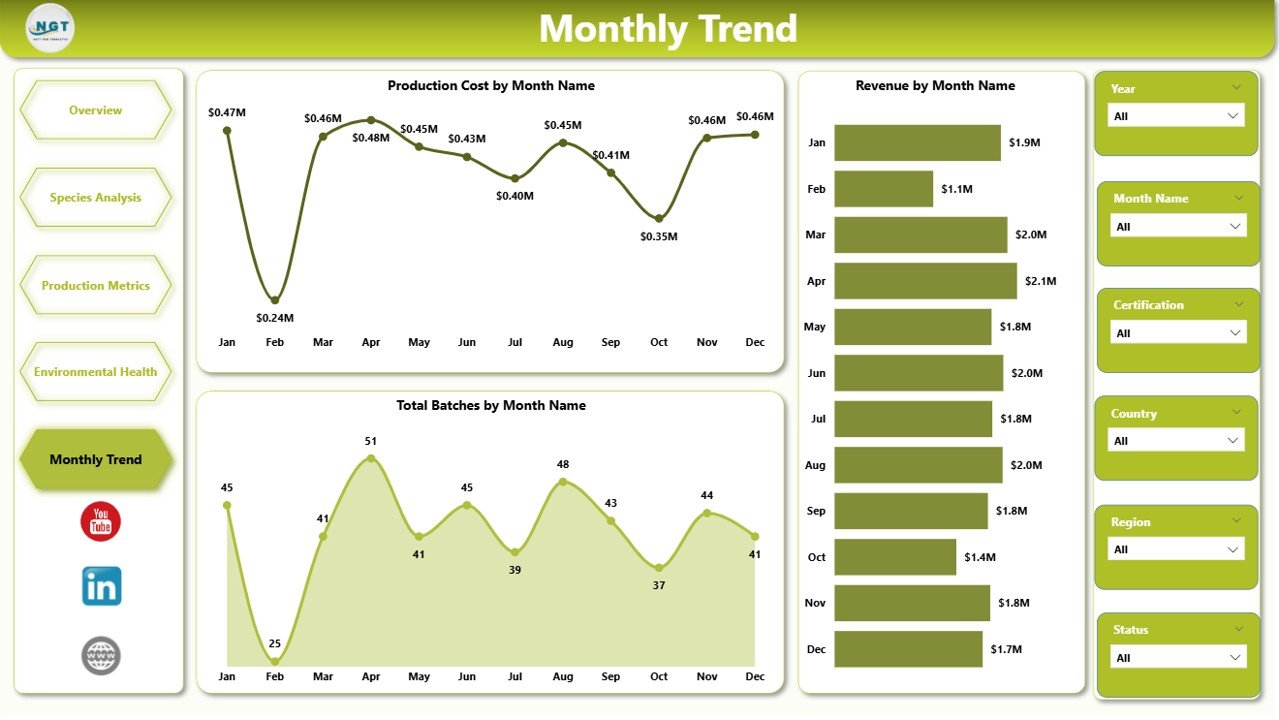
📅 Month Analysis Page
Seasonal variations significantly affect aquaculture production.
The Month Analysis Page tracks time-based performance trends.
Charts included:
• Production Cost by Month
• Revenue by Month
• Total Batches by Month
Managers can use these insights to plan harvest cycles, feed supply, and production schedules.
⚙️ How to Use the Aquaculture Dashboard in Power BI
Using this dashboard is straightforward.
1️⃣ Import aquaculture production data into Power BI.
2️⃣ Ensure datasets include species, farming method, production cost, revenue, and farm location.
3️⃣ Use slicers to filter insights dynamically.
4️⃣ Analyze trends across the different analytical pages.
5️⃣ Refresh the dataset regularly to update dashboard insights.
Within seconds, aquaculture managers can transform raw farm data into powerful analytics.
👨🌾 Who Can Benefit from This Dashboard
This dashboard is ideal for professionals working in aquaculture and fisheries management.
🐟 Aquaculture Farm Managers
🌊 Fish & Shrimp Farm Owners
📊 Aquaculture Data Analysts
🏢 Seafood Production Companies
🌱 Environmental Monitoring Teams
🎓 Agriculture & Aquaculture Researchers
Organizations using this dashboard gain better operational visibility, improved production monitoring, and stronger data-driven decision-making capabilities.
### Click hare to read the Detailed blog post
Visit our YouTube channel to learn step-by-step video tutorials
https://youtube.com/@PKAnExcelExpert
Watch the step-by-step video tutorial:
Compatibility and Requirements
- Works in Power BI Desktop, which is free. Microsoft explains how to get it in Get Power BI Desktop.
- You connect your own aquaculture data from Excel files or a database, then refresh the report.
Frequently Asked Questions
How many pages does the dashboard have?
Five pages: Overview, Species Analysis, Production Metrics, Environmental Health and Month Analysis.
Can I filter the data by species, region or month?
Yes. Slicers let you filter by species, region, farm name and month, and every chart updates with your selection.
What data does the dashboard need?
Your data should include species, farming method, production cost, revenue and farm location. You can connect Excel files or a database.
Which charts compare species and farming methods?
The Species Analysis page shows production cost, revenue and total batches by species. The Production Metrics page shows production cost by farming method and revenue by feed type.
Is there an Excel or Google Sheets version?
Yes. See the Aquaculture Dashboard in Excel and the Aquaculture KPI Dashboard in Google Sheets.
Related Aquaculture Templates
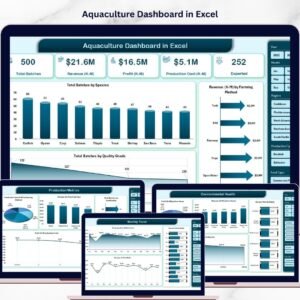
- Aquaculture Dashboard in Excel: the same dashboard idea in Excel
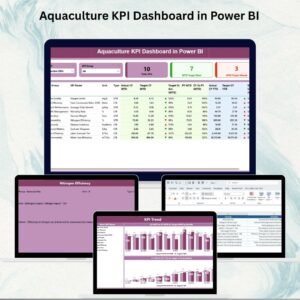
- Aquaculture KPI Dashboard in Power BI: a KPI-focused Power BI report
- Aquaculture KPI Dashboard in Google Sheets: aquaculture KPIs in Google Sheets
- Aquaculture KPI Scorecard in Excel: a scorecard view of farm metrics
- Power BI Dashboard Mega Collection: 15 Power BI dashboards in one download
Browse all Power BI dashboards.