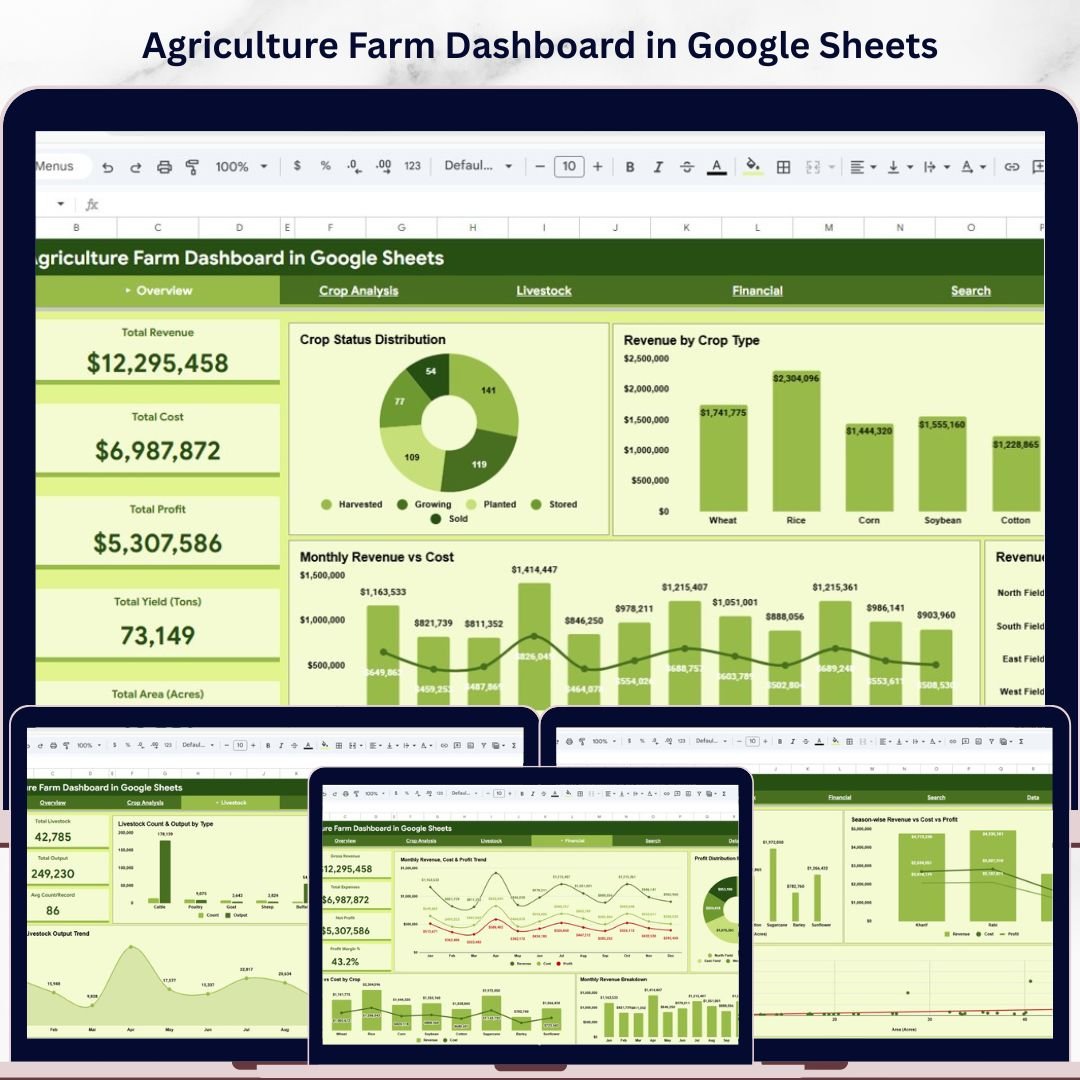


Agriculture Farm Dashboard in Google Sheets is a powerful, ready-to-use interactive analytical tool designed for farmers, agronomists, and agricultural business managers who want to monitor farm revenue, crop yield, operating costs, profit margins, and livestock performance — all from a single Google Sheets dashboard. This dashboard includes 6 interactive sheet tabs covering Overview, Crop Analysis, Livestock, Financial, Search Page, and Data Sheet. It tracks 5 critical KPIs including Total Revenue, Total Cost, Total Profit, Total Yield (Tons), and Total Area (Acres). Whether you manage a small family farm or a large-scale commercial agriculture operation, this template helps you make data-driven farming decisions quickly and confidently.
📌 Built entirely in Google Sheets using Google Apps Script — simply make a copy to your Google Drive, replace the sample data with your own, and the dashboard updates dynamically with clear, professional visuals and interactive slicers on every page.
📌 Includes dynamic slicers and filters so you can slice and dice your farm data by Crop Type, Farm Zone, Season, Livestock Type, and more — giving you a customized view in seconds.
📌 Designed with clean, modern visuals that make complex agricultural data simple to understand and act upon. If you are looking for more agriculture and farming analytics templates, explore our full collection of Google Sheets Dashboard Templates at NextGenTemplates.

🔑 Key Features of Agriculture Farm Dashboard in Google Sheets
🌾 6 Interactive Dashboard Pages — This template includes six professionally designed sheet tabs covering Overview, Crop Analysis, Livestock, Financial, Search Page, and Data Sheet for a complete 360-degree view of your farming operations.
📊 5 High-Level KPI Cards — Instantly monitor Total Revenue, Total Cost, Total Profit, Total Yield (Tons), and Total Area (Acres) right from the Overview page.
📈 Advanced Visual Analytics — Explore your farming data through powerful charts showing Crop Status Distribution by Status, Revenue by Crop Type, Monthly Revenue vs Cost by Month, and Revenue by Farm Zone across multiple analysis pages.
🐄 Livestock Performance Tracking — Monitor Livestock Count and Output by Type, Livestock Distribution by Zone, Livestock Count by Type, and Monthly Livestock Output Trend to manage your animal farming operations alongside crop data.
💰 Financial Deep Dive — Analyze Monthly Revenue, Cost and Profit Trend by Month, Profit Distribution by Zone, Revenue vs Cost by Crop, and Monthly Revenue Breakdown for comprehensive financial planning.
🌱 Crop-Level Analysis — Understand Revenue and Area by Crop, Season-wise Revenue vs Cost vs Profit, Revenue by Crop Category, and Area vs Yield Correlation to identify your most profitable crops.
🔍 Search Page for Quick Lookups — Select a Record ID from the dropdown and instantly view all details for that specific farm record including Farm Zone, Crop Type, Category, Area, Yield, Revenue, Cost, Profit, Season, Livestock Type, and Livestock Count.
🚀 Professional and Ready-to-Use — Simply copy the Google Sheets file to your Google Drive, replace sample data with your own, and the dashboard updates automatically with clear insights for planning, reporting, and decision-making.
📦 What’s Inside the Agriculture Farm Dashboard in Google Sheets
This dashboard contains 6 sheet tabs that cover every aspect of your farming operations:
📊 Overview Page — Your central command center displaying Total Revenue, Total Cost, Total Profit, Total Yield (Tons), and Total Area (Acres) as KPI cards. Charts include Crop Status Distribution by Status, Revenue by Crop Type, Monthly Revenue vs Cost by Month, and Revenue by Farm Zone. Interactive slicers let you filter the entire dashboard instantly.
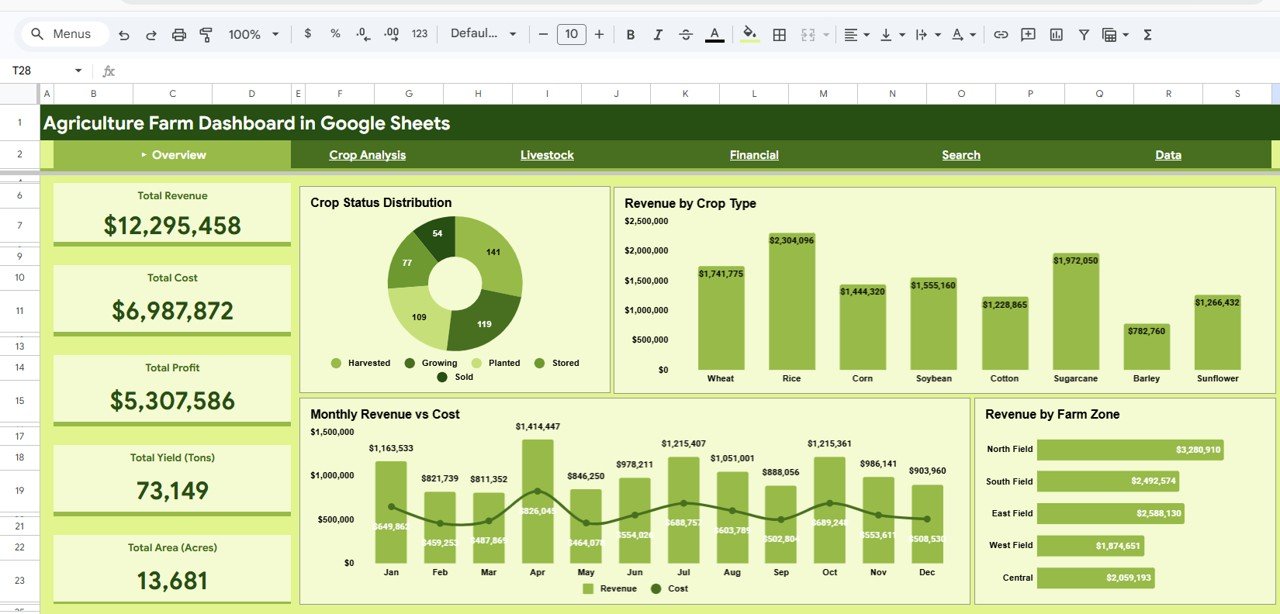 Overview Page
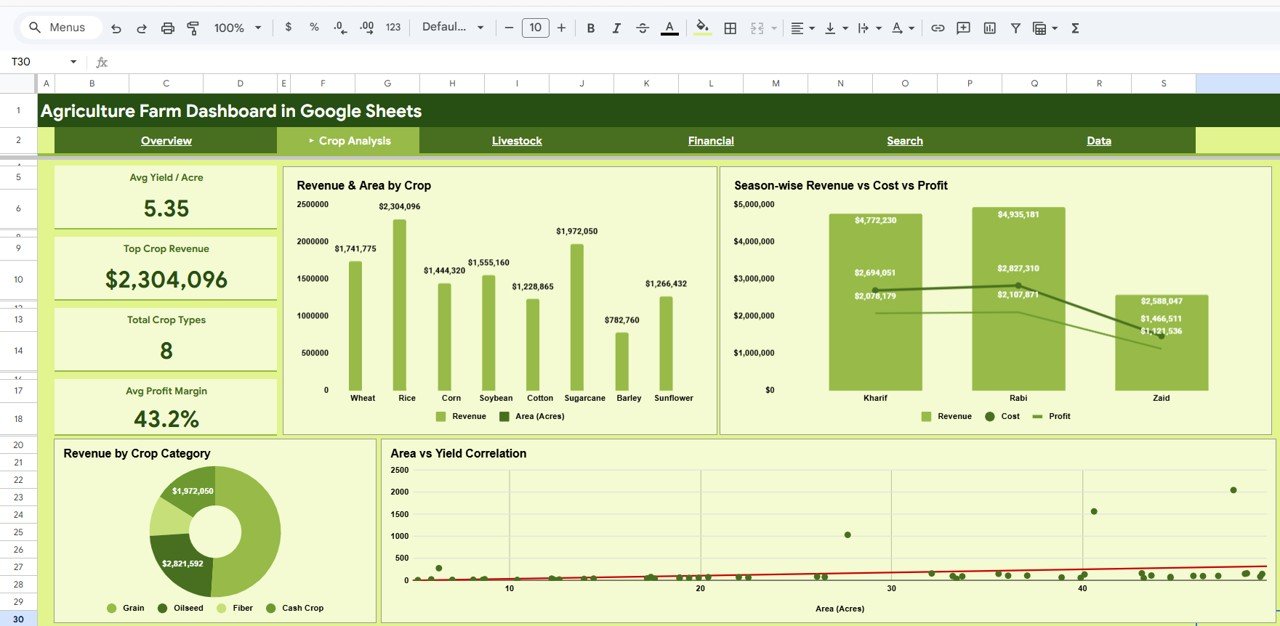
📊 Crop Analysis — Deep-dive into crop-level performance with charts showing Revenue and Area by Crop, Season-wise Revenue vs Cost vs Profit by Season, Revenue by Crop Category, and Area vs Yield Correlation. Identify your most profitable crops and seasonal patterns at a glance.
 Crop Analysis
📊 Livestock — Track animal farming operations with charts showing Livestock Count and Output by Type, Livestock Distribution by Zone, Livestock Count by Type, and Monthly Livestock Output Trend by Month. Manage cattle, poultry, goats, sheep, and other livestock alongside crop data.
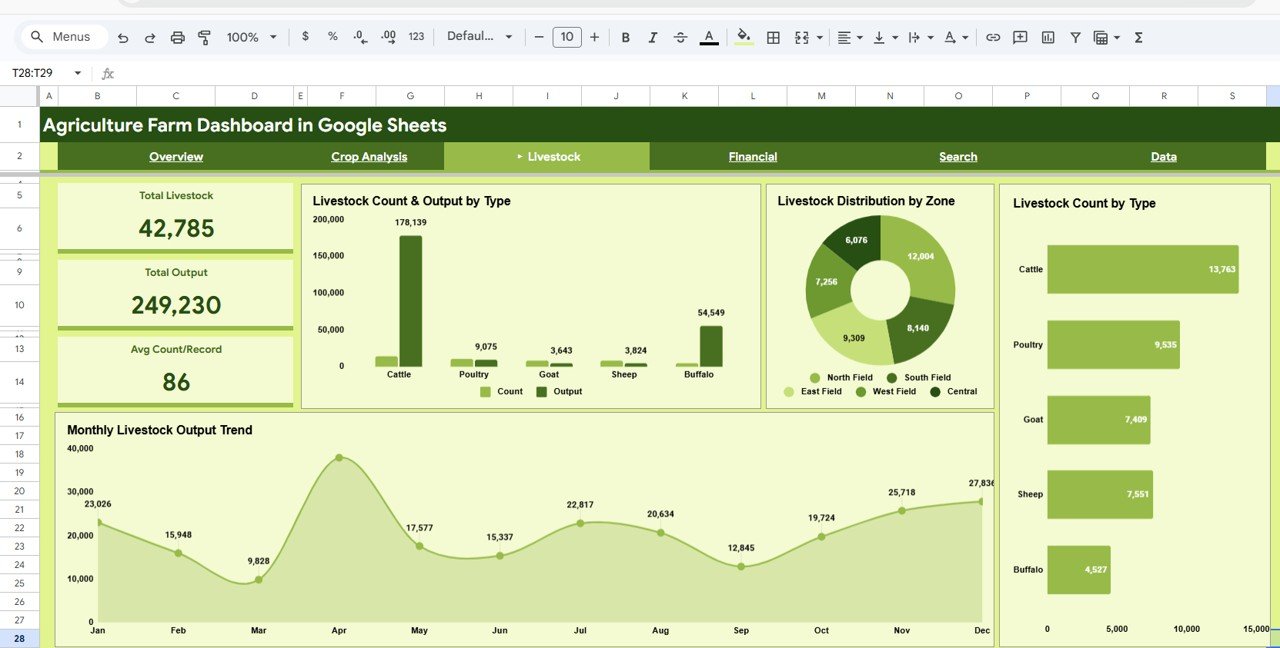 Livestock
📊 Financial — Monitor your farm’s financial health with Monthly Revenue, Cost and Profit Trend by Month, Profit Distribution by Zone, Revenue vs Cost by Crop, and Monthly Revenue Breakdown by Month. Make informed budgeting and investment decisions.
 Financial
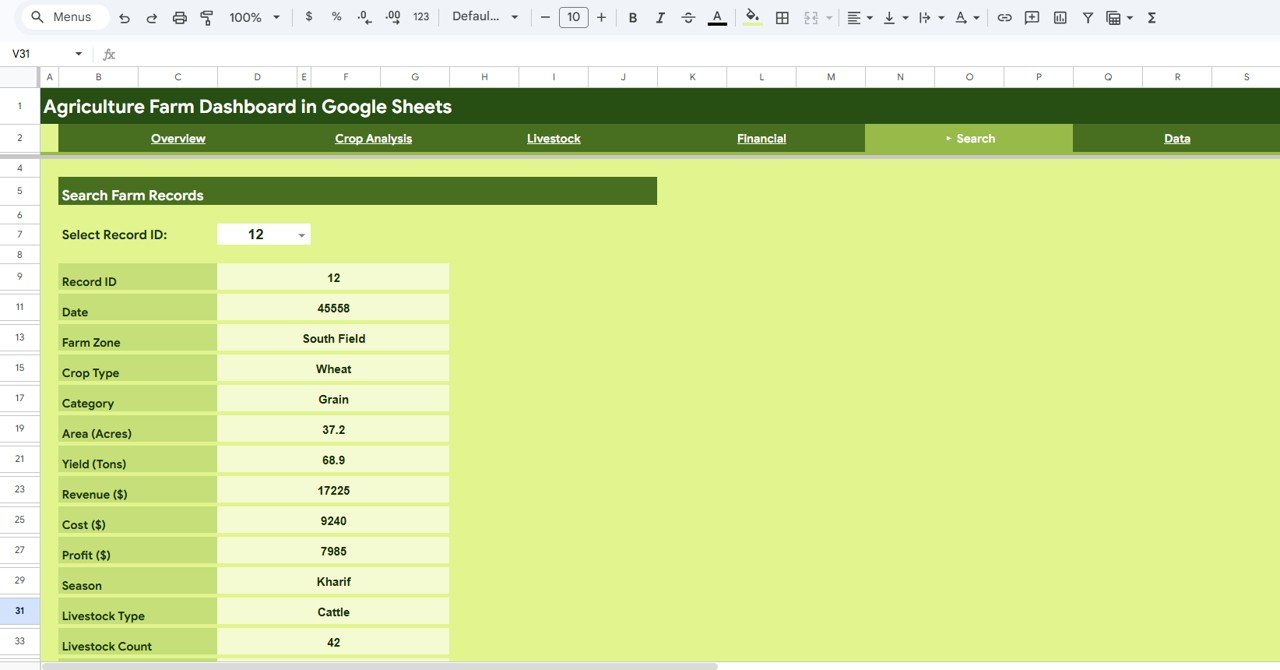
📊 Search Page — Select any Record ID from a dropdown and instantly view all details for that specific farm record including Farm Zone, Crop Type, Category, Area, Yield, Revenue, Cost, Profit, Season, Livestock Type, and Livestock Count. Perfect for quick lookups and individual record analysis.
 Search Sheet Tab
📊 Data Sheet — This is where you enter your raw farming data. Simply replace the sample records with your actual data in the same format, and the entire dashboard refreshes automatically.
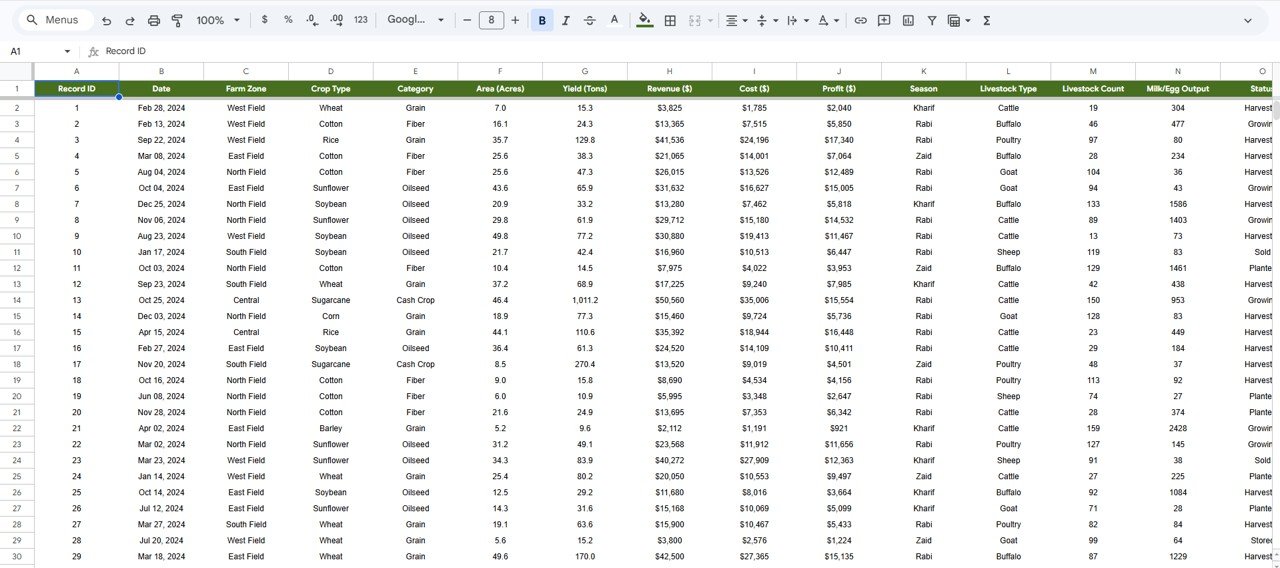 Data Sheet Tab
Looking for a similar dashboard in other platforms? Check out the Agriculture and Farm Dashboard in Excel, the Agriculture and Farm Dashboard in Power BI, or the Agriculture and Farm Dashboard in HTML.
⚙️ How to Use the Agriculture Farm Dashboard in Google Sheets
Getting started is simple:
1️⃣ Open the PDF guide included in your download — it contains the Google Sheets copy link.
2️⃣ Click the link to create your own editable copy in Google Drive.
3️⃣ Go to the Data Sheet tab and replace the sample data with your own farming records — keep the same column format.
4️⃣ All 4 dashboard pages plus the Search Page will automatically refresh with your data — charts, KPI cards, and filters update instantly.
5️⃣ Use the slicers and filters on each page to explore data by Crop Type, Farm Zone, Season, Livestock Type, and more.
6️⃣ Use insights from the dashboard in team meetings, planning sessions, budgeting reviews, and growth strategies to make better farming decisions.
👥 Who Can Benefit from This Agriculture Farm Dashboard in Google Sheets
🌾 Farmers and Farm Owners — Track revenue, costs, livestock output, and crop profitability across seasons in a centralized Google Sheets dashboard.
🌾 Agronomists and Agricultural Consultants — Analyze crop yield, soil performance, livestock trends, and financial metrics for clients using interactive visuals.
🌾 Agricultural Businesses and Cooperatives — Monitor multi-farm operations with centralized data and dynamic filters.
🌾 Agricultural Students and Researchers — Use real-world data structures for academic projects and data visualization research.
🌾 Government and NGO Agricultural Programs — Track program outcomes, regional performance, livestock management, and resource allocation effectively.
Also explore the Farm Production and Profitability Dashboard in Google Sheets and the Agriculture Dashboard in Google Sheets for more agricultural analytics solutions.
❓ Frequently Asked Questions
What KPIs does the Agriculture Farm Dashboard in Google Sheets track?
The Agriculture Farm Dashboard in Google Sheets tracks 5 key performance indicators: Total Revenue, Total Cost, Total Profit, Total Yield (Tons), and Total Area (Acres). Additionally, it provides crop analysis, livestock tracking, financial trends, and a search page for individual record lookups across 6 interactive sheet tabs.
Do I need advanced Google Sheets skills to use this dashboard?
No. Simply make a copy of the Google Sheets file to your Google Drive, replace the sample data with your own farming records, and all charts, KPI cards, and analysis pages update automatically. No coding or advanced formula knowledge is required.
Can I customize the crops, zones, and livestock types in this dashboard?
Yes. The dashboard is fully data-driven. When you update the Data Sheet with your own crop names, farm zones, seasons, livestock types, and other fields, the dashboard adapts automatically to reflect your unique farm data.
What is the best Google Sheets dashboard template for agriculture and farming?
The Agriculture Farm Dashboard in Google Sheets by NextGenTemplates is one of the best options available. It includes 6 interactive pages covering overview, crop analysis, livestock tracking, financial analysis, a search page, and a data sheet — providing comprehensive farm analytics in one template.
How do I track farm revenue and livestock performance in Google Sheets?
You can use the Agriculture Farm Dashboard in Google Sheets to track both farm revenue and livestock performance. Enter your farming data into the Data Sheet, and the dashboard automatically generates charts showing revenue by crop, livestock count by type, profit distribution by zone, and monthly financial trends across all 6 sheet tabs.
Does this dashboard include livestock tracking?
Yes. Unlike most agriculture dashboards, this template includes a dedicated Livestock sheet tab that tracks Livestock Count and Output by Type, Livestock Distribution by Zone, and Monthly Livestock Output Trend — making it a complete farm management solution for both crops and animals.
🔗 Explore Related Templates
🔹 Agriculture and Farm Dashboard in Excel — Same agricultural analytics in a Microsoft Excel format with pivot tables and slicers.
🔹 Agriculture and Farm Dashboard in Power BI — Advanced agricultural analytics with Power BI interactive visuals and dynamic slicers.
🔹 Agriculture and Farm Dashboard in HTML — Browser-based agriculture dashboard with light/dark theme and CSV upload.
📖 Click here to read the Detailed Blog Post
Watch the step-by-step video tutorial:


Reviews
There are no reviews yet.