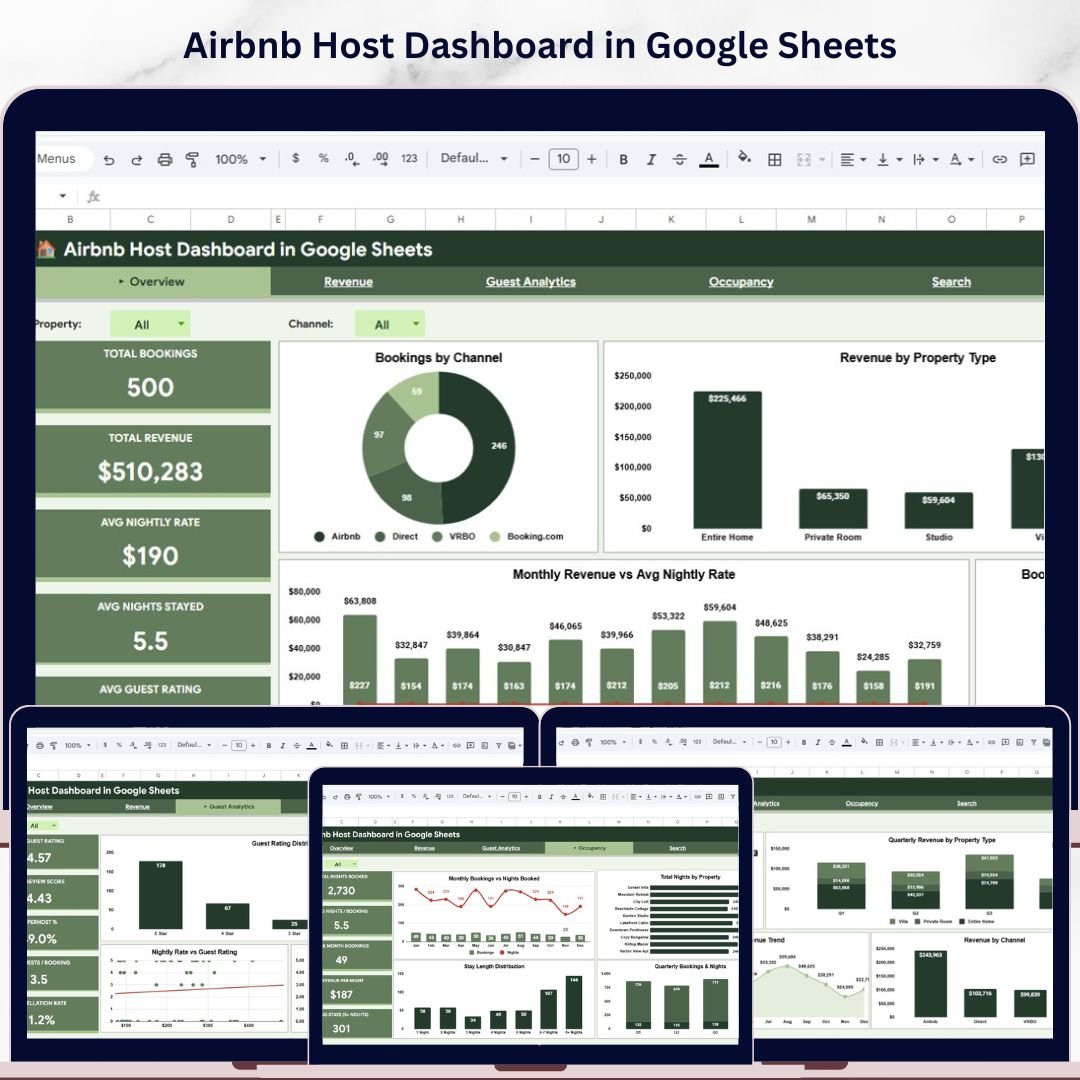


Airbnb Host Dashboard in Google Sheets is a professionally designed, ready-to-use analytics template built for Airbnb hosts, property managers, and vacation rental operators who want to track their hosting business performance using interactive Google Sheets charts, KPI cards, and dynamic slicers. This dashboard includes 4 interactive analysis pages covering Overview, Revenue, Guest Analytics, and Occupancy, plus a Booking Search page and a structured Data Sheet. It tracks 5 key metrics including Total Bookings, Total Revenue, Avg Nightly Rate, Avg Nights Stayed, and Avg Guest Rating across multiple properties, channels, and booking statuses.
Whether you manage a single Airbnb listing or a multi-property portfolio, this Google Sheets Dashboard Template gives you instant visibility into booking performance, revenue trends, guest satisfaction, and occupancy patterns. Simply make a copy of the Google Sheet, replace the sample data with your own records, and every chart and KPI updates automatically. If you prefer Microsoft tools, check out the Airbnb Host Dashboard in Excel or the Airbnb Host Dashboard in Power BI.
🔑 Key Features of Airbnb Host Dashboard in Google Sheets
📊 4 Interactive Dashboard Pages — Analyze Airbnb hosting performance across Overview, Revenue, Guest Analytics, and Occupancy pages with dynamic Google Sheets charts and slicers.
📈 KPI Cards on Overview — Track Total Bookings, Total Revenue, Avg Nightly Rate, Avg Nights Stayed, and Avg Guest Rating at a glance.
🎛 Interactive Slicers and Filters — Filter the entire dashboard instantly by property type, location, channel, and booking status.
📊 Revenue Breakdown Analysis — Understand revenue distribution by Location, Property Type, Channel, and Monthly Trends.
⭐ Guest Analytics Page — Evaluate guest satisfaction through Guest Rating Distribution, Avg Guests by Property Type, Nightly Rate vs Guest Rating, and Monthly Avg Guest Rating Trend.
🏠 Occupancy Monitoring — Track Monthly Bookings vs Nights Booked, Total Nights by Property, Stay Length Distribution, and Quarterly Bookings.
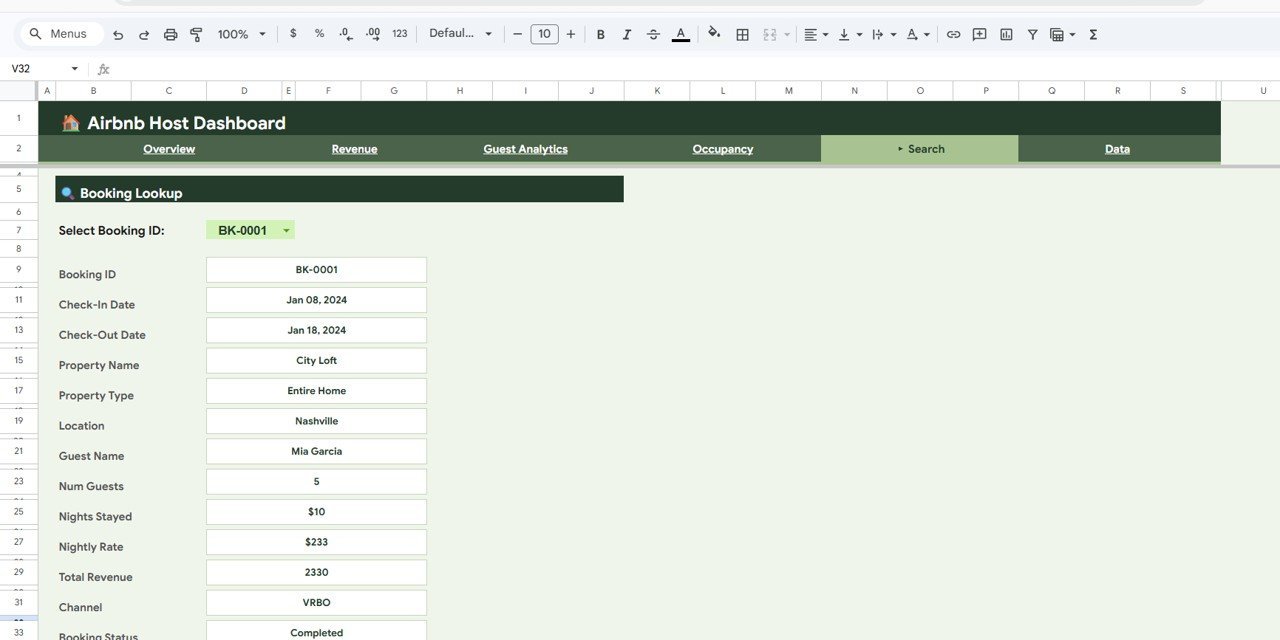
🔍 Booking Lookup Feature — Select any Booking ID and instantly view all booking details including Check-In, Check-Out, Property, Guest Name, Revenue, Channel, and Status.
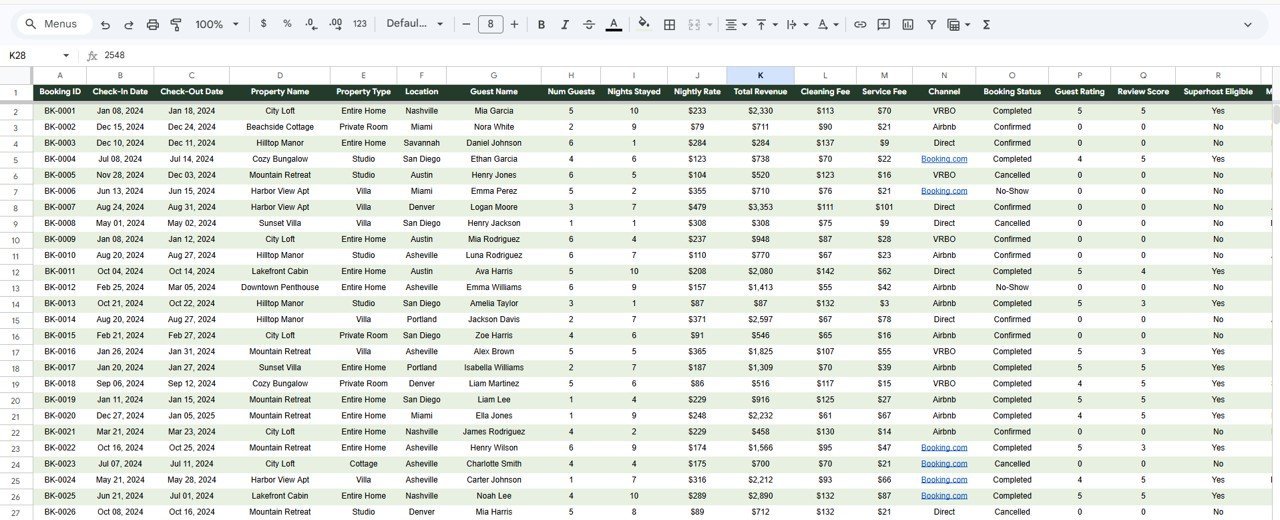
📋 Structured Data Sheet — Enter your Airbnb booking data in a clean, organized format that feeds all dashboard calculations and charts automatically.
📦 What’s Inside the Airbnb Host Dashboard in Google Sheets
This template is organized into 6 sheet tabs:
🏠 Overview Page
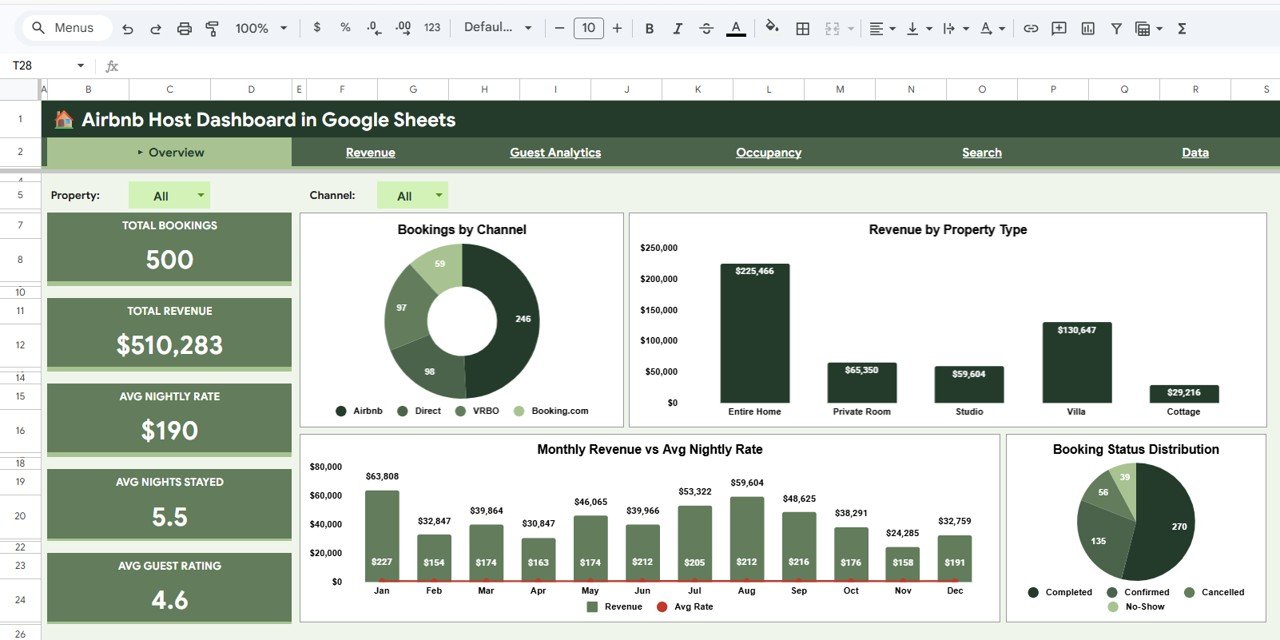
Airbnb Host Dashboard in Google Sheets
Displays 5 KPI cards and interactive charts: Bookings by Channel, Revenue by Property Type, Monthly Revenue vs Avg Nightly Rate, and Booking Status Distribution with slicers for instant filtering.
💰 Revenue Page
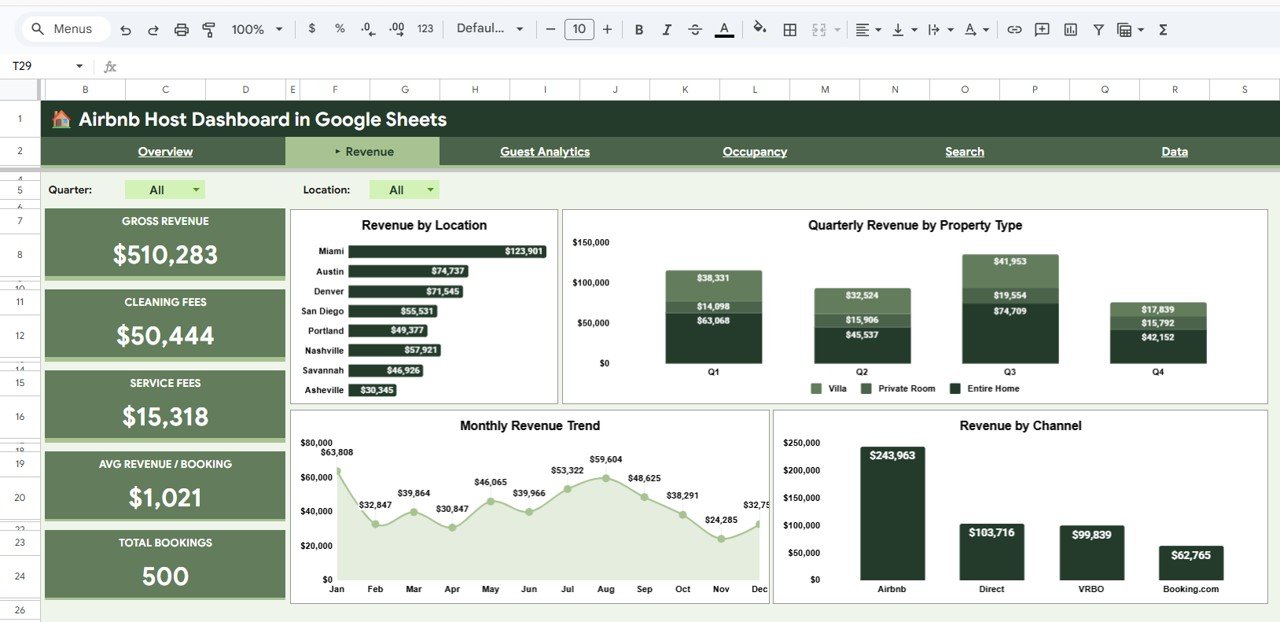
Revenue Page
Charts: Revenue by Location, Quarterly Revenue by Property Type, Monthly Revenue Trend, and Revenue by Channel.
⭐ Guest Analytics Page
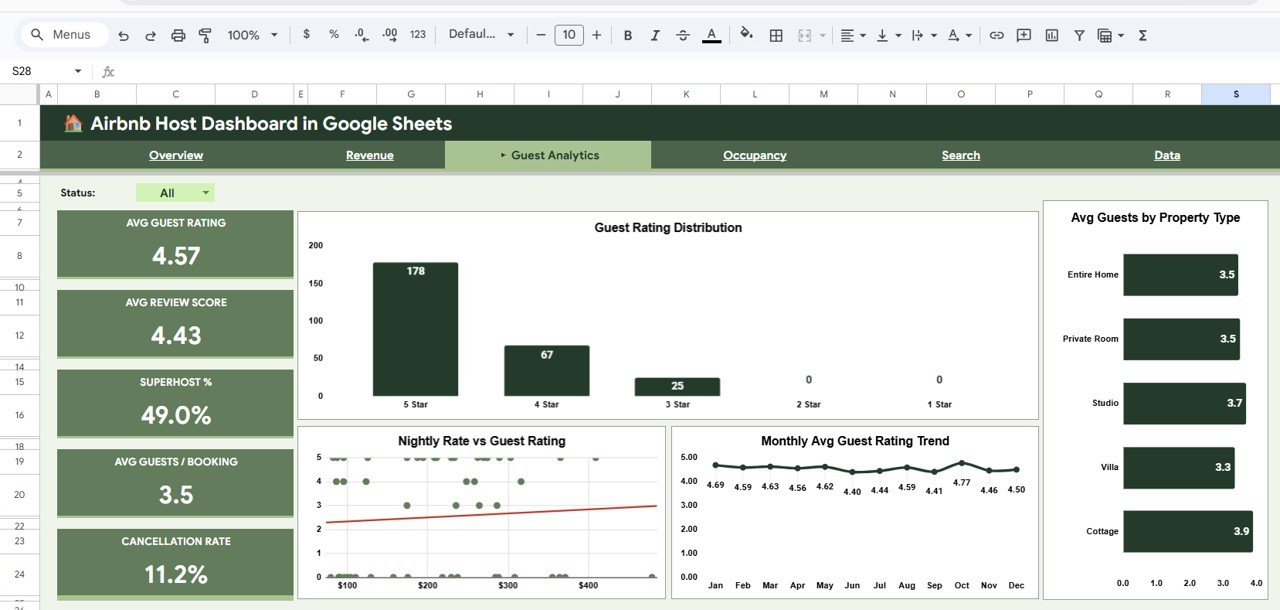
Guest Analytics Page
Charts: Guest Rating Distribution, Avg Guests by Property Type, Nightly Rate vs Guest Rating, Monthly Avg Guest Rating Trend.
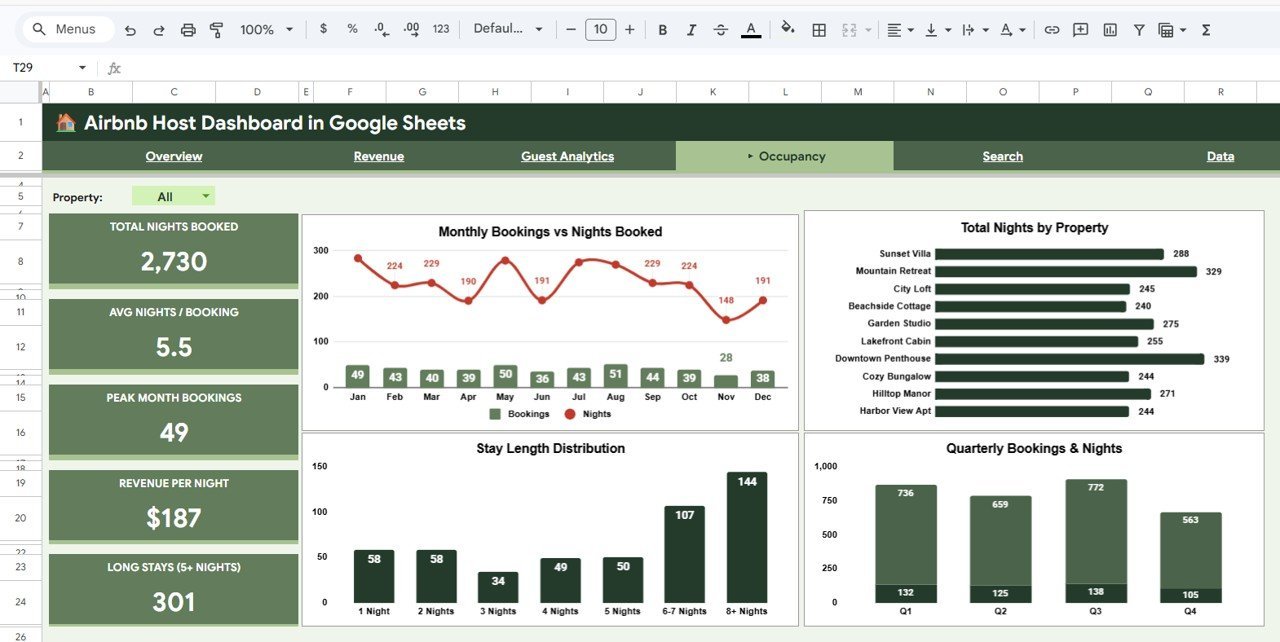
📊 Occupancy Page
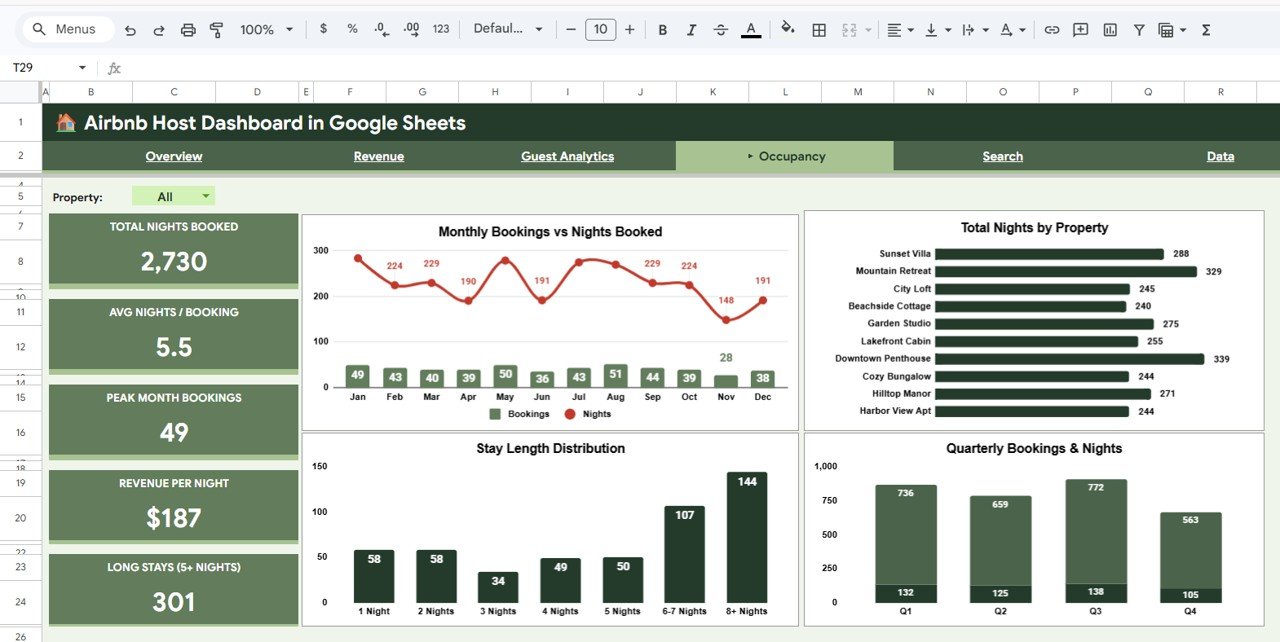
Occupancy Page
Charts: Monthly Bookings vs Nights Booked, Total Nights by Property, Stay Length Distribution, Quarterly Bookings & Nights.
🔍 Search Page
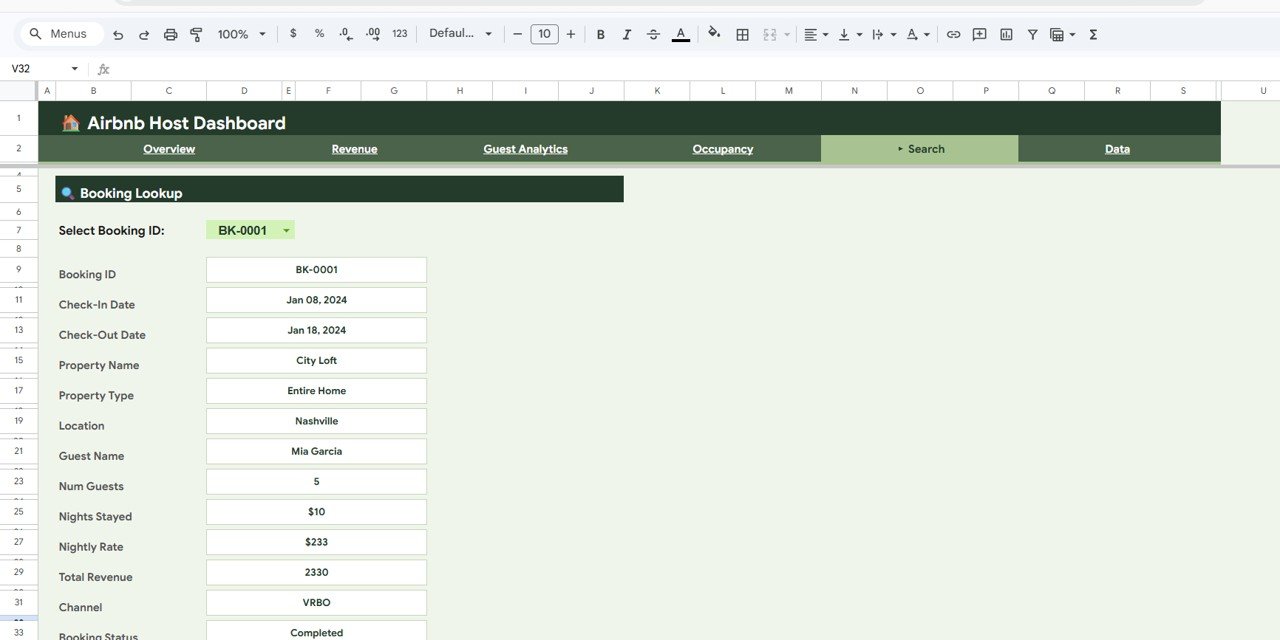
Search Sheet Tab
Booking Lookup: Select any Booking ID to view all details instantly.
📋 Data Sheet
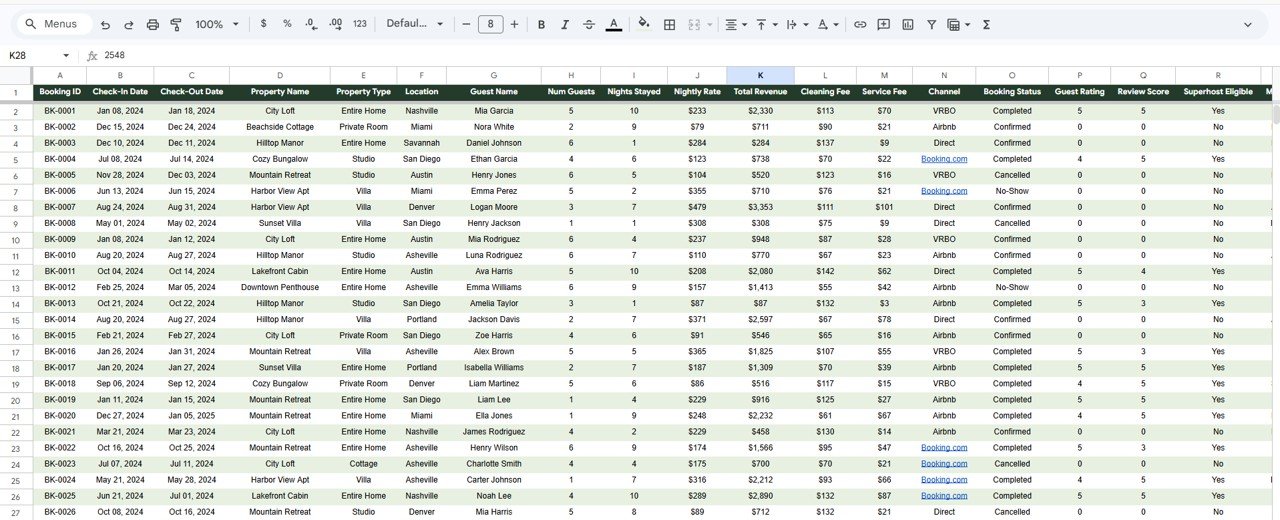
Data Sheet Tab
Enter your booking records here. All dashboard pages update automatically.
⚙️ How to Use
1️⃣ Open the PDF guide and click the Google Sheets copy link. 2️⃣ Replace sample data in the Data Sheet. 3️⃣ All KPIs and charts update automatically. 4️⃣ Use slicers to filter. 5️⃣ Explore all pages.
👥 Who Can Benefit
🏠 Airbnb Hosts 🏢 Property Managers 📊 Rental Business Analysts 💼 Vacation Rental Owners 📈 Hospitality Consultants 🎓 Students
❓ Frequently Asked Questions
What KPIs does this dashboard track?
Total Bookings, Total Revenue, Avg Nightly Rate, Avg Nights Stayed, Avg Guest Rating, plus revenue, guest, and occupancy analysis.
Do I need advanced Google Sheets skills?
No. Replace sample data and everything updates automatically.
Can I track multiple properties?
Yes. Use slicers to filter by property, location, or type.
How is this different from the Excel version?
Cloud-based access and real-time collaboration. The Excel version is for offline pivot table users.
Can I use it for Vrbo or Booking.com?
Yes. Works with any short-term rental platform data.
What is the best Google Sheets dashboard for Airbnb hosts?
This dashboard includes 4 interactive pages, booking search, and a structured data sheet — a complete analytics solution.
🔗 Explore Related Templates
🏠 Airbnb Host Dashboard in Excel
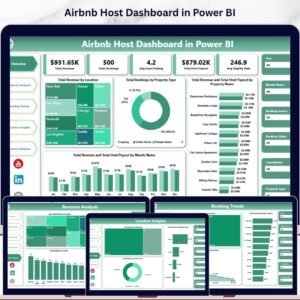
📊 Airbnb Host Dashboard in Power BI
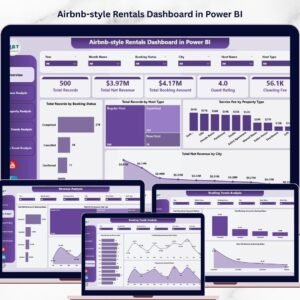
📈 Airbnb-style Rentals Dashboard in Power BI
📖 Click here to read the Detailed Blog Post
Watch the step-by-step video tutorial:


Reviews
There are no reviews yet.