

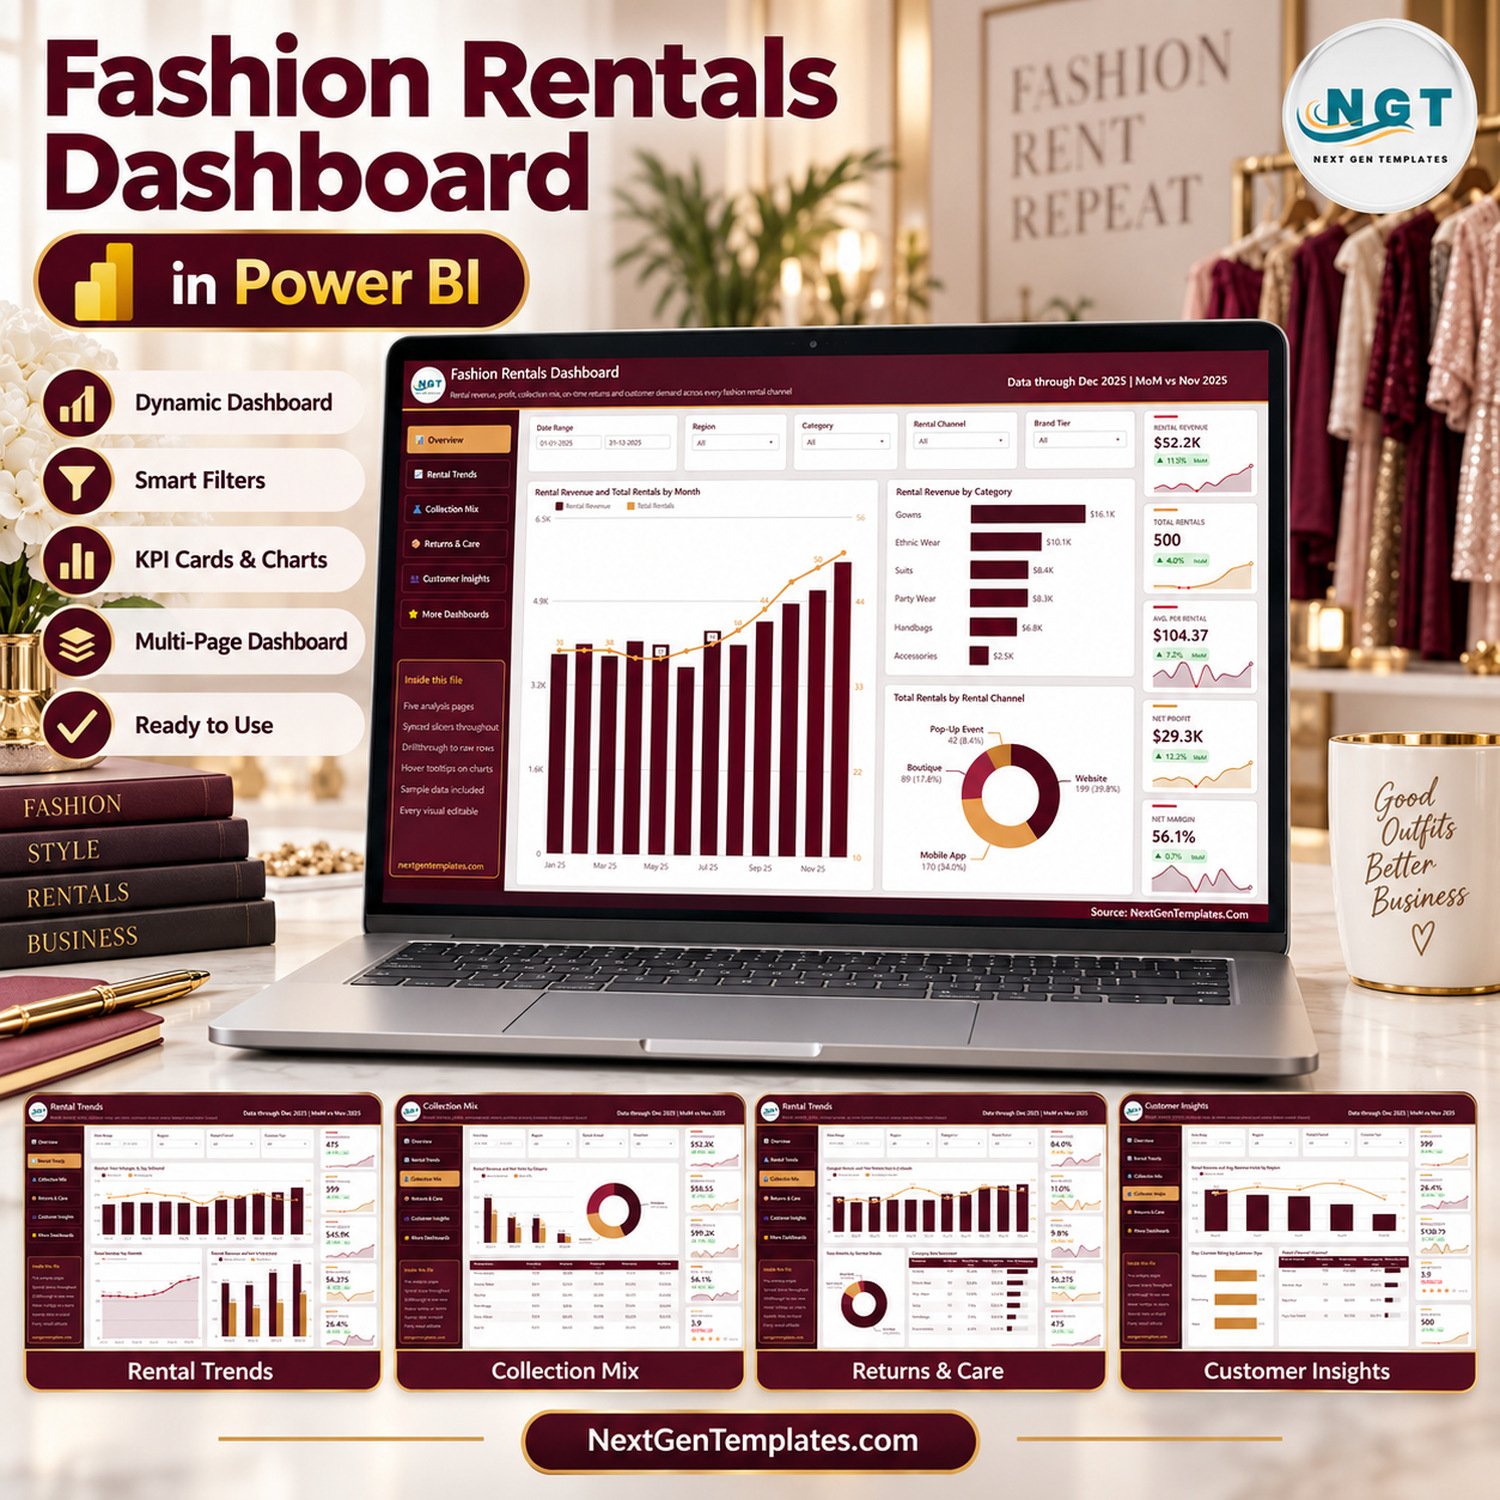
The Fashion Rentals Dashboard in Power BI turns 500 sample rental records into 5 interactive report pages, 25 KPI cards and 15 charts and tables. It covers rental revenue, net profit, collection mix, on-time returns, damage and customer demand across four rental channels. Open the .pbix in Power BI Desktop and every visual is already wired to the sample data.
📊 Built for clothing and accessory rental businesses that already record each rental in a spreadsheet and want one report for revenue, returns and customers instead of a stack of pivot tables.
✅ Instant download · One-time payment · No subscription · No per-user fees from us
🔑 Key Features of the Fashion Rentals Dashboard in Power BI
📄 Five analysis pages plus hidden helpers. Overview, Rental Trends, Collection Mix, Returns & Care and Customer Insights, joined by a left navigation rail. A hidden Details drillthrough page and two tooltip pages (Trend Detail and Metric Detail) sit behind the visuals.
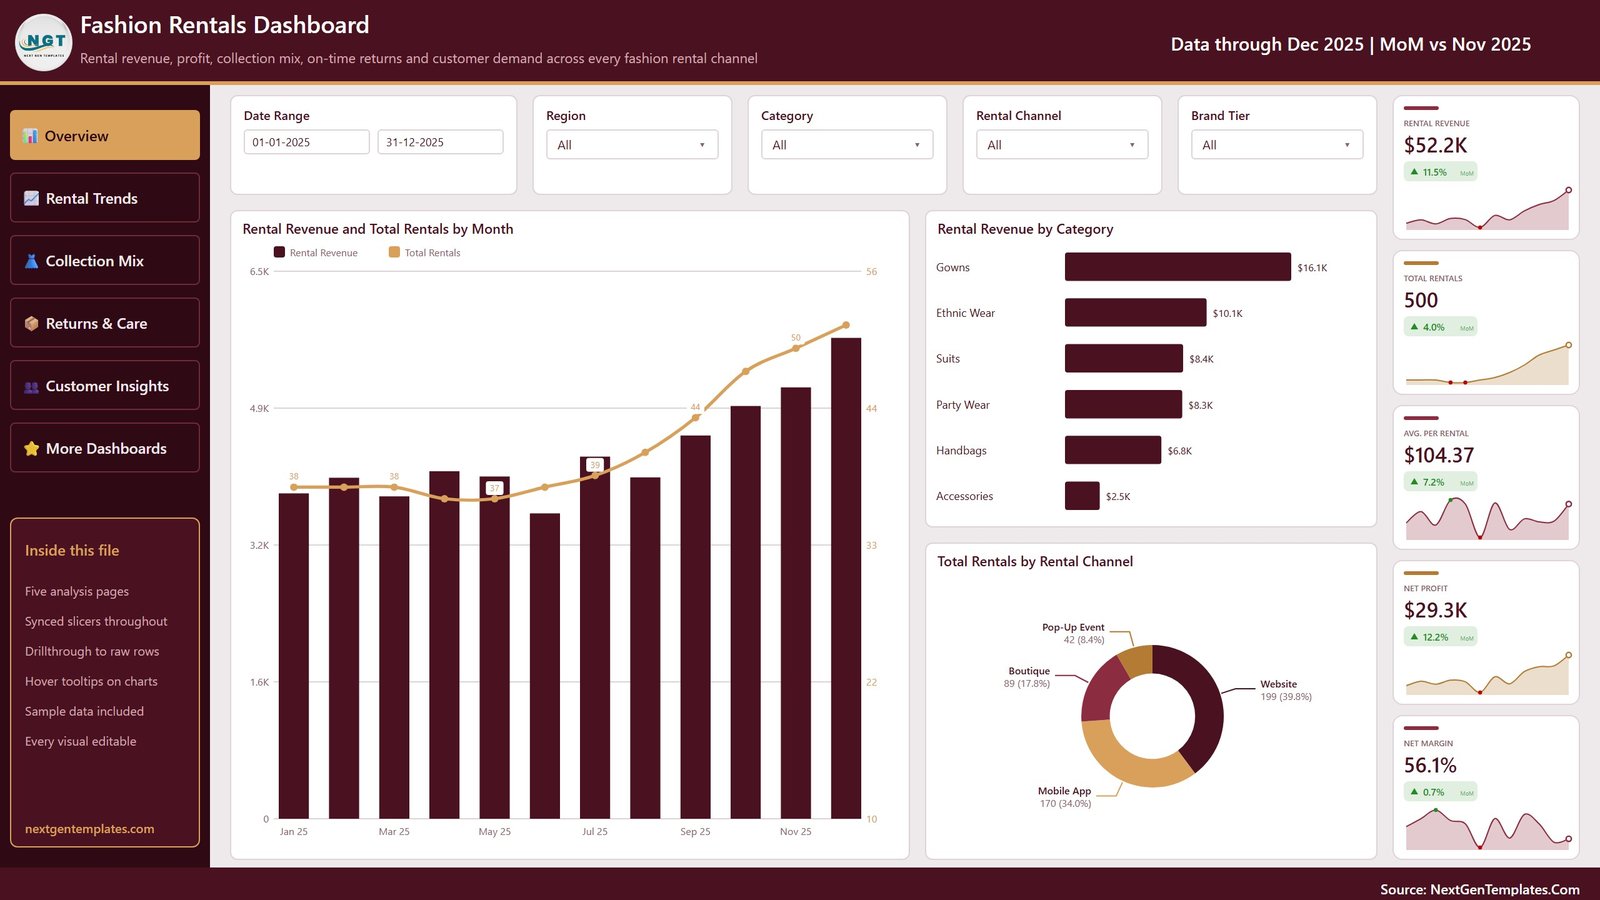
🎛️ Synced slicers on every page. Date Range, Region, Category and Rental Channel are synced across all five analysis pages, so a filter set on Overview follows you everywhere. Each page adds one extra slicer: Brand Tier, Customer Type, Occasion or Rental Status.
📈 25 KPI cards with month-on-month change. Every card shows the current value, the change against the previous month and a 12-month sparkline. The header reads “Data through Dec 2025 | MoM vs Nov 2025” for the sample file.
👗 Six rental categories tracked. Gowns, Ethnic Wear, Suits, Party Wear, Handbags and Accessories, split further by Brand Tier (Standard, Premium, Luxury) and Occasion (Wedding, Party, Festival, Corporate, Photoshoot).
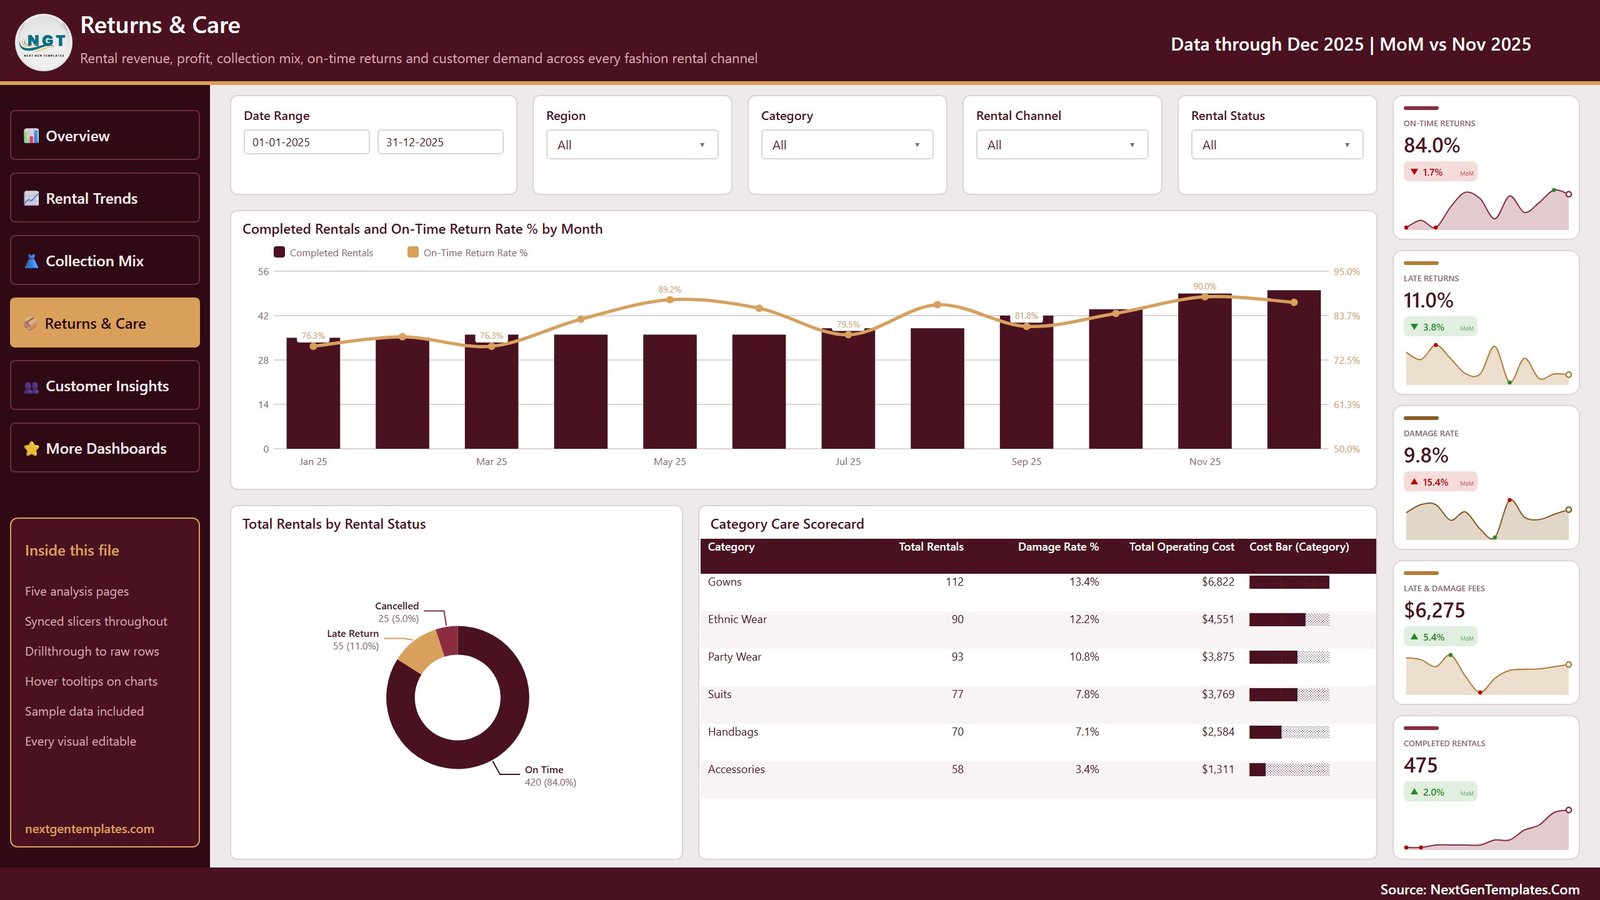
🔁 Returns and damage in one place. On-Time Returns, Late Returns and Damage Rate sit beside a Category Care Scorecard that lists rentals, damage rate and total operating cost for each category.
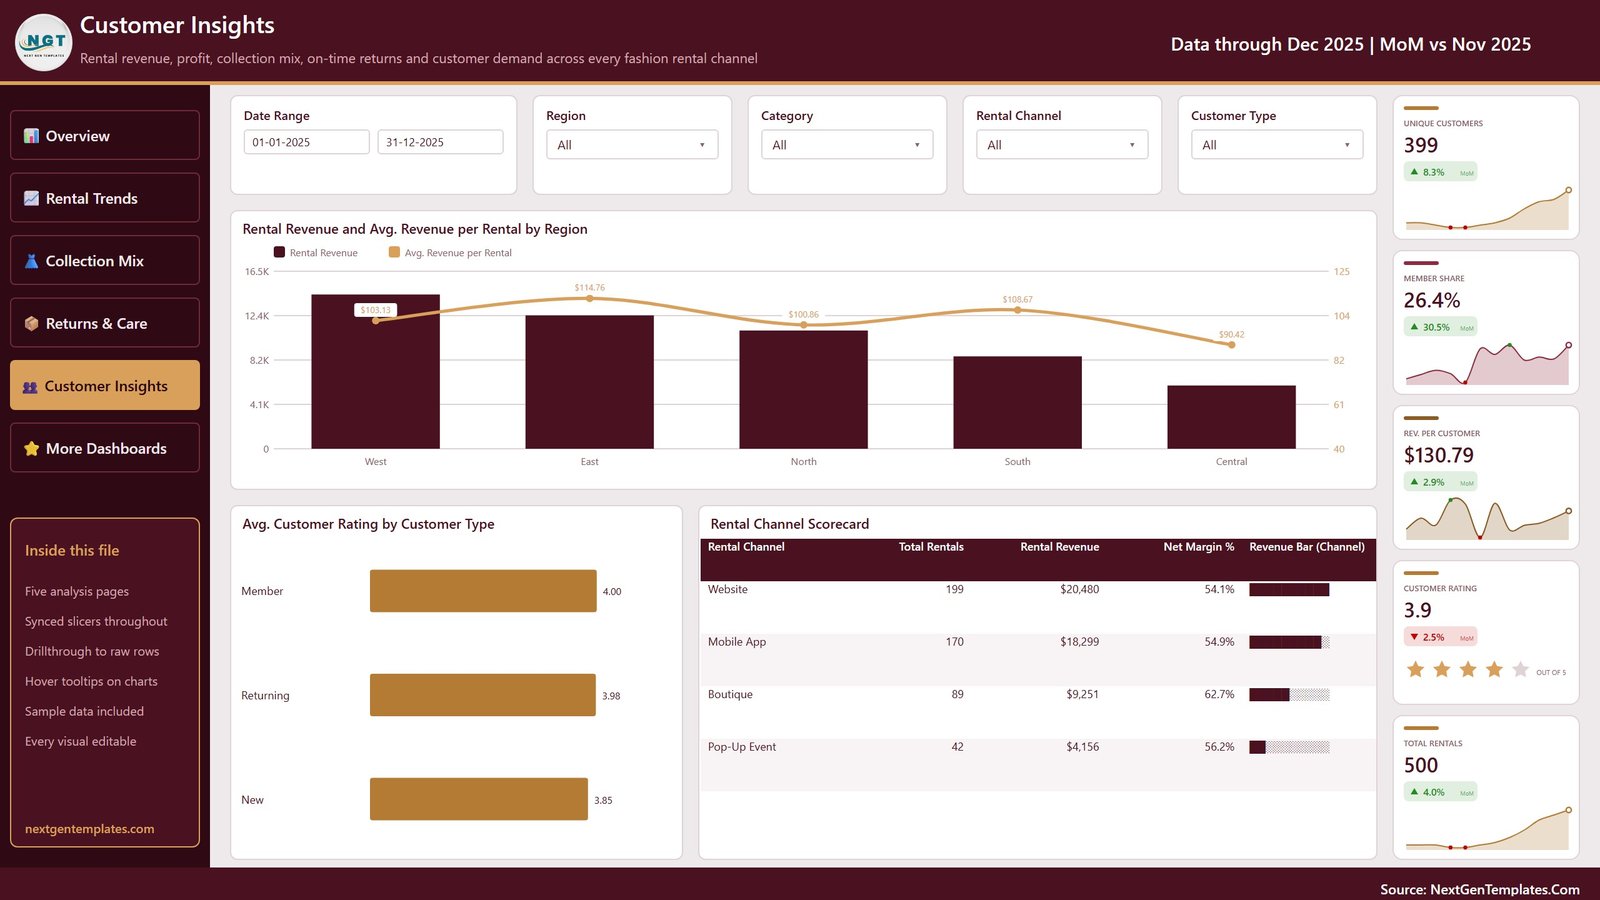
📱 Channel and region comparison. Website, Mobile App, Boutique and Pop-Up Event are compared on rentals, revenue and net margin, and five regions on revenue and average revenue per rental.
📦 What’s Inside the Download
The zip holds the .pbix report, the Data.xlsx sample workbook it reads (500 rentals dated 1 Jan to 31 Dec 2025, 21 columns) and a Power BI user manual PDF. Customer names and figures are fictional demo data.
Page 1: Overview
KPI cards for Rental Revenue, Total Rentals, Avg. per Rental, Net Profit and Net Margin. Charts include Rental Revenue and Total Rentals by Month, Rental Revenue by Category and Total Rentals by Rental Channel.
Page 2: Rental Trends
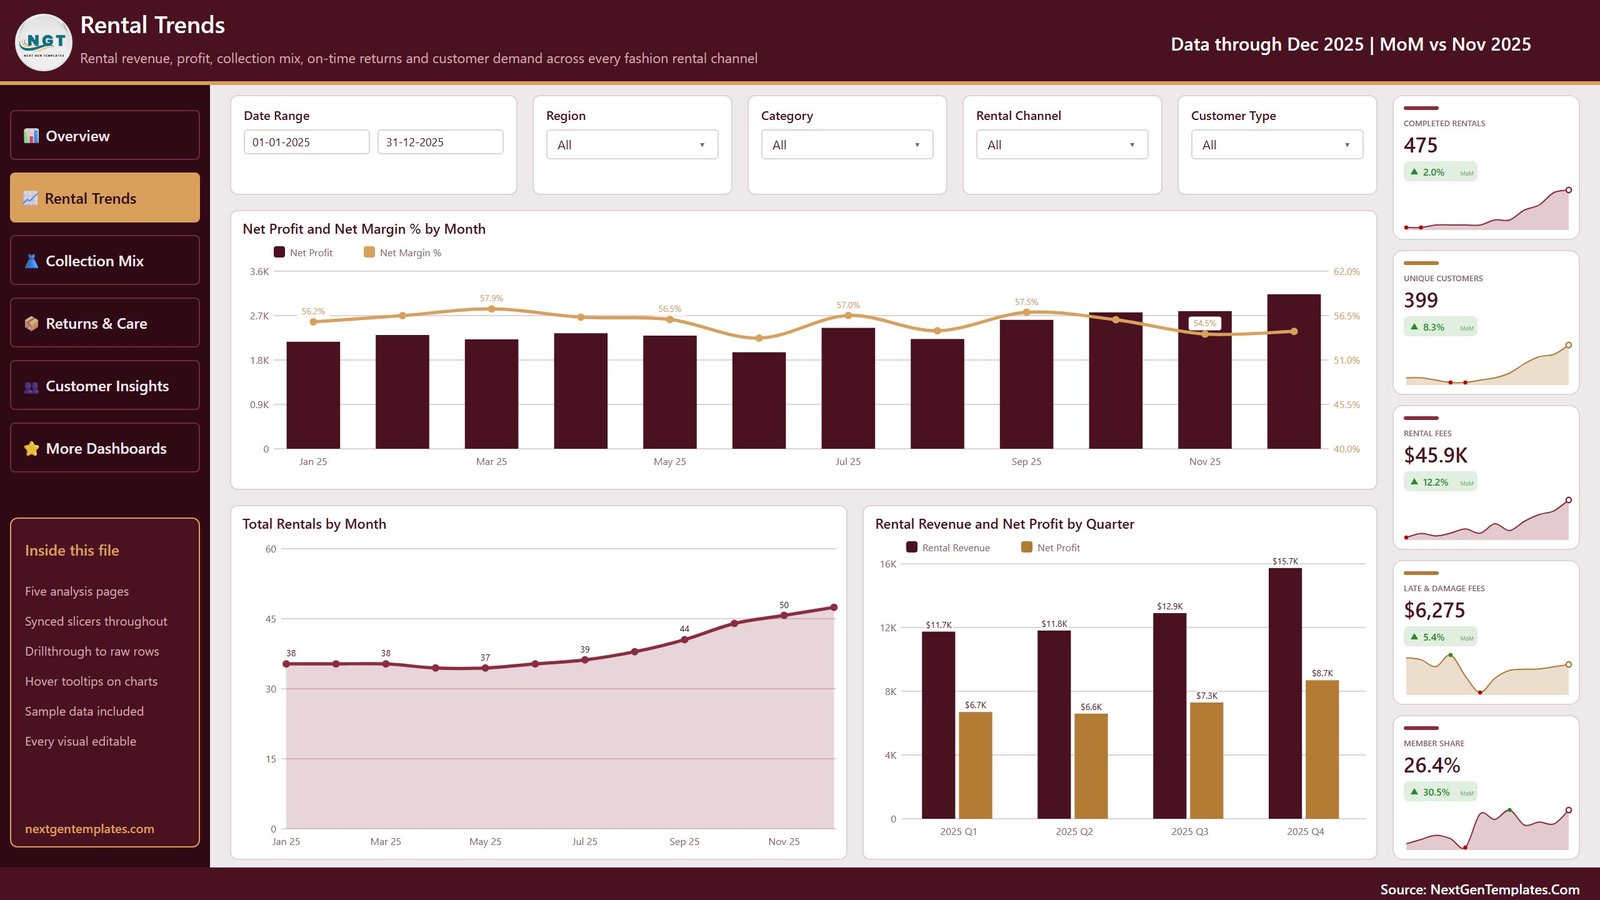
Cards for Completed Rentals, Unique Customers, Rental Fees, Late & Damage Fees and Member Share. Charts include Net Profit and Net Margin % by Month, Total Rentals by Month and Rental Revenue and Net Profit by Quarter.
Page 3: Collection Mix
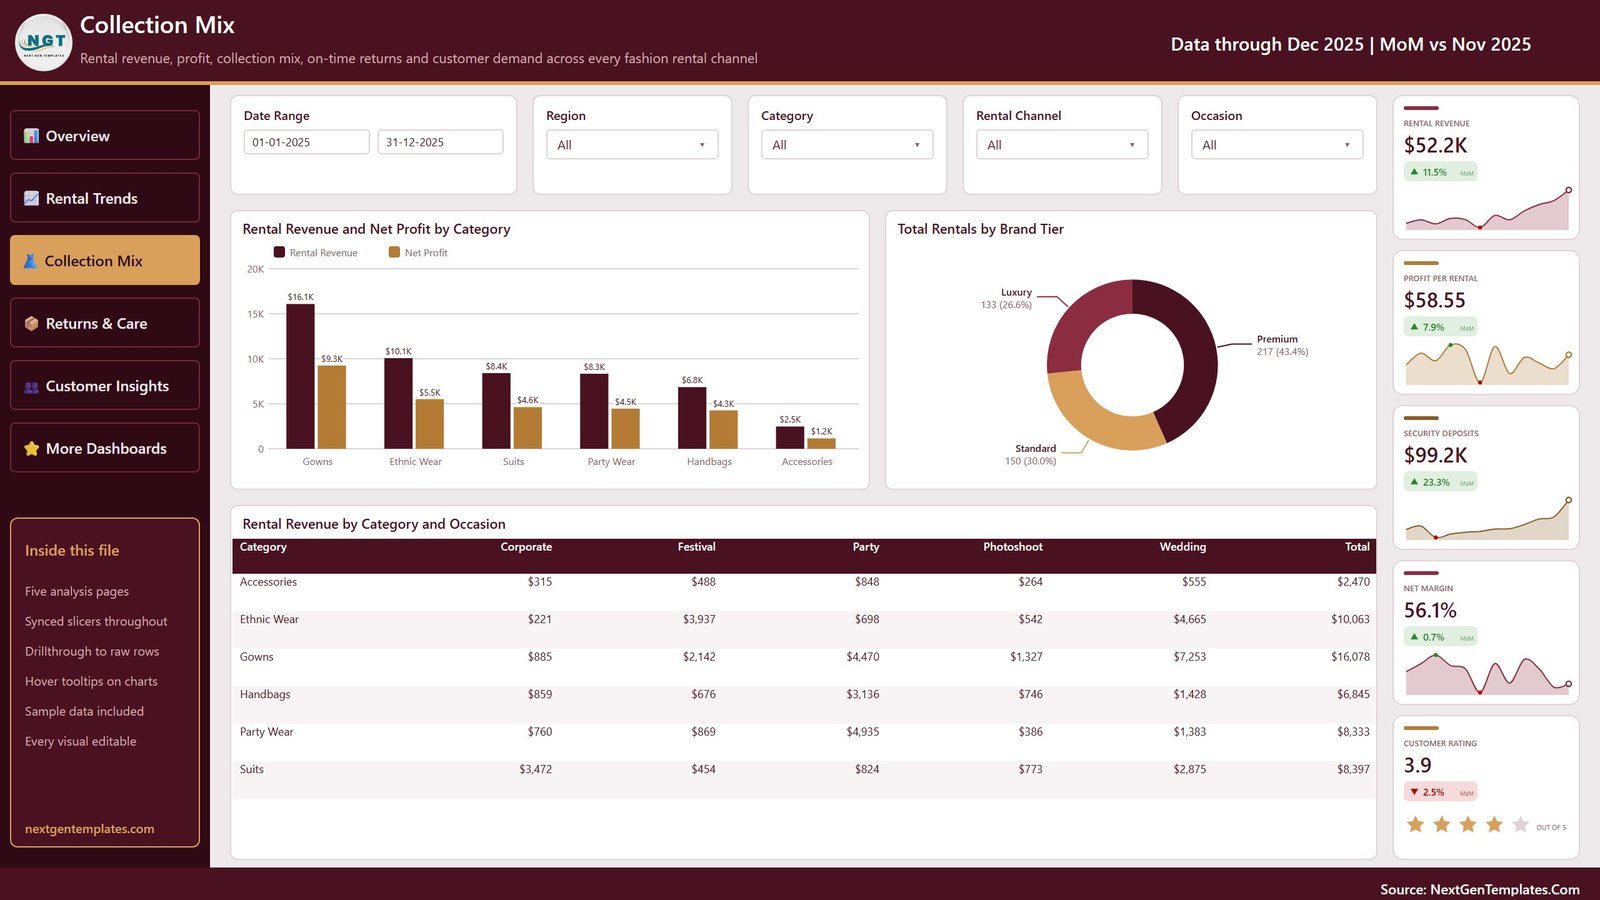
Cards for Rental Revenue, Profit per Rental, Security Deposits, Net Margin and Customer Rating. Visuals include Rental Revenue and Net Profit by Category, Total Rentals by Brand Tier and a Rental Revenue by Category and Occasion matrix.
Page 4: Returns & Care
Cards for On-Time Returns, Late Returns, Damage Rate, Late & Damage Fees and Completed Rentals. Visuals include Completed Rentals and On-Time Return Rate % by Month, Total Rentals by Rental Status and the Category Care Scorecard.
Page 5: Customer Insights
Cards for Unique Customers, Member Share, Rev. per Customer, Customer Rating and Total Rentals. Visuals include Rental Revenue and Avg. Revenue per Rental by Region, Avg. Customer Rating by Customer Type and the Rental Channel Scorecard.
📊 This Template vs. Tableau / Qlik vs. Rental Management SaaS
| Feature | Fashion Rentals Power BI template | Tableau / Qlik build | Rental management SaaS |
|---|---|---|---|
| Cost | ✅ $17.99 one-time (sale) | Tool licence plus build time | Monthly subscription |
| Platform | Power BI Desktop (free, Windows) | Tableau or Qlik | Vendor web app |
| Setup time | ✅ Opens populated with sample data | Report built from scratch | Onboarding and data import |
| Booking, payments and inventory holds | Not included (reporting only) | Not included | ✅ Core feature |
| Returns and damage analysis | ✅ Dedicated Returns & Care page | Build it yourself | Varies by vendor |
| Customizable visuals and measures | ✅ Every visual editable | ✅ Yes | Limited to vendor reports |
| Share with a team | Publish to Power BI Service (licence needed) | Server or cloud licence | ✅ Built-in user accounts |
| Mobile access | Power BI mobile app after publishing | Vendor mobile app | ✅ Usually included |
| Data ownership | ✅ Your own Excel file | ✅ Your own source | Stored with the vendor |
For rental owners who already keep a rental log and want clear reporting without another monthly subscription, this template sits in the sweet spot.
👥 Who This Template Is For, and Who It Is Not For
✅ Built for:
- Owners of dress, suit, ethnic wear and handbag rental shops who log rentals in Excel
- Operations managers comparing Website, Mobile App, Boutique and Pop-Up rentals
- Analysts and consultants who need a ready Power BI report to adapt for a rental client
❌ Not for:
- Businesses that need booking calendars, availability holds, payments or deposit refunds (this is a reporting template, not rental management software)
- Teams without Power BI Desktop, or who cannot run it on Windows
⚙️ How to Use It
- Install Power BI Desktop from Microsoft, then unzip the download.
- Open the .pbix and click through the five pages using the sample data.
- Replace the sample rows in Data.xlsx with your rentals, keeping the 21 column headers.
- If you move the workbook, update its path in Power Query (Transform data, Data source settings), then click Refresh.
- Use the slicers to filter by date, region, category and channel, and publish to the Power BI Service if your team needs access.
New to the tool? Microsoft’s Get started with Power BI Desktop guide covers installing and refreshing reports.
💼 Real-World Use Cases
Meera runs a bridal and ethnic wear rental studio. She filters the Collection Mix page to the Wedding occasion to see which categories earn the most, then checks the Returns & Care scorecard before buying more gowns.
Daniel manages a suit rental business with a website and two boutiques. He uses the Rental Channel Scorecard to compare net margin by channel and decides where to spend on promotion.
Aisha is a freelance BI consultant. She starts from this report for a fashion rental client, swaps in their rental log and hands over a branded file in an afternoon instead of building every page herself.
❓ Frequently Asked Questions
What software do I need?
You need Power BI Desktop, a free Microsoft download that runs on Windows. Mac users need a Windows virtual machine or a Windows PC. Sharing the report with colleagues through the Power BI Service needs a Power BI licence from Microsoft.
Can I use my own rental data?
Yes. Replace the rows in Data.xlsx with your own rentals while keeping the column headers, such as Rental Date, Category, Rental Channel, Rental Fee and Rental Status. Then refresh the report in Power BI Desktop and every page updates.
Is this a booking or rental management system?
No. The Fashion Rentals Dashboard in Power BI is a reporting template. It analyses rentals you have already recorded. It does not take bookings, hold stock, process payments or refund deposits.
Which KPIs does it track?
It tracks 17 distinct KPIs on 25 cards, including Rental Revenue, Net Profit, Net Margin, Avg. per Rental, On-Time Returns, Late Returns, Damage Rate, Security Deposits, Member Share, Rev. per Customer and Customer Rating.
Is the sample data real?
No. All 500 rentals, customer names and figures are fictional and exist only to demonstrate the report. Replace them with your own records before using the numbers for decisions.
Is there an Excel edition?
An Excel edition of this dashboard is in preparation. This listing is the Power BI version, built as a separate .pbix report.
👤 About the Author
Built by PK, a Microsoft Certified Professional with 15+ years of Excel, Google Sheets and Power BI experience and founder of NextGenTemplates. Tutorials are on YouTube at @PKAnExcelExpert and @NextGenTemplates. Every template is built and checked before release.
🔗 Explore Related Templates
👜 Luxury Handbags Dashboard in Power BI for handbag sales and brand analysis.
🏪 Fashion Boutiques Dashboard in Power BI for boutique retail sales.
🔑 Rental Services Dashboard in Power BI for general rental businesses.
📊 Browse all Power BI Dashboard templates.
📖 Click here to read the detailed blog post
🎥 Visit our YouTube channel for step-by-step video tutorials
👉 YouTube.com/@NextGenTemplates
📅 Last updated: September 2026




























Reviews
There are no reviews yet.