

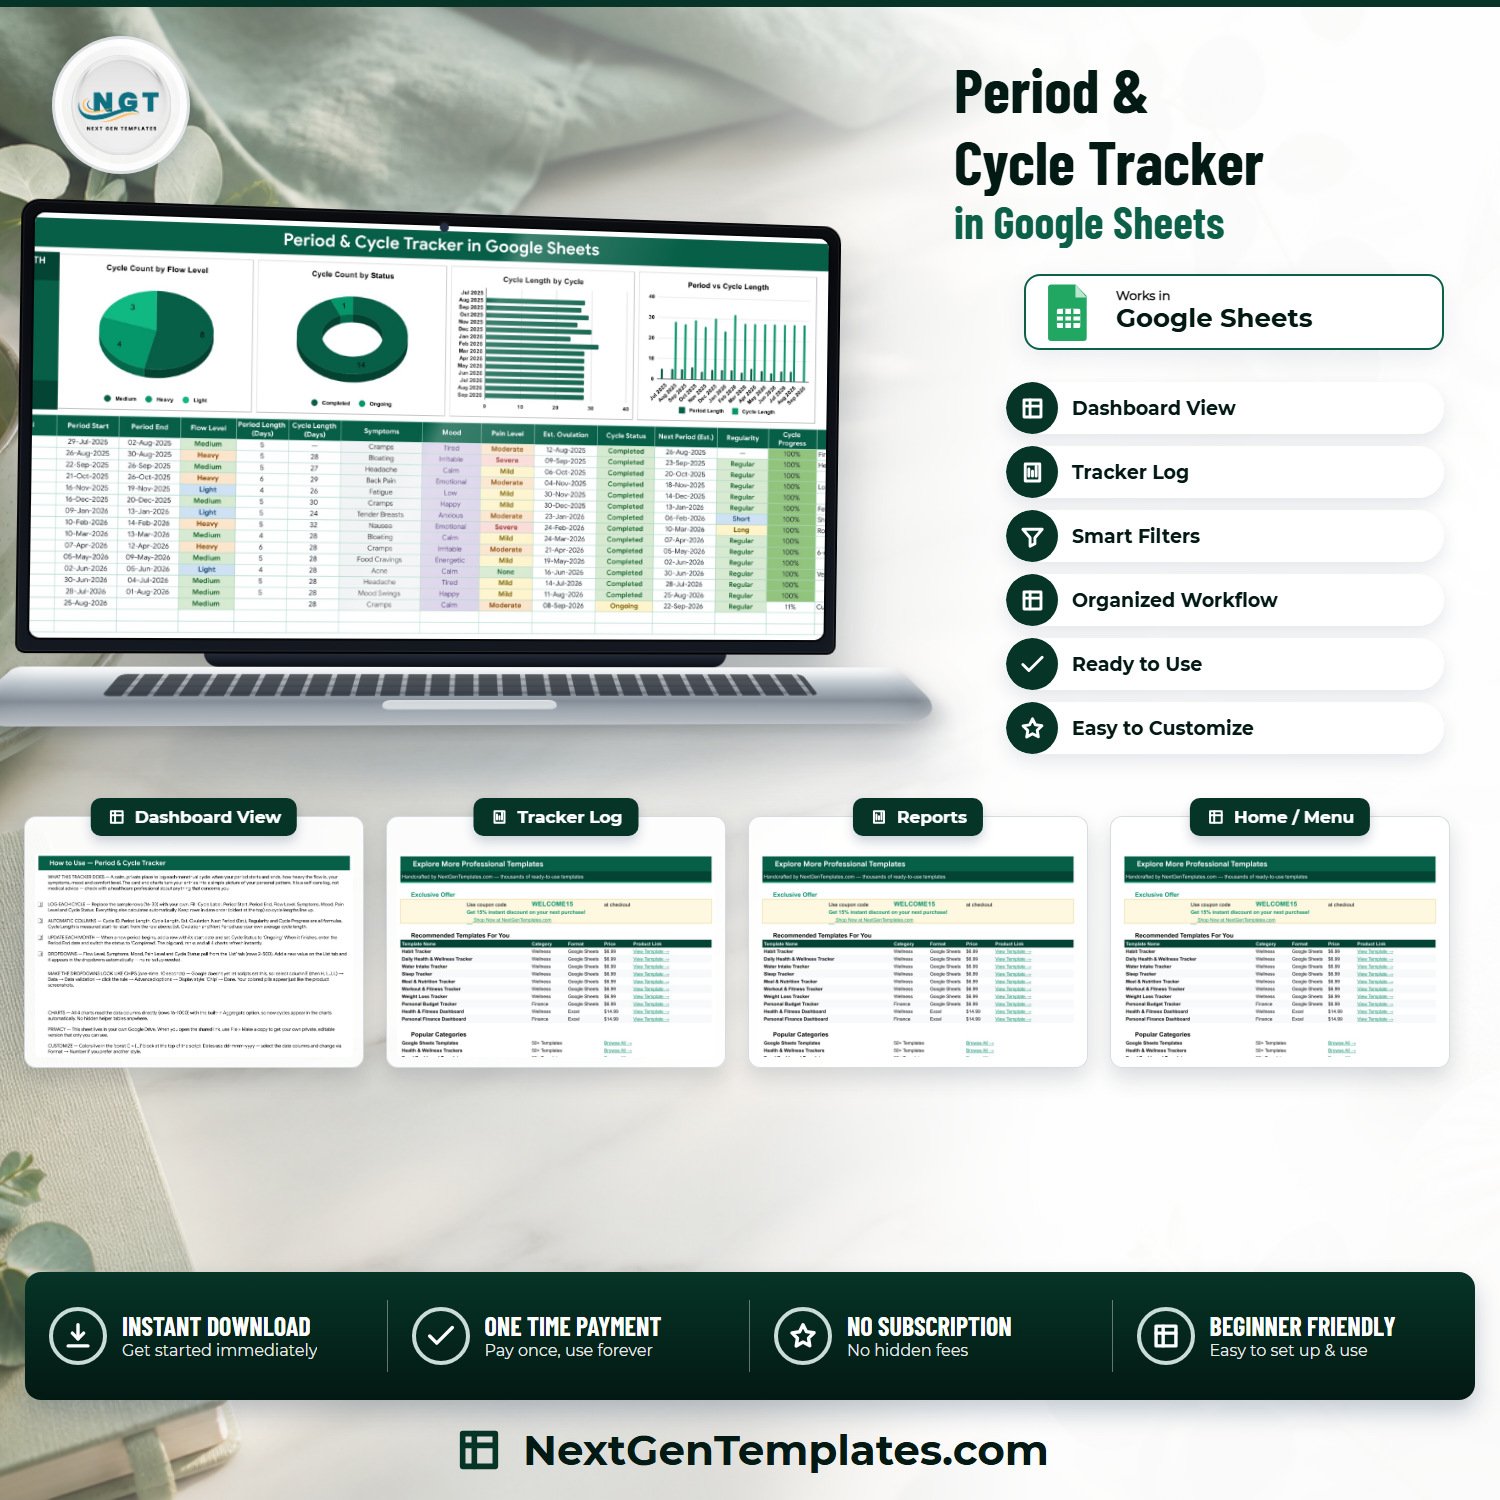

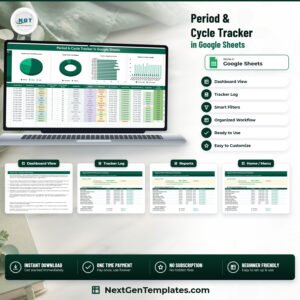
The Period & Cycle Tracker in Google Sheets is a plain, private record of your menstrual cycles. It is a four-tab Google Sheets file: one tracker page with a 16-column log, one summary card, four charts, a List tab that feeds every dropdown, a How to Use tab and an Explore More Templates tab. You type eight fields per cycle and seven more are calculated for you. Fifteen sample cycles are already in place so you can see the layout working before you clear them. It is a personal record-keeping template, not a medical device and not medical advice. One payment, no subscription, and the file lives in your own Google Drive.
Key Features of the Period & Cycle Tracker in Google Sheets
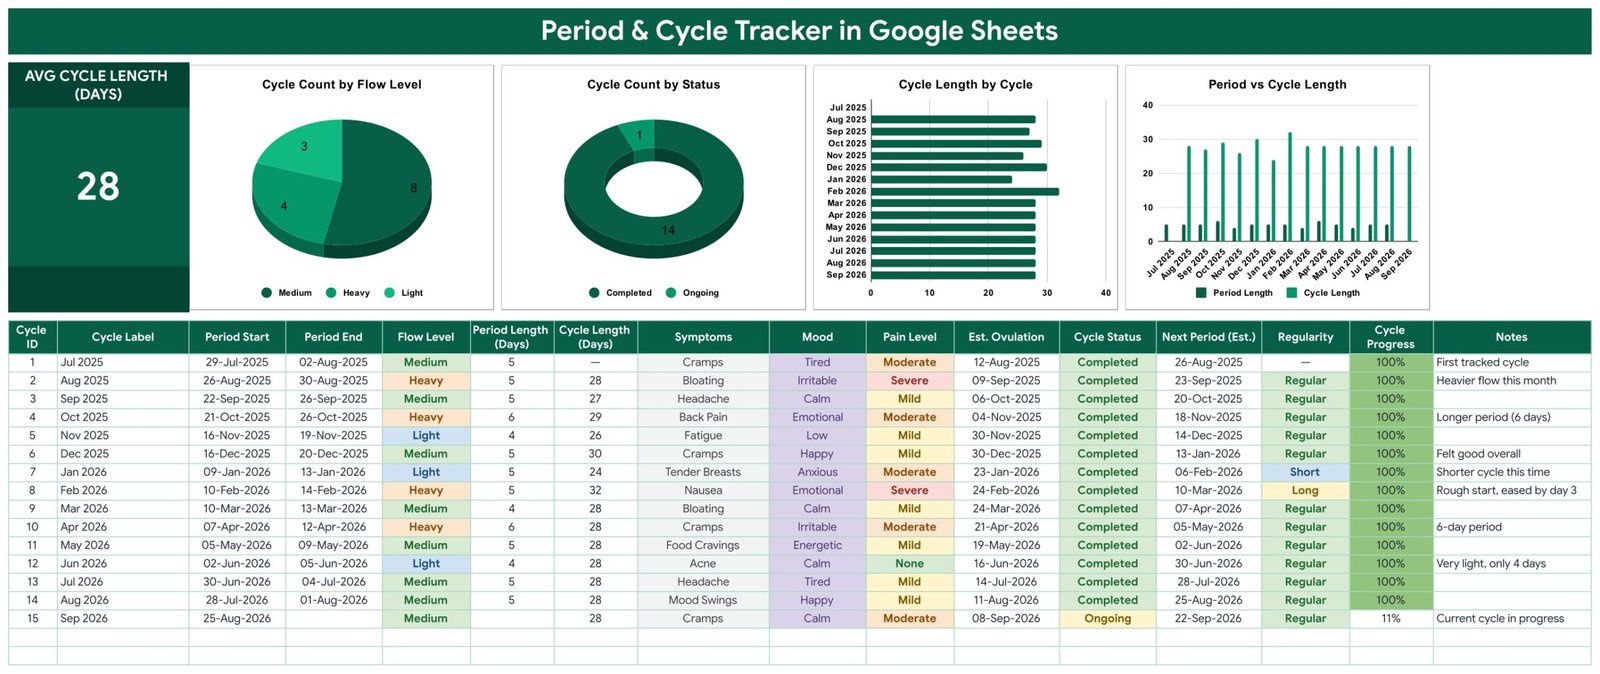
- One summary card – Avg Cycle Length (Days), the average of every completed cycle length in your log. In the sample data it reads 28.
- Four charts, named by what they measure – Cycle Count by Flow Level, Cycle Count by Status, Cycle Length by Cycle and Period vs Cycle Length.
- A 16-column cycle log – Cycle ID, Cycle Label, Period Start, Period End, Flow Level, Period Length (Days), Cycle Length (Days), Symptoms, Mood, Pain Level, Est. Ovulation, Cycle Status, Next Period (Est.), Regularity, Cycle Progress and Notes.
- Eight fields you type, seven the sheet works out – you enter Cycle Label, Period Start, Period End, Flow Level, Symptoms, Mood, Pain Level and Cycle Status. Cycle ID, Period Length, Cycle Length, Est. Ovulation, Next Period (Est.), Regularity and Cycle Progress are formulas.
- Cycle length measured start to start – each cycle length is the gap between that row’s Period Start and the one above it, which is how cycle length is normally counted.
- Regularity label – each completed cycle is marked Regular, Short or Long against your own average, so you can see at a glance which months sat outside your usual range.
- Cycle Progress – a percentage showing how far through the current cycle today is, based on your own average length.
- Dropdowns that grow with you – Flow Level, Symptoms, Mood, Pain Level and Cycle Status read rows 2-500 of the List tab. Add a value there and it appears in the dropdown immediately.
- Charts wired straight to the columns – all four read rows 16-1000 with the built-in Aggregate option. There are no hidden helper tables to maintain.
- Your copy, your Drive – the download is a PDF holding the copy link. File > Make a copy gives you a private version only you can see.
What’s Inside the Period & Cycle Tracker in Google Sheets
Tab 1 – Period & Cycle Tracker. The whole product sits on one page. A green title banner, the Avg Cycle Length card on the left, the four charts across the top, then the log table with its header on row 15 and your cycles from row 16 down. Fifteen demo cycles run from Jul 2025 to Sep 2026, fourteen marked Completed and one Ongoing; replace them with your own.
Tab 2 – List. Five columns that feed the dropdowns: Flow Level (Spotting, Light, Medium, Heavy, Very Heavy), Symptoms (eleven entries including Cramps, Bloating, Headache, Fatigue, Back Pain, Tender Breasts, Nausea, Acne, Food Cravings and Mood Swings), Mood (eight entries), Pain Level (None, Mild, Moderate, Severe) and Cycle Status (Completed, Ongoing, Predicted).
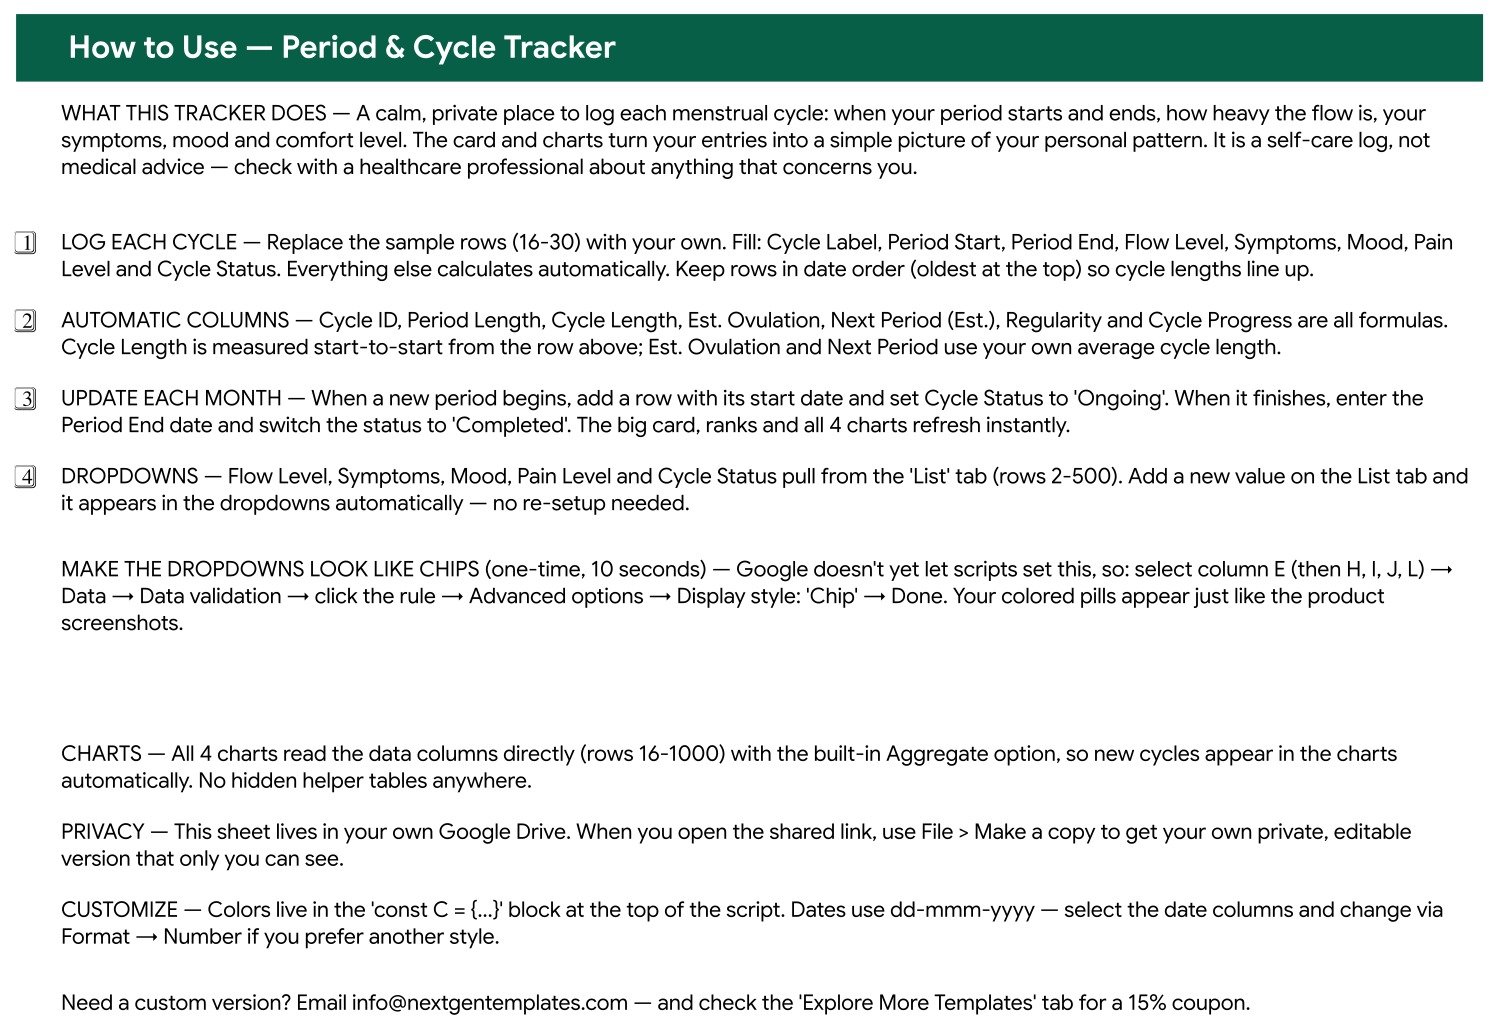
Tab 3 – How to Use. Nine short instructions written into the file itself: how to log a cycle, which columns are automatic, what to do when a new period starts, how the dropdowns work, the ten-second step that turns the dropdowns into coloured chips, how the charts are wired, the privacy note, and how to change the colours and the dd-mmm-yyyy date format.
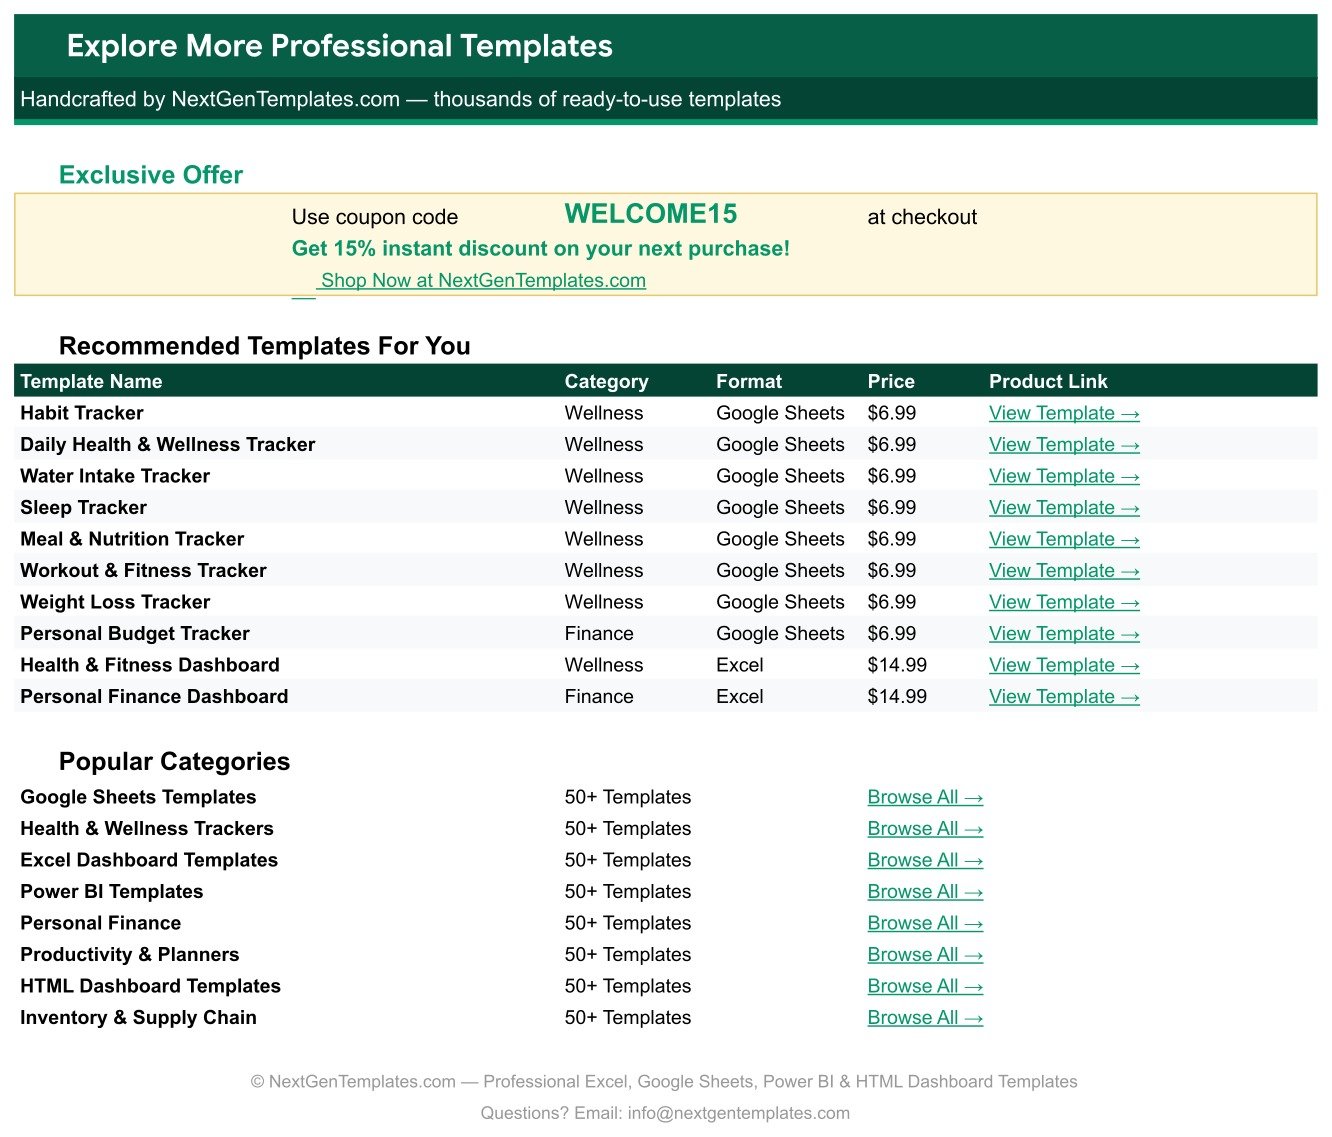
Tab 4 – Explore More Templates. A closing page with a 15% coupon code and links to related NextGenTemplates files.
Period & Cycle Tracker in Google Sheets vs. a Spreadsheet You Build Yourself vs. a Paid Period App
| This template | Your own spreadsheet | Paid period app subscription | |
|---|---|---|---|
| Cost | One payment | Free, plus your time | Roughly $5-$10 a month |
| Platform | Google Sheets, any browser | Google Sheets or Excel | Phone app |
| Setup time | Minutes – make a copy, clear the samples | Hours of formula and chart work | Minutes |
| Where the data lives | Your own Google Drive | Your own file | The vendor’s servers |
| Mobile access | Google Sheets mobile app | Google Sheets mobile app | Native app |
| Customisable fields | Yes – edit the List tab, add columns | Yes | Usually fixed |
| Share with a link | Yes, if you choose to | Yes | Limited |
| Year-one cost | The purchase price | Free | Around $60-$120 |
| Cycle length, regularity and estimates | Built in as formulas | You write them | Built in |
| Reminders and notifications | No – this is a log, nothing pings you | No | Yes |
Who This Template Is For – and Who It’s Not For
It fits anyone who wants a written record of their cycles in a file they control: someone who prefers a spreadsheet to a phone app, someone gathering dates and symptoms to take to an appointment, someone who already lives in Google Sheets, or someone who simply wants to stop guessing when their last period was.
It does not fit if you want push notifications or reminders – the sheet has none. It is not the right tool if you need a clinically validated symptom questionnaire, encrypted or HIPAA-compliant storage, or anything that qualifies as a medical record. It is not a contraceptive method and it is not fertility software: the Est. Ovulation and Next Period (Est.) columns are ordinary arithmetic on your own average cycle length, nothing more. If you are tracking for conception, contraception or a diagnosis, work with a healthcare professional and treat this sheet as notes, not as a decision.
How to Use the Period & Cycle Tracker in Google Sheets
- Make your own copy. Open the PDF in your download, click the Google Sheets link, then File > Make a copy. The copy is private to your Drive.
- Clear the sample cycles. Rows 16-30 hold the demo data. Delete the contents and keep the formatting.
- Log your first cycle. Fill Cycle Label, Period Start, Period End, Flow Level, Symptoms, Mood, Pain Level and Cycle Status. Keep the rows in date order, oldest at the top, so the cycle lengths line up.
- Add a row each month. When a period starts, add the row with its start date and set Cycle Status to Ongoing. When it finishes, enter the Period End date and switch the status to Completed. The card and all four charts update as you type.
- Turn on the coloured chips once. Select column E, then H, I, J and L, and use Data > Data validation > Advanced options > Display style: Chip. Google does not let a script set this, so it is a one-time ten-second step.
- Tailor the lists. Add your own symptoms, moods or flow levels on the List tab and they show up in the dropdowns straight away.
Real-World Use Cases
Priya, preparing for an appointment. Her GP asked how long her cycles have been running. Rather than scrolling through a year of phone notes, she opens the sheet, reads 28 off the Avg Cycle Length card, and points at the two rows the Regularity column flagged Short and Long. The conversation starts from a record instead of a memory.
Hannah, who dislikes health apps. She wants the log without handing her cycle data to a company. She keeps the copy in her own Drive, shares it with nobody, and types eight fields once a month.
Maya, watching a pattern. She has noticed that heavier months seem to come with worse cramps. The Flow Level and Pain Level columns are dropdowns, so after six months the Cycle Count by Flow Level chart and her own notes give her something concrete to look at – a description of what she recorded, not a diagnosis.
Frequently Asked Questions
Does this template predict my next period?
It estimates it. The Next Period (Est.) column adds your own average cycle length to the current Period Start date. It is arithmetic on the numbers you typed, so it moves as your average moves, and it cannot account for anything that changes a cycle.
What exactly is the Est. Ovulation column?
The same kind of arithmetic – a date derived from your own average cycle length. It is a rough marker for your log, not a fertility test, not a fertile-window prediction, and it must not be used for contraception or for planning a pregnancy.
Is this a medical device or medical advice?
No. It is a personal record-keeping spreadsheet. It does not diagnose, screen, treat or monitor any condition, and nothing in it should replace a conversation with a qualified healthcare professional. The file says the same thing on its own How to Use tab.
Who can see what I log?
Only the people you share your copy with. After File > Make a copy, the sheet sits in your Google Drive under your account. It is ordinary Google Sheets storage, not encrypted or HIPAA-compliant storage, so treat it the way you would treat any personal file.
Will it remind me when a period is due?
No. There are no reminders, alerts or notifications anywhere in the file. It is a log you open and update.
Can I add my own symptoms and moods?
Yes. The List tab drives every dropdown from rows 2 to 500. Type a new value in the right column and it appears in the dropdown with no other setup.
Do I need Excel or any add-on?
No. It runs in Google Sheets in any browser, with the free Google Sheets mobile app if you want it on your phone. No add-ons, no macros, no subscription.
About the Author
Built by PK – Microsoft Certified Professional with 15+ years of Excel, Google Sheets, and Power BI experience. Founder of NextGenTemplates, reaching 300K+ subscribers across YouTube channels. Every template is hand-built and tested before release.
Explore Related Templates
- Symptom & Pain Diary Tracker in Google Sheets – a day-by-day symptom and pain log to sit alongside this one.
- Mood & Mental Health Tracker in Google Sheets – if you want mood recorded daily rather than once per cycle.
- Medication & Pill Tracker in Google Sheets – for what you take and when.
- Sleep Tracker in Google Sheets – nightly sleep hours and quality.
- Doctor Appointments & Medical History Tracker in Google Sheets – visits, notes and follow-ups in one place.
- Browse every Google Sheets tracker or the full Google Sheets template catalogue.
Get the Period & Cycle Tracker in Google Sheets. One payment, instant download, and a PDF with the copy link inside. Make your copy, clear the fifteen sample rows, and log your first cycle in a couple of minutes.
This template is a personal record-keeping tool. It is not a medical device, it is not medical advice, and it is not a contraceptive or fertility method. Please speak to a qualified healthcare professional about anything that concerns you.
Watch the step-by-step video Demo:
Last updated: 1 September 2026.
Compatibility and Requirements
- Works in Google Sheets. You need a free Google account and a web browser. The free Google Sheets mobile app also opens it.
- The Flow Level, Symptoms, Mood, Pain Level and Cycle Status columns are dropdowns fed by the List tab. Google explains how they work in Create an in-cell dropdown list.








Reviews
There are no reviews yet.