

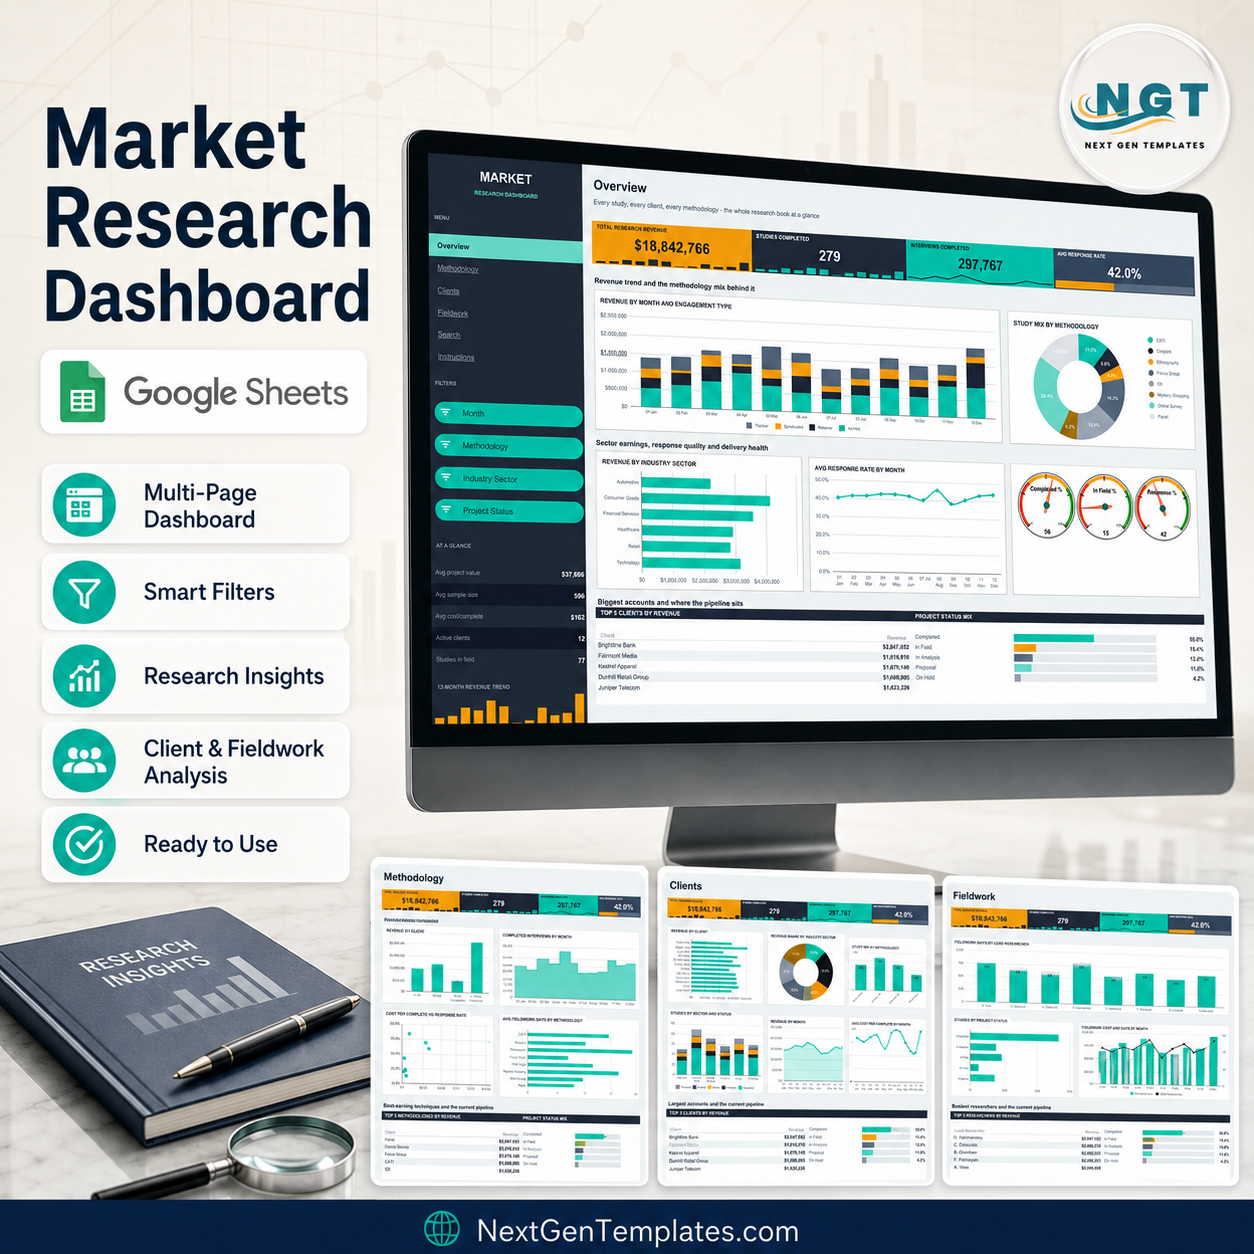

The Market Research Dashboard in Google Sheets turns a flat study log into a six-tab reporting pack: 4 KPI tiles that repeat on every report page, 17 charts, 3 gauge dials and 15 native slicers across four report pages, plus a study lookup and a built-in user guide. The sample book ships with a full 12 months of fieldwork across 500 studies, 12 clients, 8 methodologies, 6 industry sectors, 6 target audiences and 8 lead researchers, showing $18,842,766 in research revenue, 279 studies completed, 297,767 interviews completed and a 42.0% average response rate. Every pivot, slicer and formula is pre-wired to 1,000 data rows, so you paste your own studies over the demo rows and the whole book redraws itself. One-time payment, no subscription, and the file lives in your own Google Drive.
It is built on native Google Sheets pivot tables and slicers – not screenshots, not an add-on, not a script that has to run on a schedule. That matters for an agency: the file keeps working with nothing installed, and a client you share the link with can filter the book themselves without ever touching your Data tab.
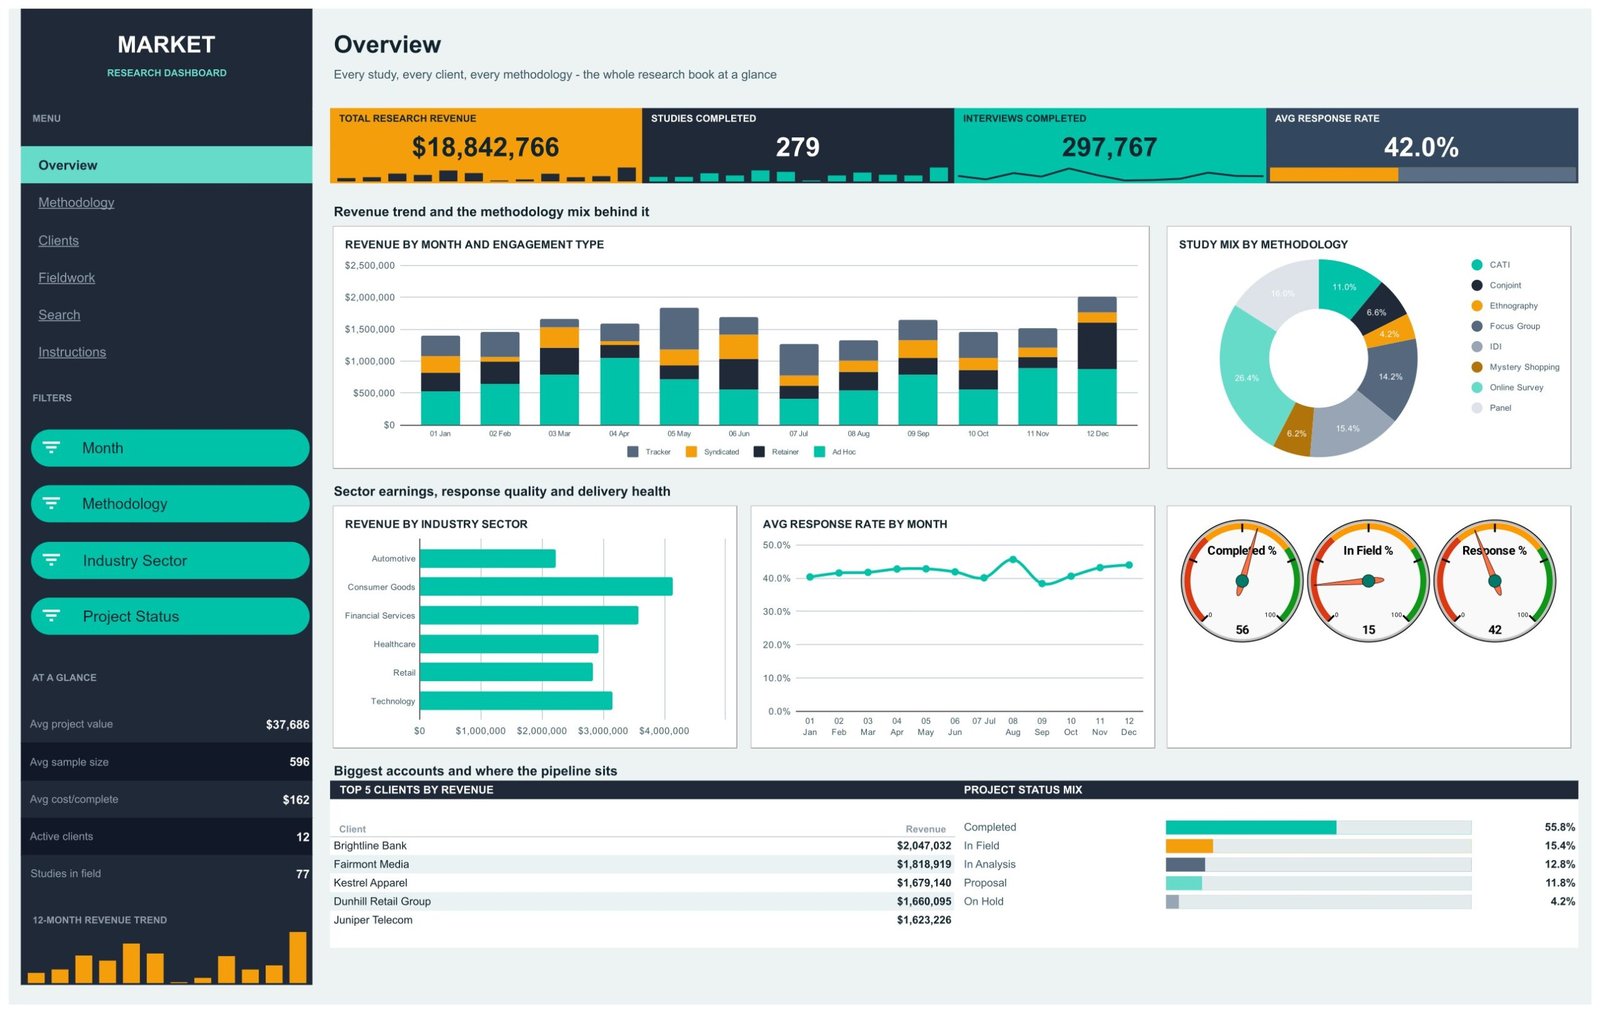
Key Features of the Market Research Dashboard in Google Sheets
- Six tabs, four of them full report pages – Overview, Methodology, Clients and Fieldwork, plus a Search lookup and an Instructions guide.
- Four KPI tiles on every report page – Total Research Revenue, Studies Completed, Interviews Completed and Avg Response Rate, each with its own inline sparkline so the headline numbers travel with you as you move between pages.
- An At a Glance rail – Avg project value, Avg sample size, Avg cost/complete, Active clients and Studies in field sit in the dark navigation rail alongside a 12-month revenue sparkline.
- 15 native slicers – Month, Methodology, Industry Sector, Project Status, Target Audience, Client and Lead Researcher, each wired to every pivot on its own page.
- 17 charts and 3 gauge dials – stacked columns, donuts, bars, lines, a stepped area, a scatter and a cost-vs-days combo, plus Completed %, In Field % and Response % gauges on the Overview.
- Four Top 5 panels – Top 5 Clients by Revenue, Top 5 Methodologies by Revenue and Top 5 Researchers by Revenue, each paired with a Project Status Mix bar panel.
- Study Search page – type a Study ID such as MR-0001 and all 17 fields of that record fill in instantly through INDEX/MATCH wrapped in IFERROR.
- 1,000 rows pre-wired – the pivots read A1:Q1001, so paste your studies over the sample and nothing needs extending.
- Works in any browser – share view-only with a client and they filter it themselves.
- One-time payment – no seat licence, no renewal, and the file is yours in your own Drive.
What’s Inside the Market Research Dashboard in Google Sheets
Overview is the executive page. Revenue by Month and Engagement Type stacks Tracker, Syndicated, Retainer and Ad Hoc work across 12 months; Study Mix by Methodology splits the book into Online Survey 26.4%, Panel 16.0%, IDI 15.4%, Focus Group 14.2%, CATI 11.0%, Conjoint 6.6%, Mystery Shopping 6.2% and Ethnography 4.2%. Underneath, Revenue by Industry Sector, Avg Response Rate by Month and the three gauge dials show earnings, answer quality and delivery health side by side, with Top 5 Clients by Revenue and the Project Status Mix closing the page.
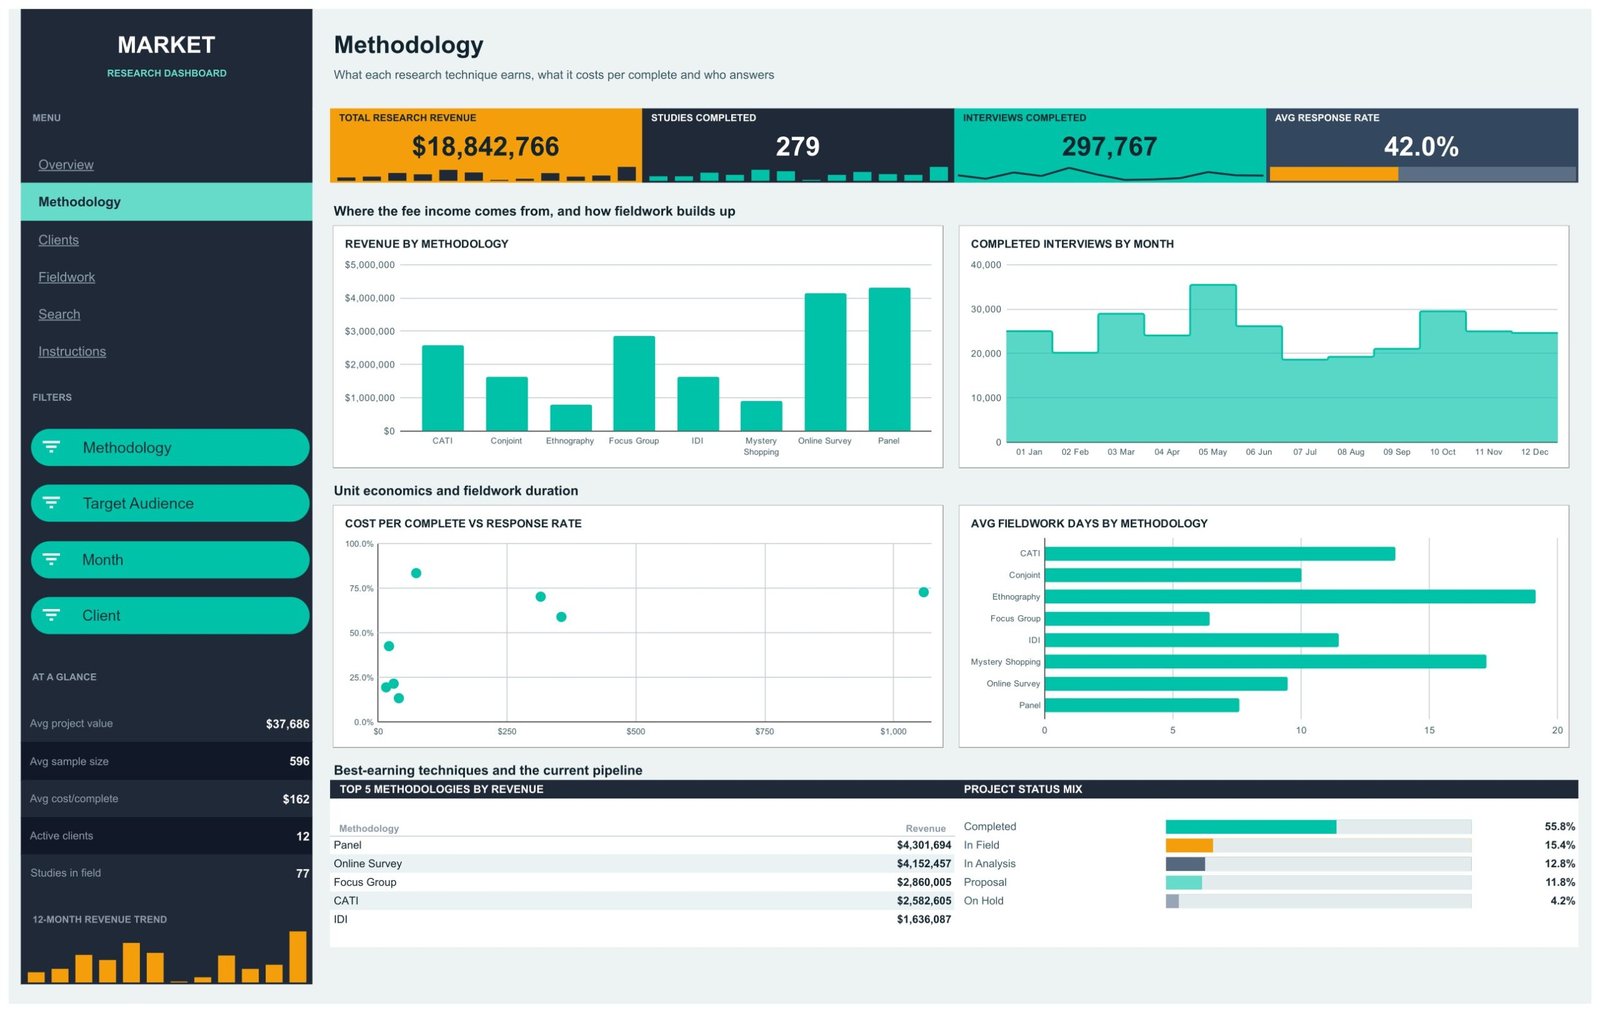
Methodology answers what each technique earns and what it costs. Revenue by Methodology and Completed Interviews by Month sit above Cost per Complete vs Response Rate – a scatter that shows the expensive techniques are not always the ones people answer – and Avg Fieldwork Days by Methodology, where Ethnography runs past 19 days while Focus Groups close in under 7. Top 5 Methodologies by Revenue reports Panel $4,301,694, Online Survey $4,152,457, Focus Group $2,860,005, CATI $2,582,605 and IDI $1,636,087.
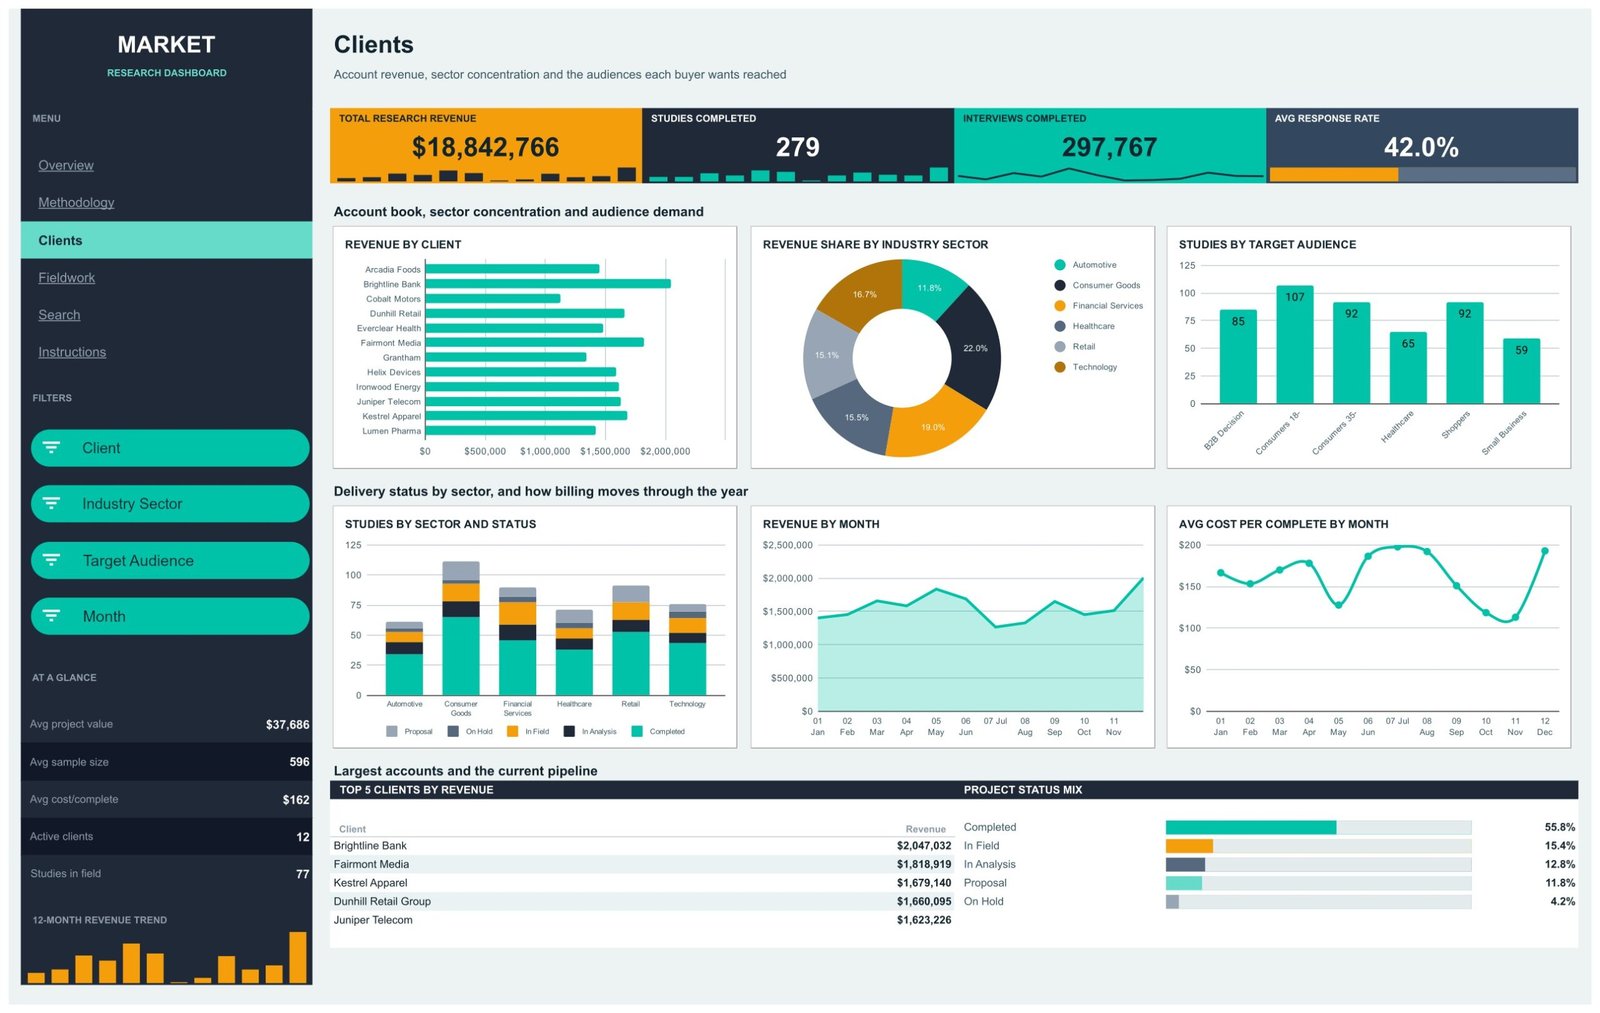
Clients is the account book. Revenue by Client ranks all 12 accounts, Revenue Share by Industry Sector splits the year into Consumer Goods 22.0%, Financial Services 19.0%, Technology 16.7%, Healthcare 15.5%, Retail 15.1% and Automotive 11.8%, and Studies by Target Audience counts B2B Decision Makers 85, Consumers 18-34 107, Consumers 35+ 92, Healthcare 65, Shoppers 92 and Small Business 59. Studies by Sector and Status, Revenue by Month and Avg Cost per Complete by Month finish the page.
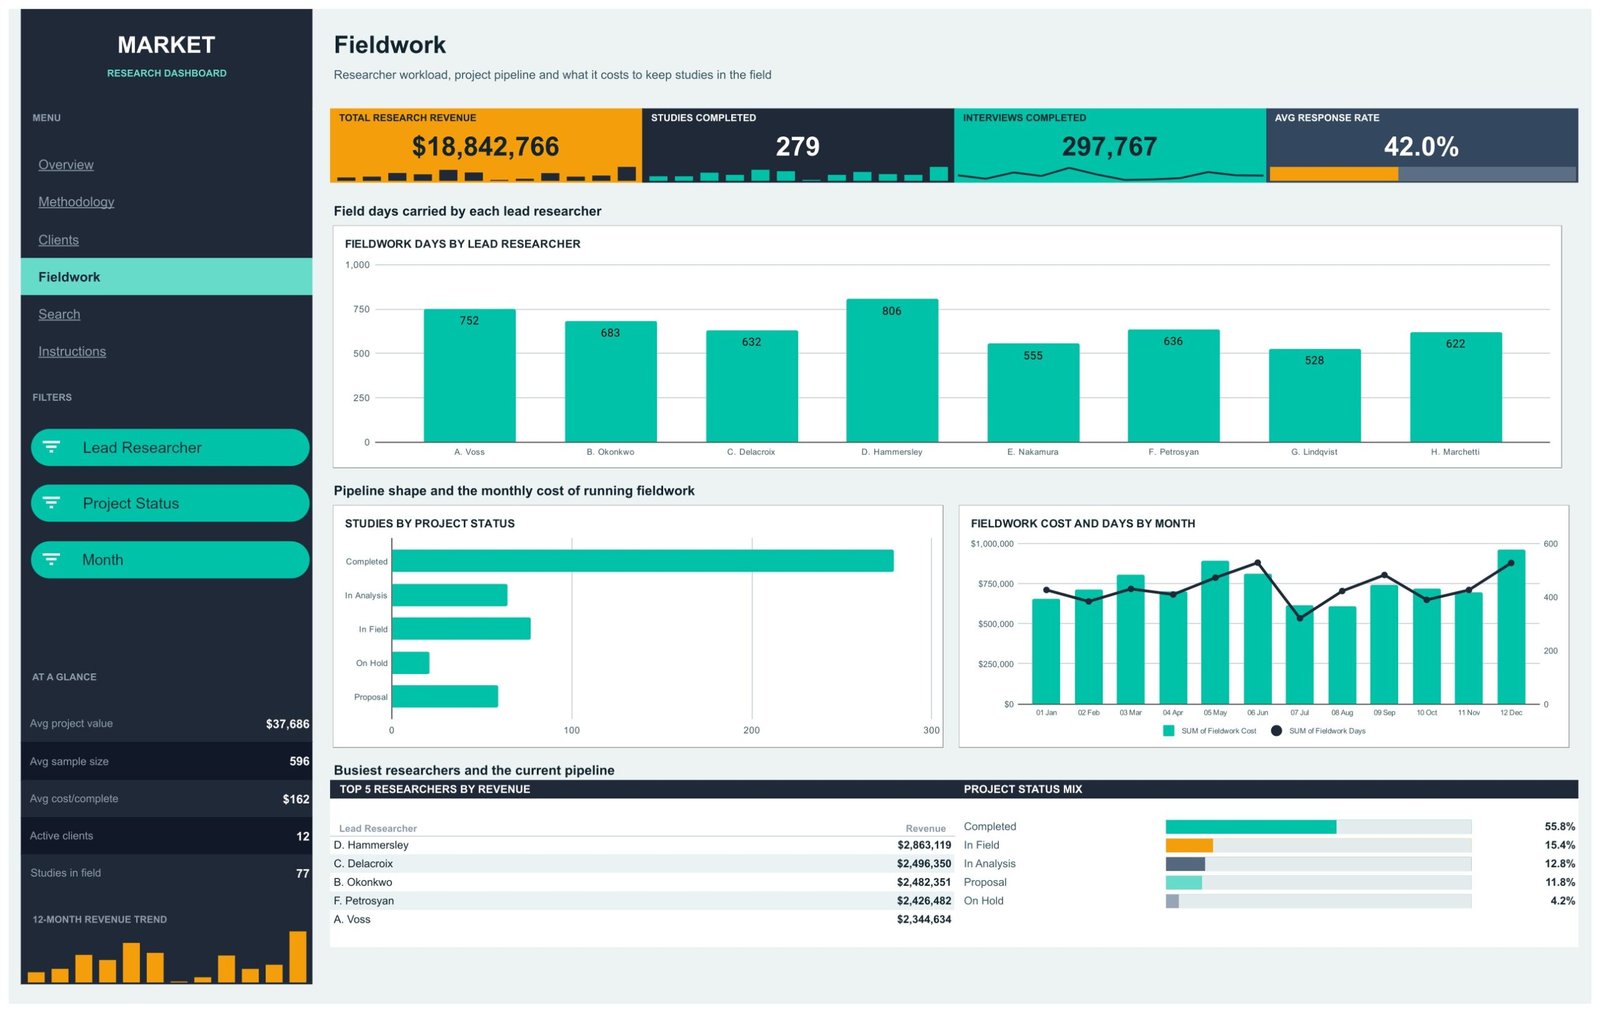
Fieldwork is the delivery page. Fieldwork Days by Lead Researcher labels every bar – D. Hammersley 806 days down to G. Lindqvist 528 – Studies by Project Status shows the pipeline shape, and Fieldwork Cost and Days by Month puts spend as columns against days as a line so an overrun is visible in the month it happened.
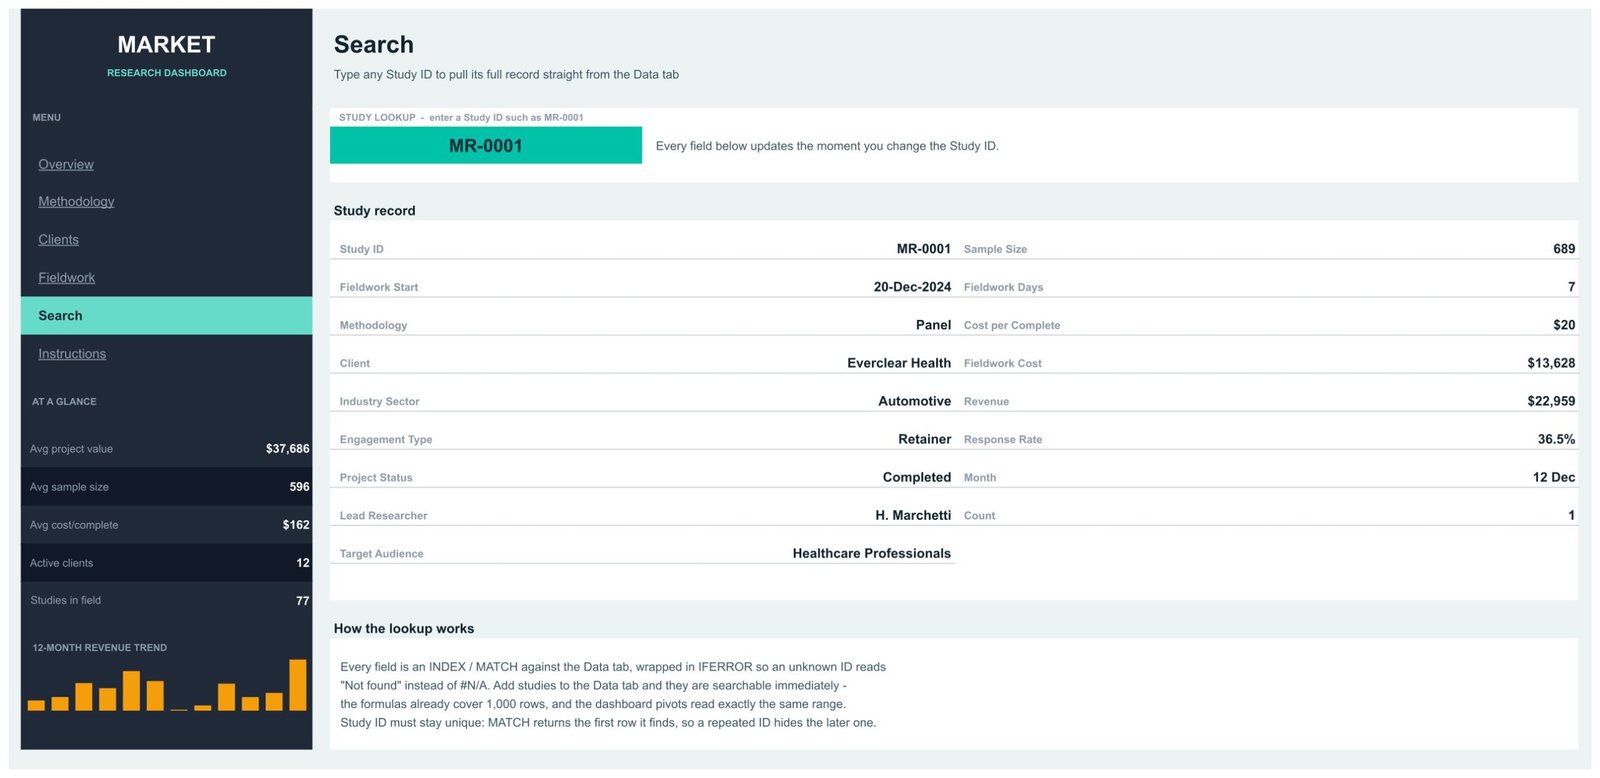
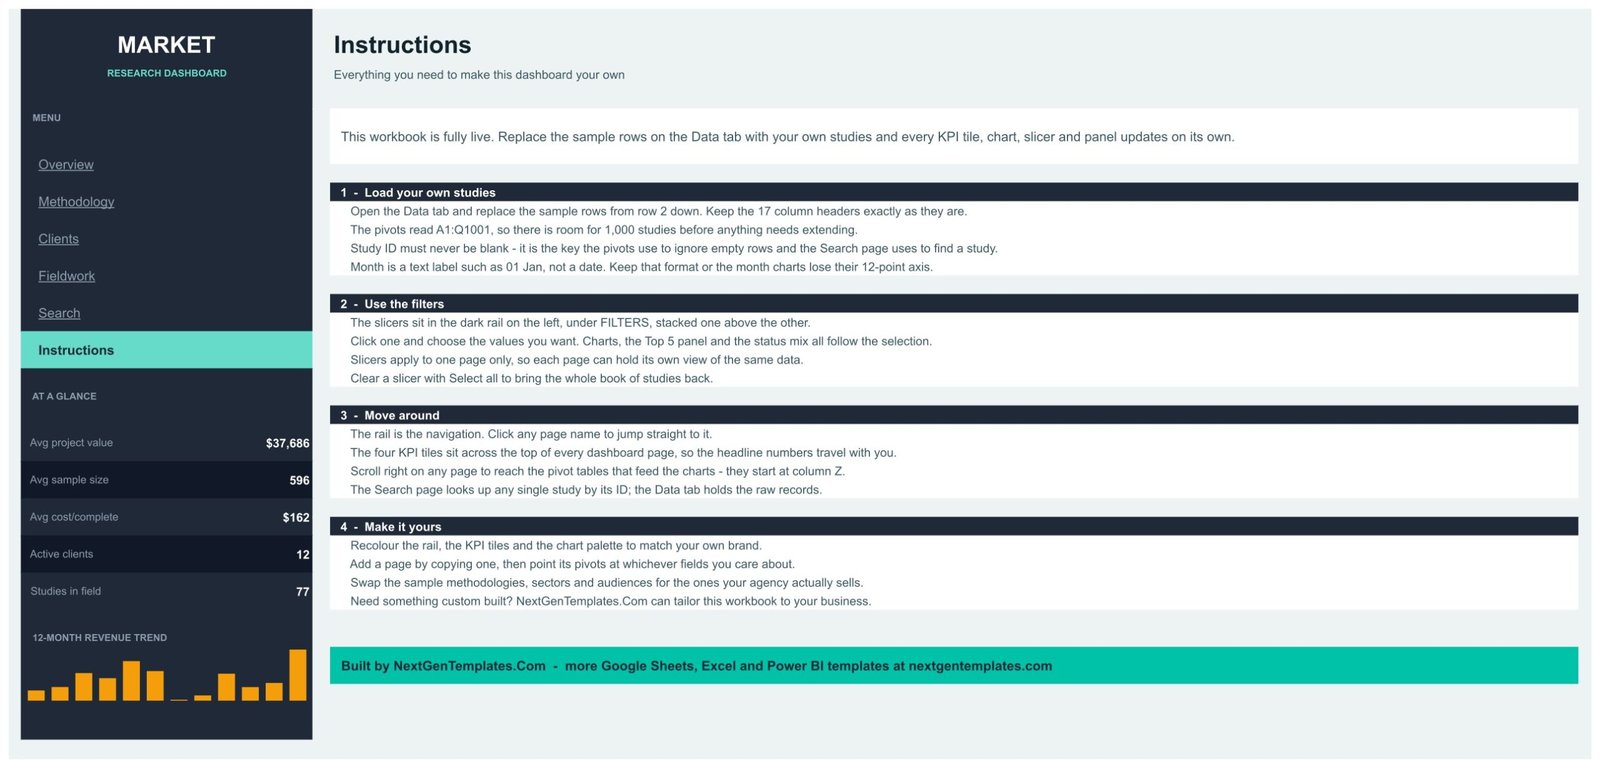
Search pulls one study. Enter MR-0001 and you get client, sector, methodology, engagement type, status, lead researcher, target audience, sample size, fieldwork start and days, cost per complete, fieldwork cost, revenue, response rate and month – all from the Data tab, no filtering required. Instructions is a four-part guide covering loading your own studies, using the filters, moving around the book and recolouring it for your brand.
Market Research Dashboard vs. Excel vs. Paid Research Analytics SaaS – Where This Fits
| This template (Google Sheets) | Excel dashboard | Paid research platform | |
|---|---|---|---|
| Cost | One-time $9.99 | One-time, plus an Office licence | $1,200-$5,000+ per year |
| Platform | Any browser, any OS | Windows or Mac desktop | Vendor web app |
| Setup time | Under 10 minutes | 15-30 minutes | Days, often with onboarding |
| Real-time team collaboration | Yes, native | Only via OneDrive co-authoring | Yes, per seat |
| Mobile access | Sheets app, free | Excel mobile, limited | Vendor app |
| Customizable fields | All 17 columns, freely | All columns, freely | Only what the vendor exposes |
| Share with a client by link | Yes, view-only in one click | Send a file, or a OneDrive link | Extra viewer seats |
| Year-1 cost at 5 users | $9.99 | $9.99 plus licences | $3,000+ |
| Study-level lookup | Built in on the Search page | Needs a formula you write | Yes |
| Cost per complete and response-rate tracking | Charted on two pages | Build it yourself | Yes |
Who This Template Is For – and Who It’s Not For
It fits boutique and mid-size research agencies running 50-500 studies a year, insight teams inside brands who commission fieldwork and need one place to report it, and freelance researchers who bill by project and want cost per complete visible before the invoice goes out. It also fits anyone who has to hand a client a filtered view without giving them the underlying respondent data.
It is not for you if you need live survey collection – this reports on studies, it does not field them. It is not a respondent database, it holds no personally identifiable data, and it will not replace a panel provider’s platform. If your book runs past a few thousand studies a year, move the same structure into Market Research Dashboard in Power BI instead.
How to Use the Market Research Dashboard in Google Sheets
- Open the PDF in your download and click the copy link. Google Drive makes your own editable copy.
- Open the Data tab and replace the sample rows from row 2 down. Keep the 17 column headers exactly as they are.
- Keep Study ID unique and never blank – it is the key the pivots use to ignore empty rows and the Search page uses to find a study.
- Keep Month as a text label such as 01 Jan, not a date, or the month charts lose their 12-point axis.
- Refresh nothing. Every KPI tile, chart, slicer and panel updates on its own.
- Use the slicers in the dark rail to filter a page. Slicers apply to one page only, so each page can hold its own view of the same data.
- Recolour the rail, the KPI tiles and the chart palette to match your agency’s brand.
- Share the file view-only when you send it to a client.
Real-World Use Cases
Priya runs a 9-person insight agency. She used to rebuild a revenue-by-client chart every quarter. Now she filters the Clients page by Month, exports it to PDF and the quarterly review takes twenty minutes instead of a morning.
Daniel is a fieldwork manager. He watches Fieldwork Cost and Days by Month. When June’s cost column climbed while the days line stayed flat, he traced it to two Ethnography studies with an inflated cost per complete and repriced the next wave.
Mei is a freelance quant researcher. She keeps every study she has ever run in one Data tab and uses the Search page to answer “what did we charge for that Panel study last December” without scrolling a single row.
Frequently Asked Questions
Do I need Excel, Power BI or an add-on?
No. It is a Google Sheets file built on native pivot tables and slicers. Nothing is installed, and nothing needs a schedule to run.
How many studies does it handle?
The pivots and the Search formulas are wired to A1:Q1001, so 1,000 studies fit with no changes. Extend the ranges if you need more.
Why don’t the four KPI tiles change when I click a slicer?
The tiles report the whole book by design, so the headline numbers stay comparable as you filter. The charts, the Top 5 panels and the status mix all follow your selection.
Is the sample data real?
No. The 500 studies, 12 clients and 8 researchers are invented sample records so you can see every chart populated. Delete them and paste your own.
Can I add my own methodologies, sectors and audiences?
Yes. Type them into the Data tab and the pivots and slicers pick them up. Nothing is hard-coded to the eight sample methodologies.
Can clients view it without editing it?
Yes. Share the copy view-only. Clients can click the slicers and read every page, and they cannot change your Data tab.
Does the file contain respondent data?
No. It reports at study level – sample size, response rate, cost and revenue – and holds no personal or respondent-level records.
About the Author
Built by PK – Microsoft Certified Professional with 15+ years of Excel, Google Sheets, and Power BI experience. Founder of NextGenTemplates, reaching 300K+ subscribers across YouTube channels. Every template is hand-built and tested before release.
Explore Related Templates
- Market Research Dashboard in Power BI – the same book with drillthrough and a semantic model.
- Market Research Dashboard in Excel – for teams who work offline.
- Research Institutions Dashboard in Google Sheets – grants, projects and publications.
- Product Feedback and NPS Dashboard in Google Sheets – the voice-of-customer side.
- Consulting Performance Dashboard in Google Sheets – utilisation and project margin.
- Browse every Google Sheets dashboard or the full Google Sheets template library.
A full page-by-page walkthrough is on the blog: Market Research Dashboard in Google Sheets.
Buy once, own it forever. Add the Market Research Dashboard in Google Sheets to your cart, open the PDF, click the copy link, and you have your own editable research reporting book in under ten minutes.
Watch the step-by-step video Demo:
Last updated: 27 August 2026.
Compatibility and Requirements
- Works in Google Sheets. You need a free Google account and a web browser.
- The dashboard uses native pivot tables, slicers and charts, so nothing needs to be installed. Google explains chart basics in Add and edit a chart or graph.
Related Market Research Templates
- Market Research KPI Dashboard in Google Sheets: a KPI-focused view of research performance
- Market Research Checklist in Google Sheets: a checklist to plan each study
- Market Research Dashboard in Excel: the Excel edition
- Market Research Dashboard in Power BI: the Power BI edition
- Google Sheets Business Pack (Pro): 14 business templates in one download
Browse all Google Sheets dashboards.
































Reviews
There are no reviews yet.