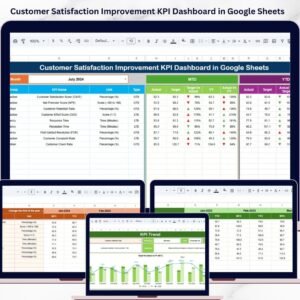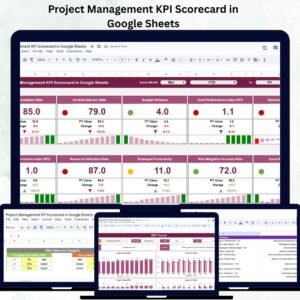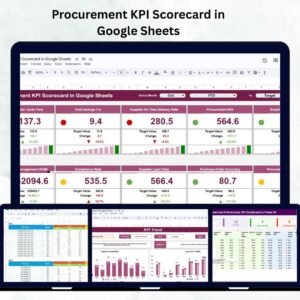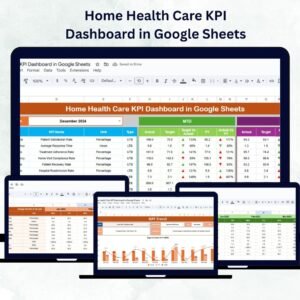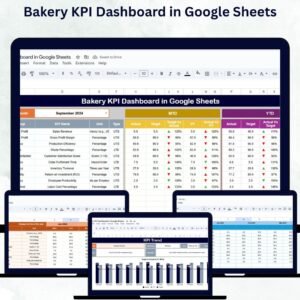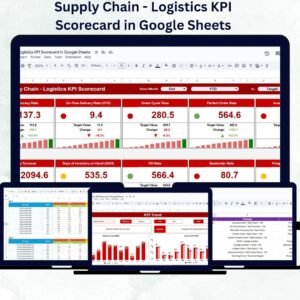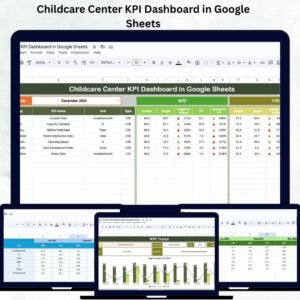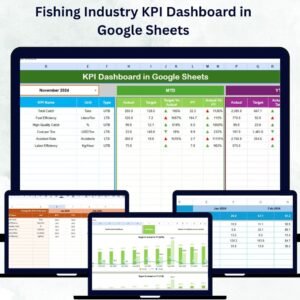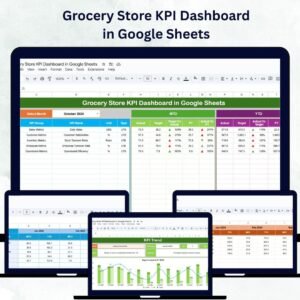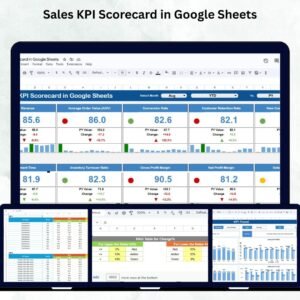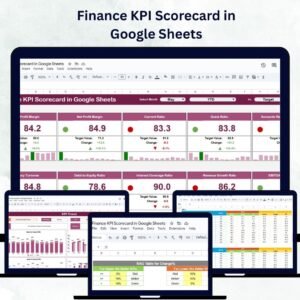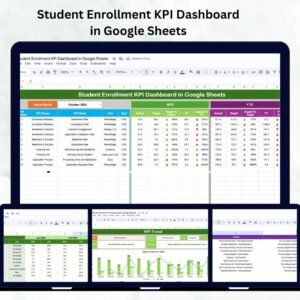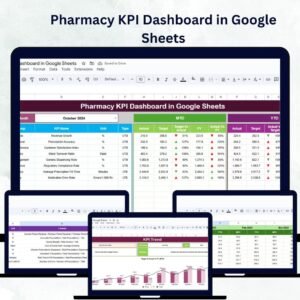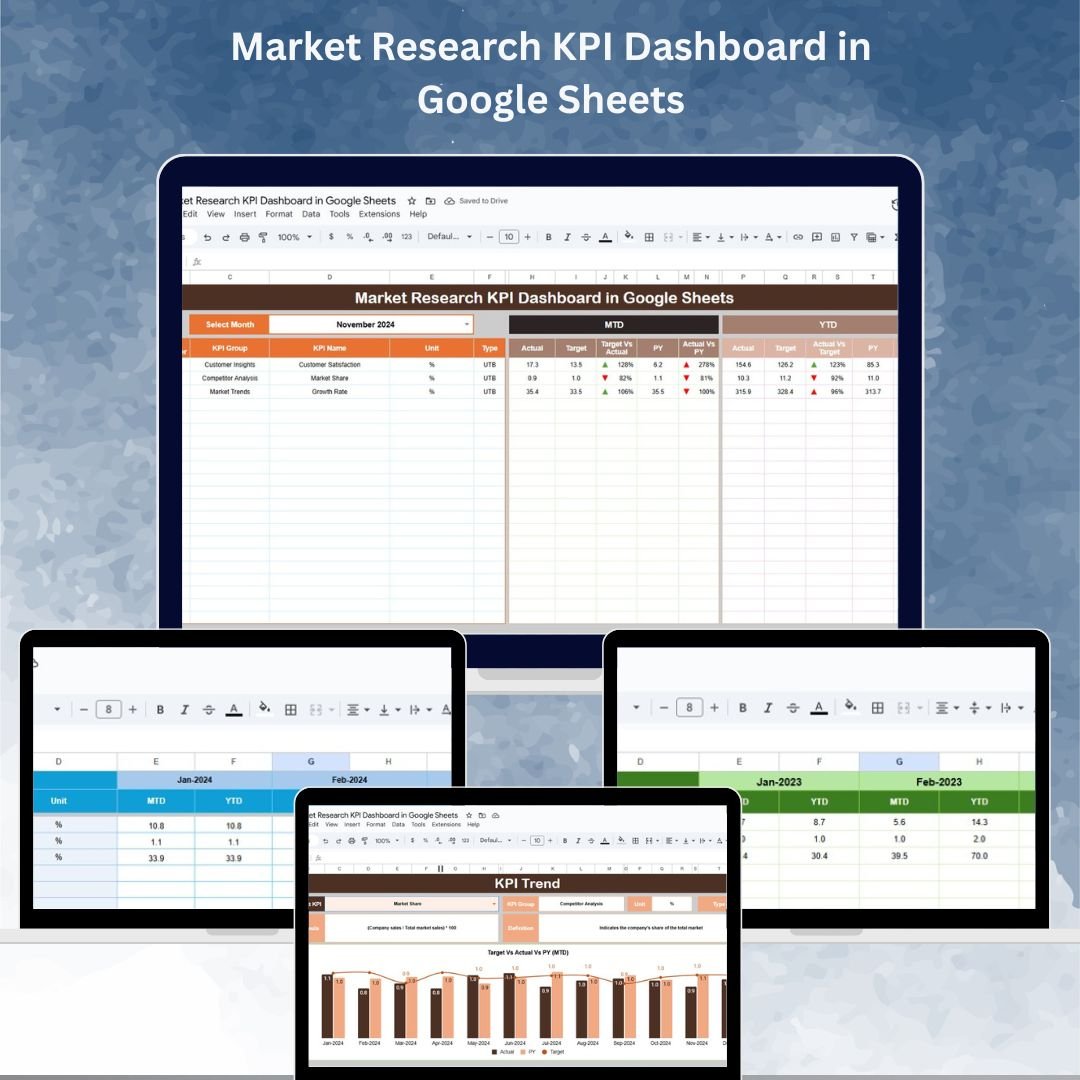
Understanding your market is the foundation of smart business decisions. The Market Research KPI Dashboard in Google Sheets is a ready-to-use, fully customizable tool that helps you track, analyze, and manage key performance indicators for market research — all in one place.
From customer behavior metrics to market trend analysis, this dashboard enables you to measure your progress against targets, compare performance with previous years, and visualize trends over time. Designed with ease of use in mind, it’s perfect for both small businesses and large organizations that need a data-driven approach to market analysis.
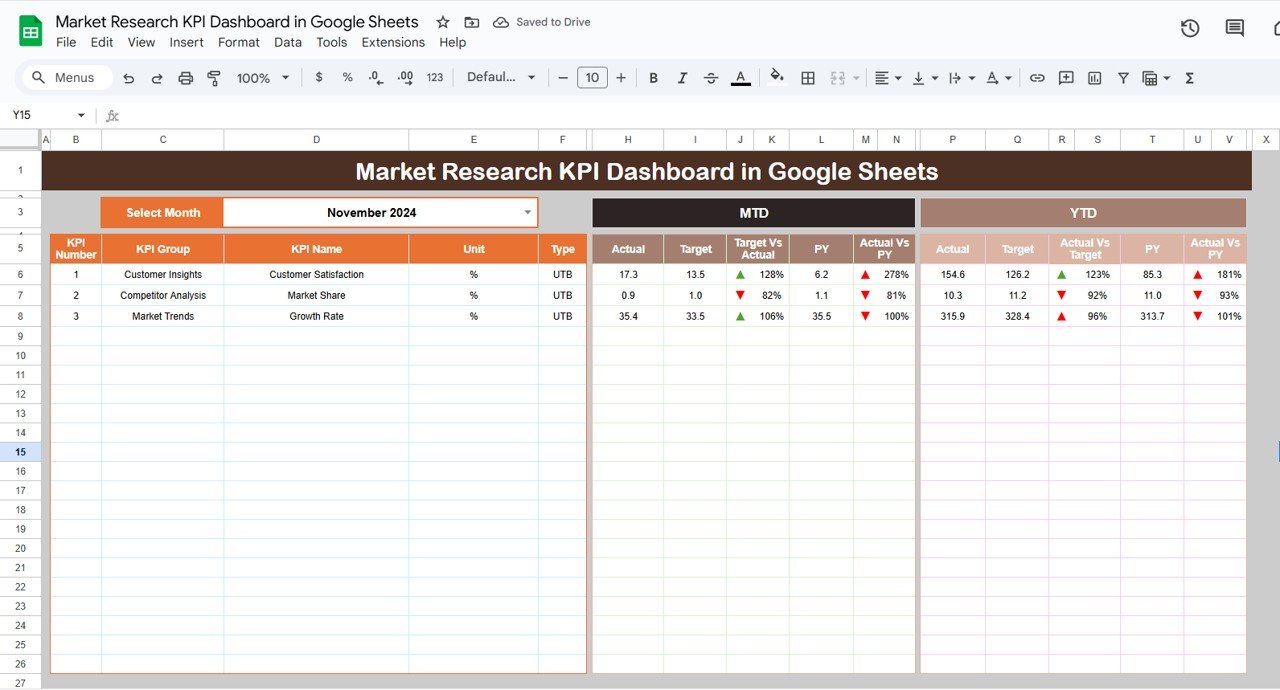
🔑 Key Features of the Market Research KPI Dashboard
📌 Dashboard Sheet Tab – Performance Overview
MTD Actual – Month-to-date actual performance
MTD Target – Month-to-date goals
PY MTD – Previous year’s performance for the same period
YTD Actual – Year-to-date actual data
YTD Target – Year-to-date goals
Conditional Formatting – Arrows (▲/▼) and color coding to indicate performance vs. target
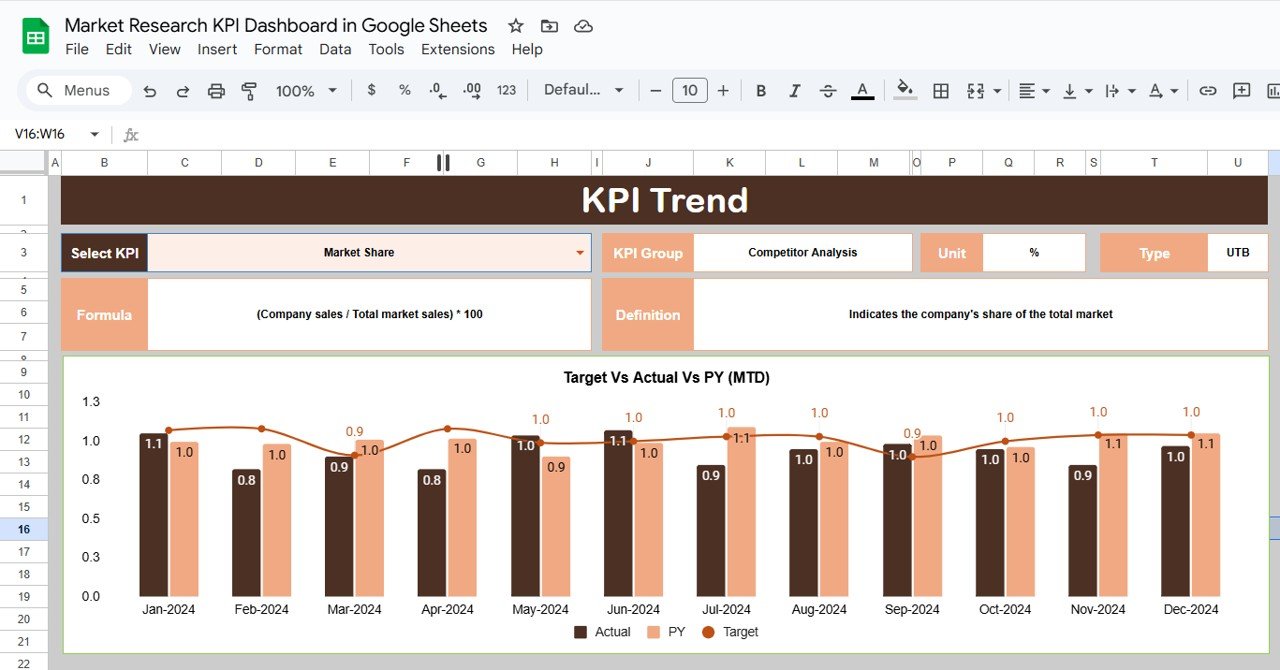
📈 KPI Trend Sheet Tab – Detailed KPI Tracking
Select any KPI from a dropdown to see its KPI Group, Unit, and whether it’s Lower the Better (LTB) or Upper the Better (UTB)
View Formula and Definition for transparency
Track trends over time to identify areas for improvement
🧾 Actual Number Sheet Tab – Data Input
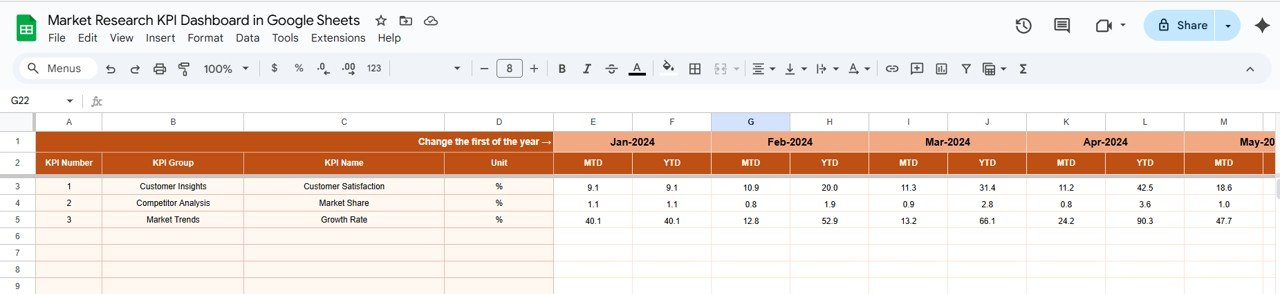
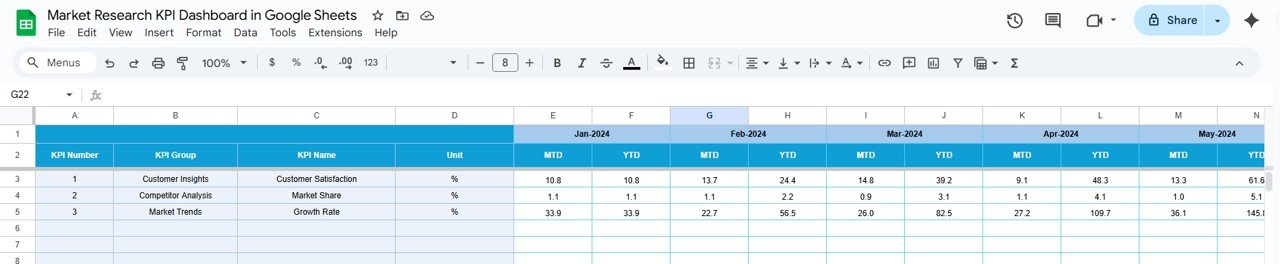
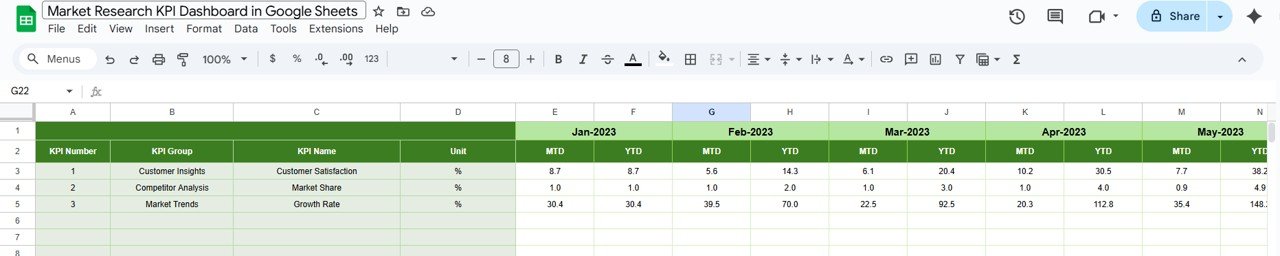
Enter MTD and YTD actual numbers for each KPI
Select month to keep your data aligned and current
🎯 Target Sheet Tab – Goal Setting
Enter MTD and YTD targets for each KPI
Compare actual performance vs. targets to identify gaps
📊 Previous Year Data Sheet Tab – Year-over-Year Comparison
Enter last year’s data for both MTD and YTD
Instantly compare current performance against historical trends
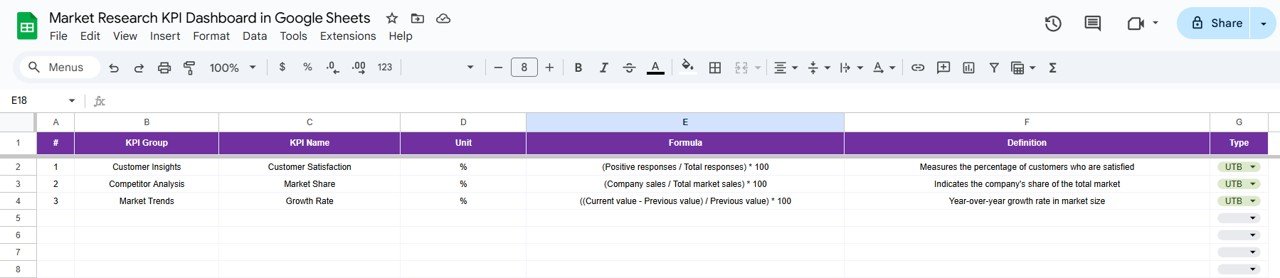
📖 KPI Definition Sheet Tab – Clarity for All Users
Define each KPI with Name, Group, Unit, Formula, and Definition
Ensure consistent understanding across all team members
📦 What’s Inside the Market Research KPI Dashboard?
✅ Dashboard Sheet – At-a-glance view of all KPIs
✅ KPI Trend Sheet – Track trends for individual KPIs
✅ Actual Number Sheet – Input current performance data
✅ Target Sheet – Set and manage goals
✅ Previous Year Data Sheet – Compare with historical performance
✅ KPI Definition Sheet – Clear reference for all metrics
✅ Pre-Built Formulas & Conditional Formatting – Fully functional from the start
✅ Customizable Layout – Adapt KPIs, targets, and visuals to fit your needs
🧠 How to Use the Market Research KPI Dashboard
Open the Google Sheet and set your KPIs in the KPI Definition Sheet.
Enter Actual Data in the Actual Number Sheet.
Set Targets in the Target Sheet.
Update Previous Year Data for comparison.
Review the Dashboard for a summary of performance.
Analyze Trends in the KPI Trend Sheet to refine strategies.
👥 Who Can Benefit from This Dashboard?
📈 Market Research Analysts – Monitor market performance and identify trends
🛒 Retail Businesses – Track product category and market share changes
📊 Marketing Teams – Measure campaign effectiveness through KPIs
🏢 Business Owners – Make informed, strategic decisions based on data
🌍 Corporate Strategy Teams – Align market research with business goals
🔗 Click here to read the Detailed blog post
Watch the step-by-step video Demo: