

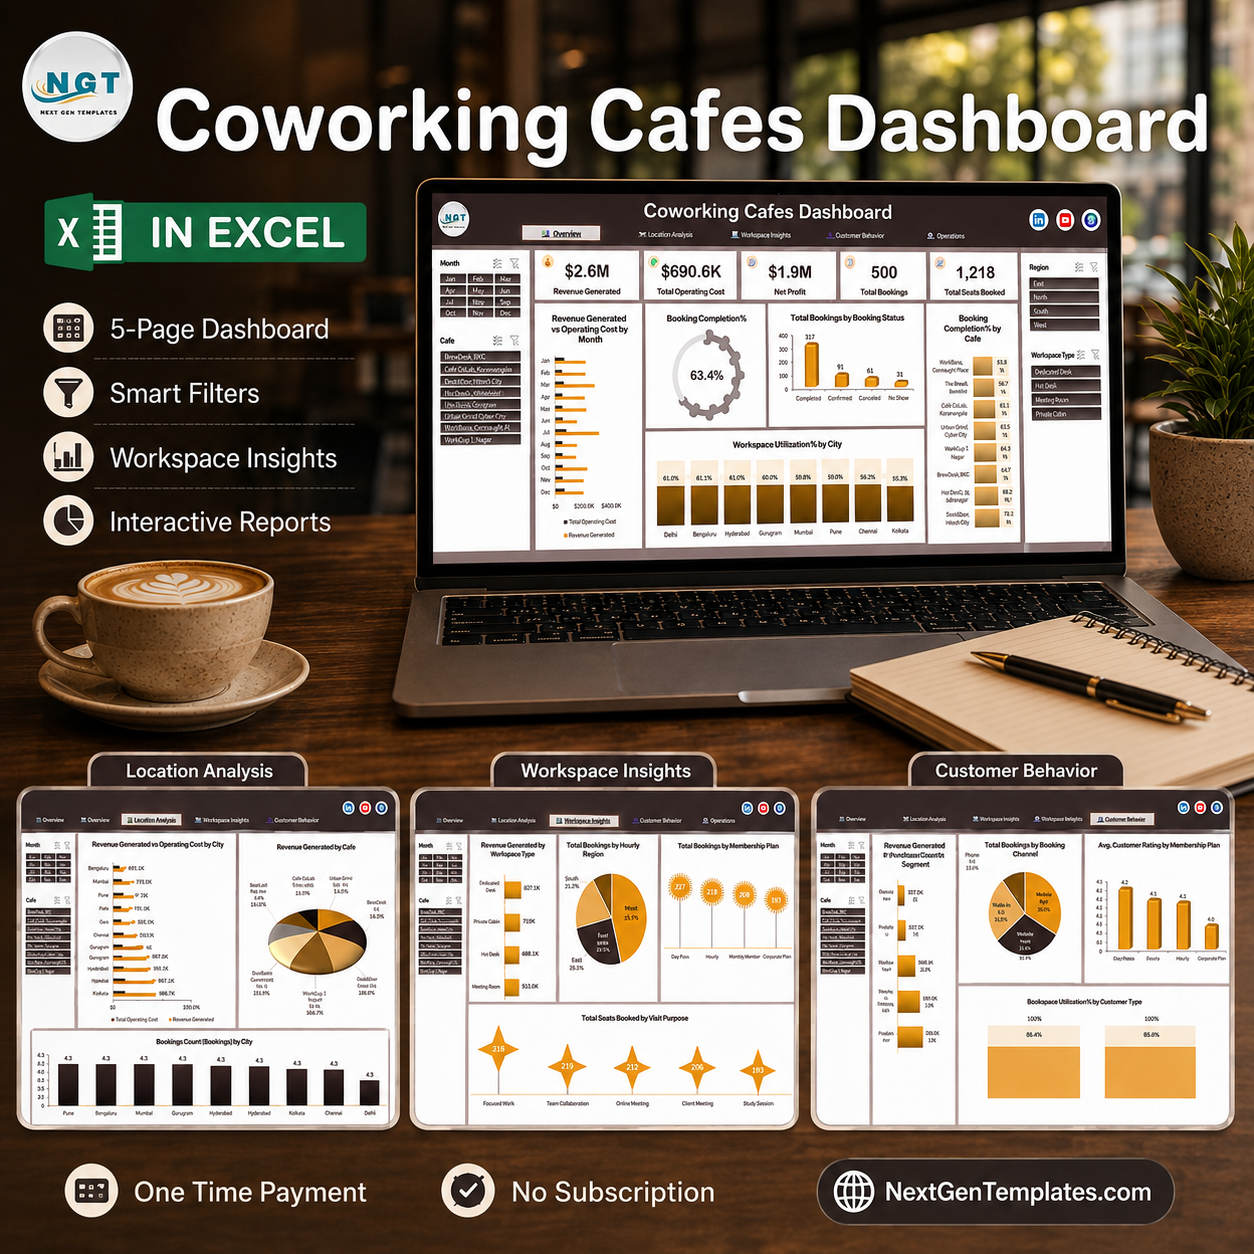

The Coworking Cafes Dashboard in Power BI turns 500 coworking-cafe bookings into five slicer-linked report pages that answer the questions a cafe network actually argues about: which of the eight cafes earns its rent, why 18.4% of bookings never happen, and whether a meeting room at 61.4% seat utilisation beats a hot desk at 54.7%. The sample year runs January to December 2025 and totals ₹2.58M booking revenue, 2,372 booking hours, 1,218 seats booked and a 4.12 out of 5 average customer rating. Built and page-tested by a Microsoft Certified Professional, delivered as a .pbix you open in the free Power BI Desktop. One payment, no subscription, and the Data.xlsx that feeds it ships in the same download so you can swap in your own bookings on day one.
Key Features of the Coworking Cafes Dashboard in Power BI
- Five report pages plus an upsell page – Overview, Revenue Trends, Workspace Mix, Cafe Operations and Customer Insights, reached from a left rail that stays in the same place on every page.
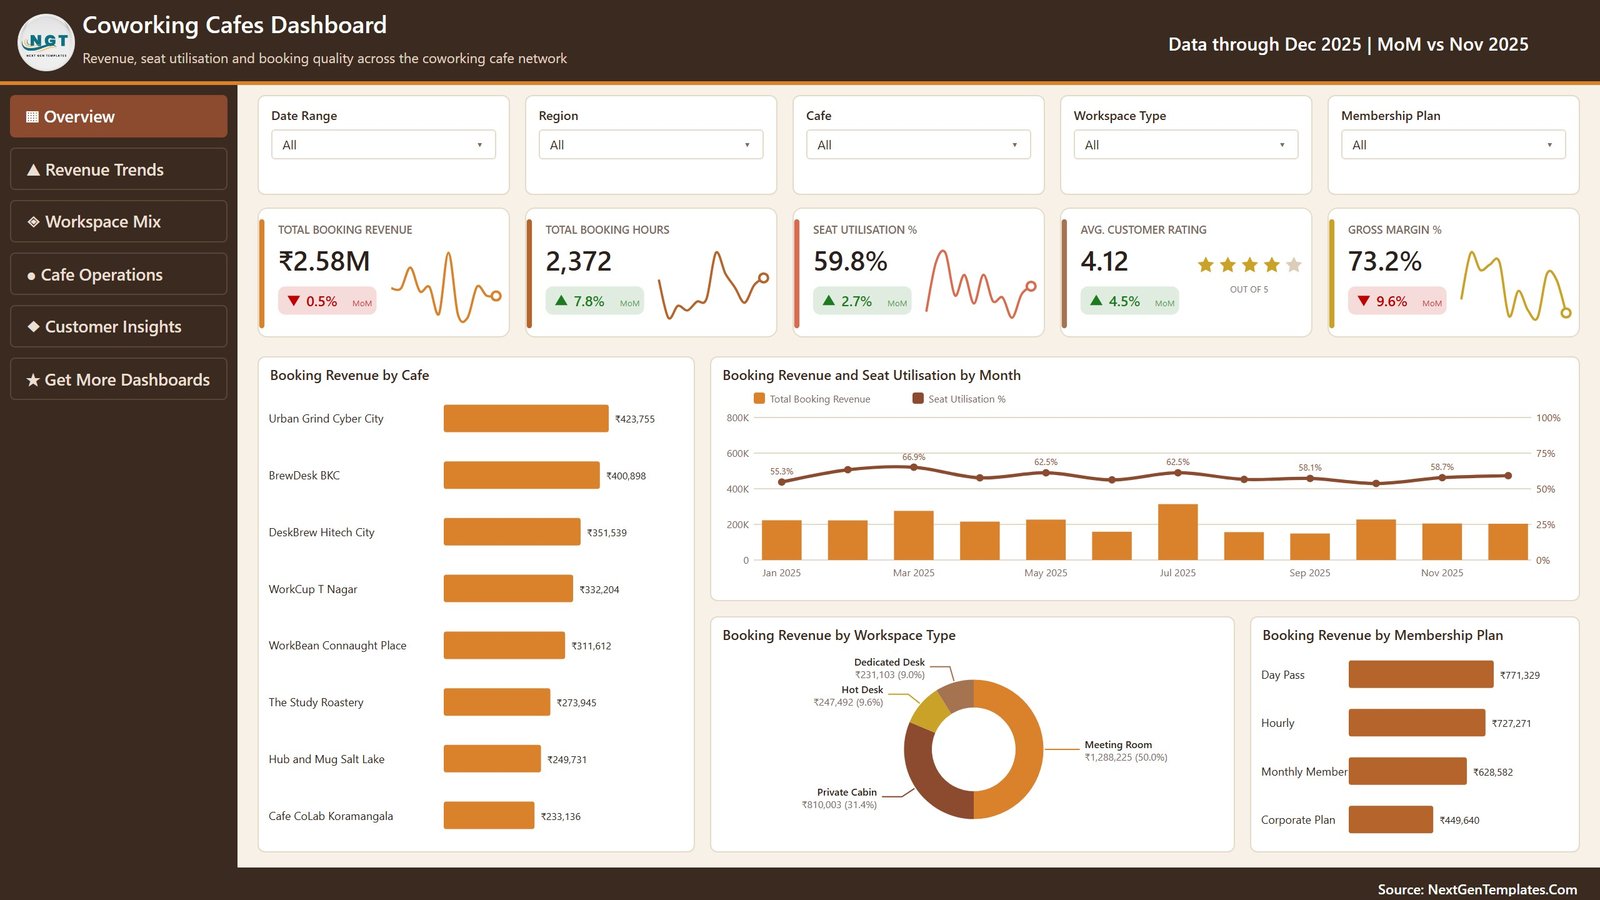
- Twenty-five KPI cards – five per page, each with a month-on-month delta against November 2025 and an inline sparkline. Total Booking Revenue ₹2.58M sits at ▼0.5% MoM while Total Booking Hours 2,372 is ▲7.8%.
- Five slicers on every page – Date Range, Region and Cafe are fixed; the fifth changes with the page (Membership Plan, Booking Channel, Visit Purpose, Booking Status, Customer Type).
- A hidden Details drillthrough bound on ten fields – Cafe, City, Region, Workspace Type, Membership Plan, Booking Channel, Customer Segment, Customer Type and more. Right-click any bar and land on the underlying bookings.
- Two tooltip pages – Category Detail and Trend Detail, so hovering a column gives context instead of a bare number.
- 30 DAX measures referenced across the report visuals, including Seat Utilisation %, Gross Margin %, Gross Profit and the SVG card measures that draw the sparklines.
- 500 booking rows across 22 columns in the bundled Data.xlsx, with a separate Date table for time intelligence.
- Eight cafes across eight Indian cities – Urban Grind Cyber City, BrewDesk BKC, DeskBrew Hitech City, WorkCup T Nagar, WorkBean Connaught Place, The Study Roastery, Hub and Mug Salt Lake and Cafe CoLab Koramangala.
What’s Inside the Coworking Cafes Dashboard in Power BI
Overview opens on the network read: Booking Revenue by Cafe ranks all eight from ₹423,755 down to ₹233,136, Booking Revenue and Seat Utilisation by Month plots the twelve months against a utilisation line that swings between 55.3% and 66.9%, and two splits show where the money comes from – Meeting Room takes ₹1,288,225 (50.0%) of revenue by Workspace Type, while Day Pass leads Membership Plan at ₹771,329.
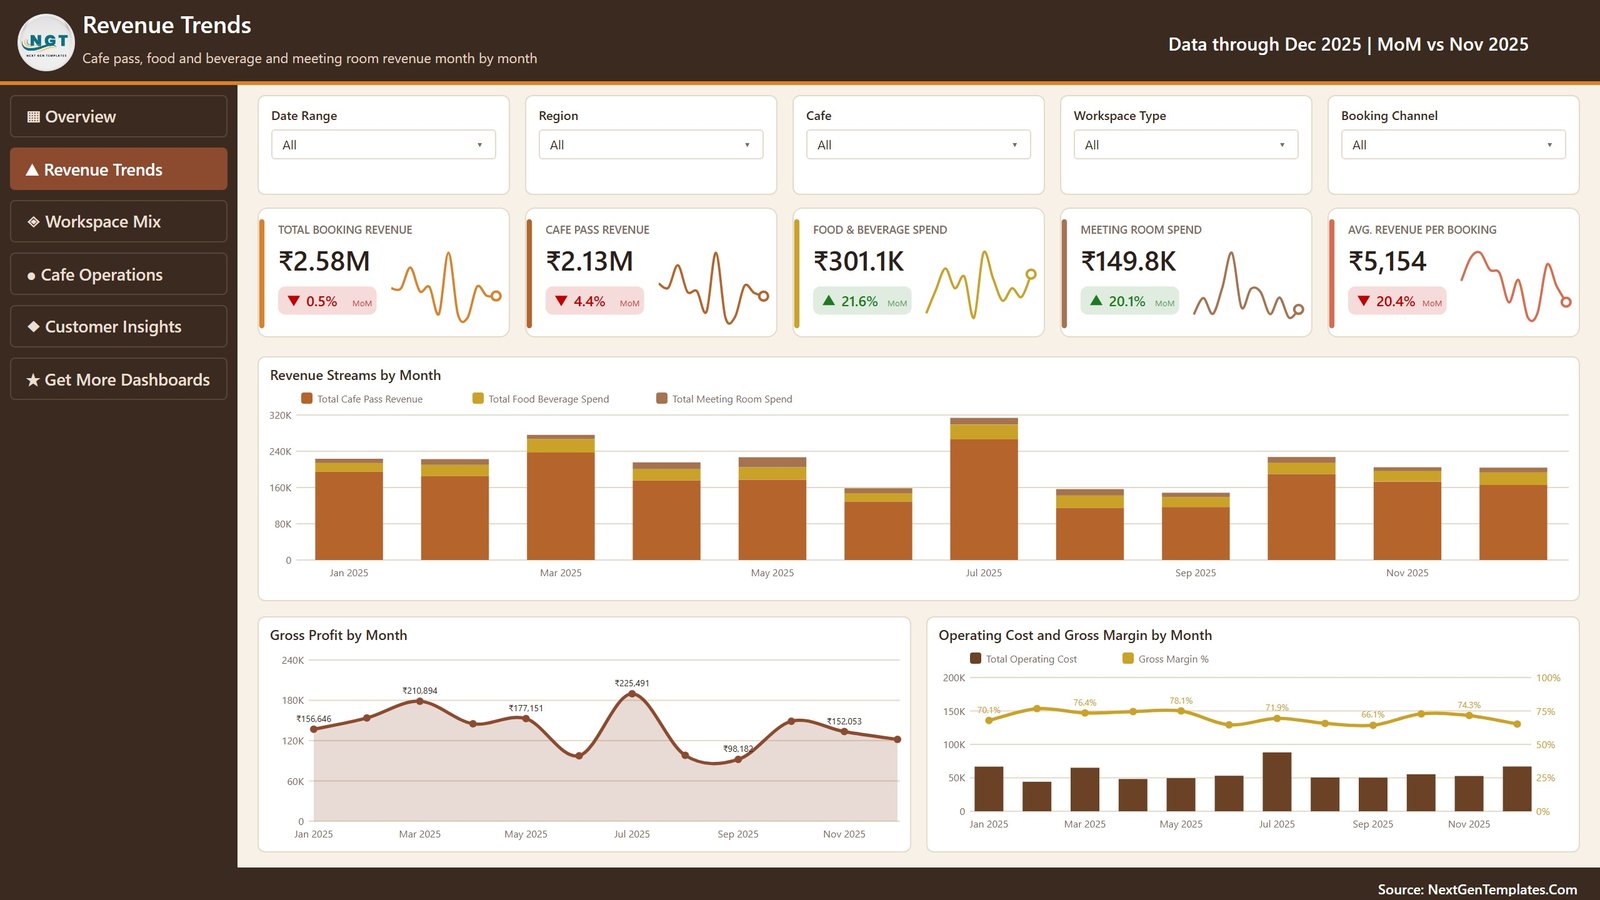
Revenue Trends separates the three income streams. Cafe Pass Revenue is ₹2.13M, Food & Beverage Spend ₹301.1K (▲21.6% MoM) and Meeting Room Spend ₹149.8K (▲20.1%). Revenue Streams by Month stacks them, Gross Profit by Month peaks at ₹225,491 in July and bottoms at ₹98,182 in September, and Operating Cost and Gross Margin by Month runs the cost bars against a margin line between 66.1% and 78.1%.
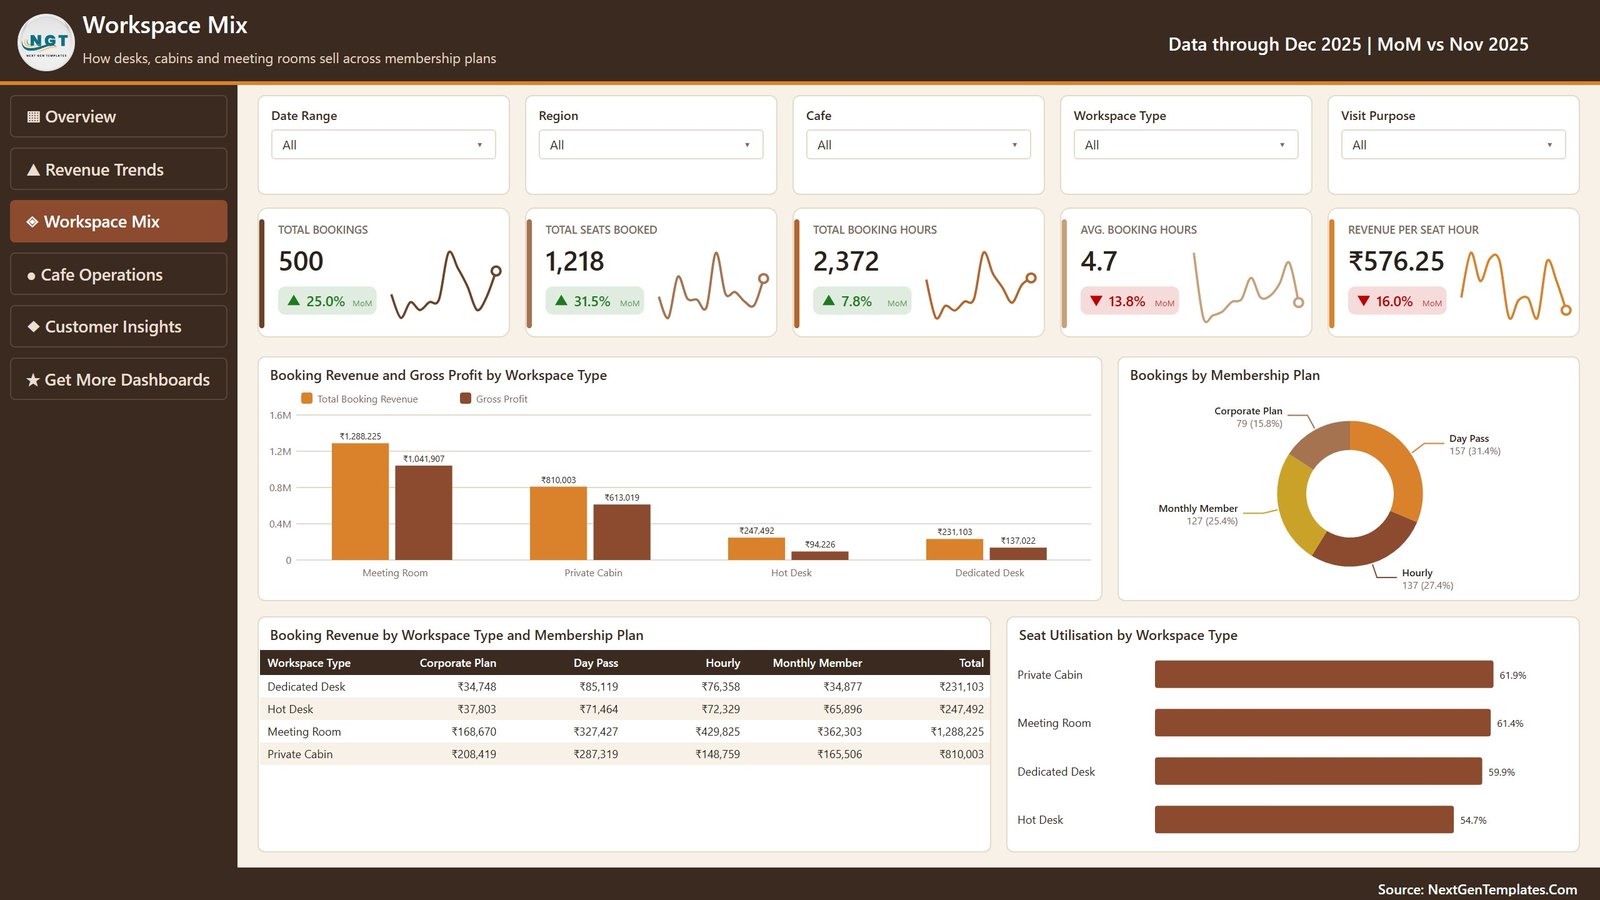
Workspace Mix is the pricing page. Booking Revenue and Gross Profit by Workspace Type puts Meeting Room at ₹1,288,225 revenue / ₹1,041,907 gross profit next to Hot Desk at ₹247,492 / ₹94,226 – the same chart that explains why Revenue per Seat Hour is ₹576.25. A four-by-four matrix crosses Workspace Type against Membership Plan, and Seat Utilisation by Workspace Type ranks Private Cabin 61.9%, Meeting Room 61.4%, Dedicated Desk 59.9% and Hot Desk 54.7%.
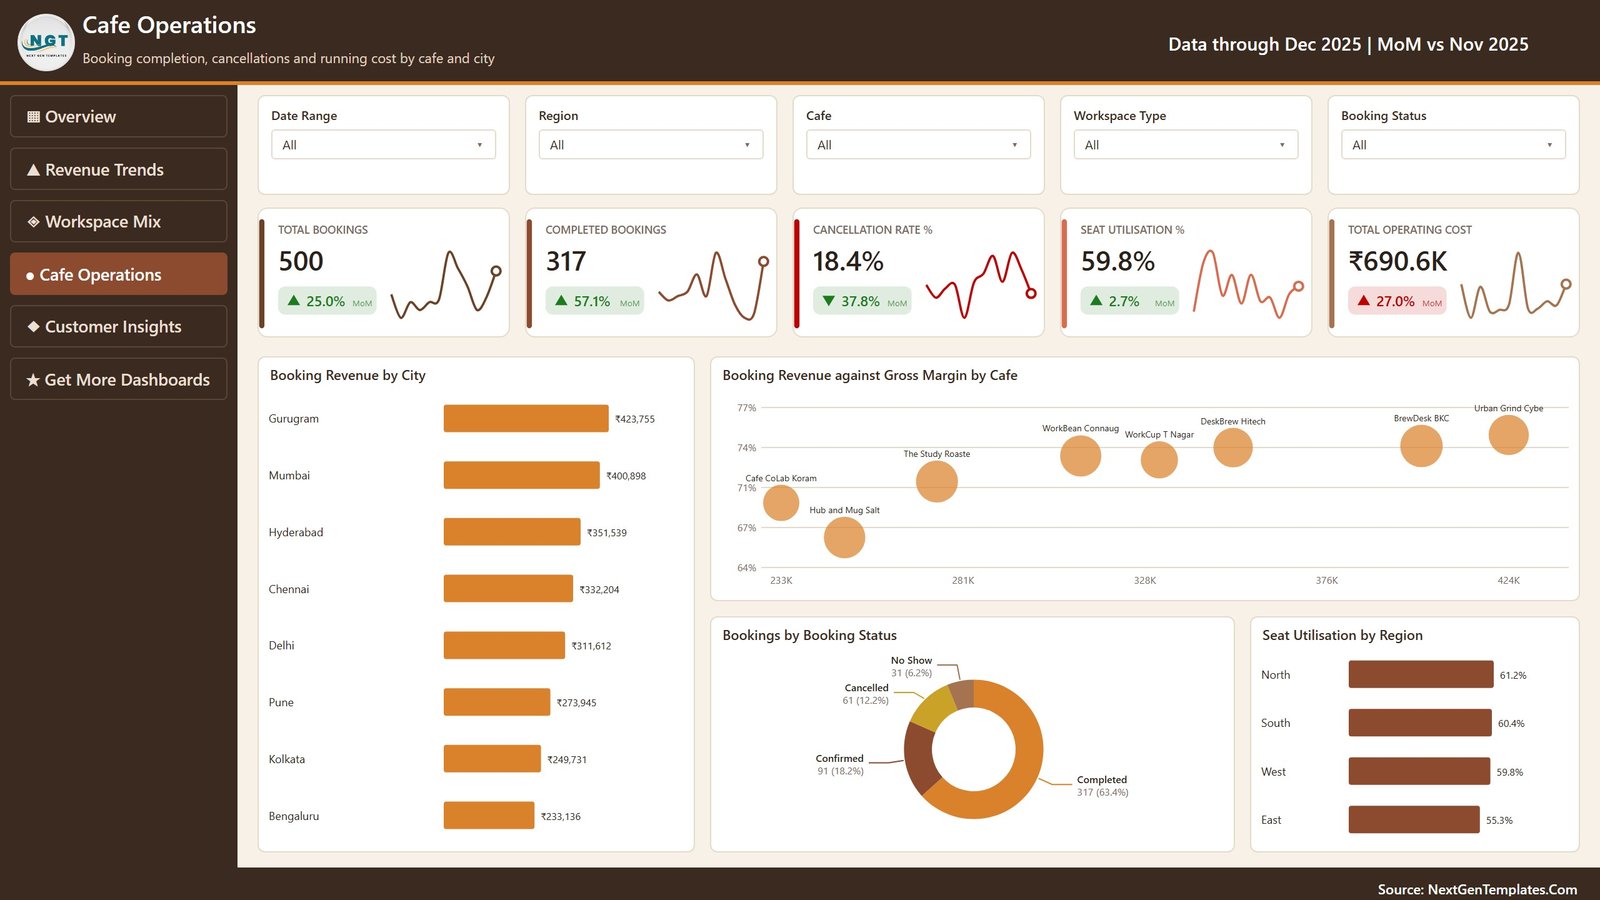
Cafe Operations is the accountability page. Of 500 bookings, 317 completed (63.4%), 91 stayed Confirmed, 61 Cancelled and 31 No Show – a Cancellation Rate of 18.4% against ₹690.6K Total Operating Cost. Booking Revenue by City ranks the eight cities, a scatter plots Booking Revenue against Gross Margin per cafe, and Seat Utilisation by Region separates North 61.2% from East 55.3%.
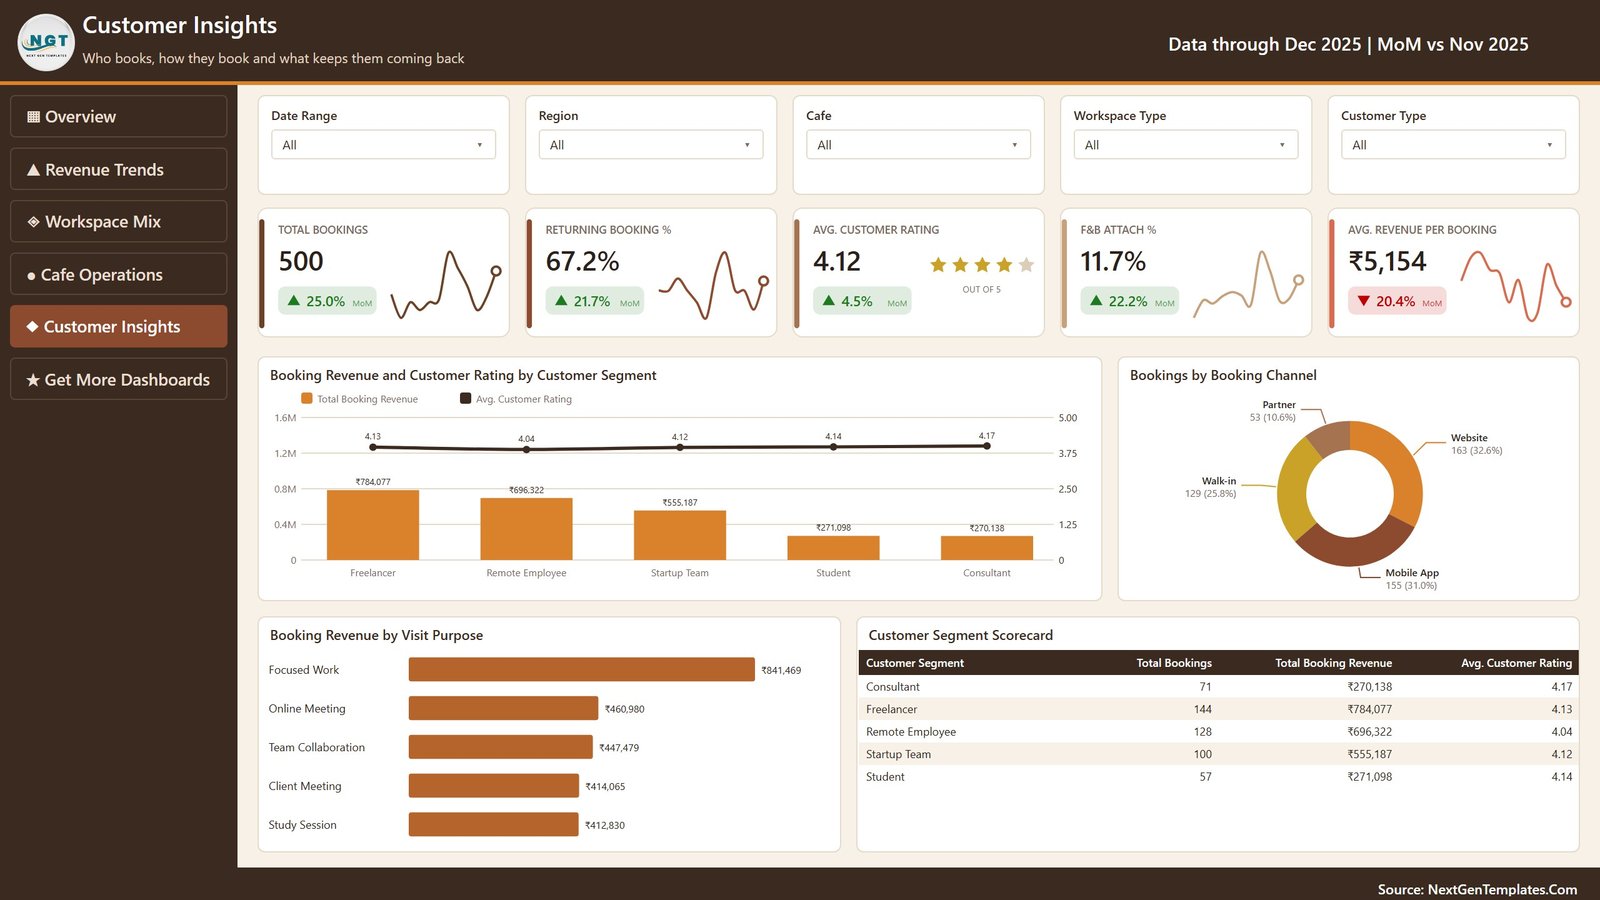
Customer Insights closes on demand. Returning Booking % is 67.2%, F&B Attach % 11.7%, and a Customer Segment Scorecard lists all five segments – Freelancer 144 bookings / ₹784,077 / 4.13 rating through to Student 57 / ₹271,098 / 4.14. Bookings by Booking Channel splits Website 163, Mobile App 155, Walk-in 129 and Partner 53, and Booking Revenue by Visit Purpose shows Focused Work at ₹841,469 ahead of four meeting-led purposes.
Coworking Cafes Dashboard in Power BI vs. Excel vs. Paid Coworking SaaS – Where This Fits
| This Power BI Dashboard | Excel Version | Paid Coworking SaaS (Nexudus, Cobot) | |
|---|---|---|---|
| Cost | One payment, $17.99 on sale | One payment, $17.99 on sale | $80–$250 per month per location |
| Platform | Power BI Desktop (free) | Excel 2016 or later | Vendor-hosted web app |
| Setup time | 15 minutes to repoint Data.xlsx | 10 minutes to paste rows | 2–6 weeks onboarding |
| Real-time team collaboration | Only if you publish to a Power BI workspace | Via OneDrive co-authoring | Yes, built in |
| Mobile access | Power BI mobile app after publishing | Excel mobile, read-only in practice | Yes |
| Customisable fields | Full – edit the model and DAX yourself | Full | Vendor-defined only |
| Share with link | Yes, after publishing to the service | No, you share the file | Yes |
| Year-1 cost at 5 users | $17.99 | $17.99 | $960–$3,000+ |
| Drillthrough to raw bookings | Yes – hidden Details page on 10 fields | Pivot drill-down only | Varies by plan |
| Takes booking payments | No – this is reporting only | No | Yes |
Who This Template Is For – and Who It’s Not For
It fits a coworking-cafe operator running two to fifteen sites who already exports bookings to a spreadsheet and wants a real report instead of a pivot table; a hospitality analyst who has to defend seat pricing per workspace type; and anyone learning Power BI who wants a finished, well-laid-out report to take apart.
It does not fit if you need a booking engine – this dashboard reads bookings, it does not take them or process payments. It is not a live system either: it refreshes from a file, so figures are as current as your last export. And if you have one cafe and forty bookings a month, the Cafe and Region comparisons will look empty; a simpler booking tracker serves you better.
How to Use the Coworking Cafes Dashboard in Power BI
- Unzip the download. You get the .pbix, the Data.xlsx that feeds it and the Power BI user manual PDF.
- Open the .pbix in Power BI Desktop – free from Microsoft, no licence needed to view or edit locally.
- Open Data.xlsx and replace the 500 sample rows with your own bookings, keeping all 22 column headers exactly as they are.
- In Power BI Desktop, use Transform data → Data source settings to point the query at your file, then click Refresh.
- Walk the five pages using the left rail, and set the Date Range, Region and Cafe slicers to the scope you are reviewing.
- Right-click any cafe bar and choose Drill through → Details to see the bookings behind the number.
- Publish to a Power BI workspace if you want the dashboard on the mobile app or shared by link.
Real-World Use Cases
Meera runs four coworking cafes in Bengaluru and Chennai. Her monthly review used to be a spreadsheet argument. Now she opens Cafe Operations, sees the 18.4% cancellation rate broken down by cafe, and takes the two worst sites to the Booking Revenue against Gross Margin scatter to check whether they are cheap to run or just cheap.
Rohit is a hospitality analyst asked whether the network should convert hot desks into meeting rooms. Workspace Mix answers it in one screen: Meeting Room turns ₹1,288,225 of revenue into ₹1,041,907 gross profit, Hot Desk turns ₹247,492 into ₹94,226. He exports that chart into the board deck unchanged.
Anita manages memberships. Customer Insights tells her Returning Booking % is 67.2% and that Freelancers book most but Consultants rate highest at 4.17, so the retention campaign targets the segment with the volume and the win-back targets the one with the goodwill.
Frequently Asked Questions
Do I need a paid Power BI licence?
No. Power BI Desktop is free and opens, edits and refreshes the .pbix. You only need a Pro or Premium licence if you want to publish it to the Power BI service and share it with colleagues by link.
The sample data is in Indian Rupees. Can I change the currency?
Yes. The figures are formatted in ₹ because the sample cafes are in eight Indian cities. Change the format string on the revenue and cost measures in Power BI Desktop and every card, chart and table follows.
How many rows can I load?
The sample is 500 bookings, but the model is a straightforward import table with a Date table beside it. Hundreds of thousands of rows are fine in Power BI Desktop; the sample is small so the file downloads quickly.
Can I connect it to my booking system instead of the Excel file?
Yes. Replace the Data query’s source with SQL Server, a folder of CSVs or any Power BI connector, keeping the 22 column names. The measures and visuals are bound to column names, not to the file.
What is the difference between this and the Excel version?
Different builds of the same topic. The Coworking Cafes Dashboard in Excel uses pivot-driven charts and slicers across five Excel sheets; this one is a Power BI model with DAX measures, a drillthrough page and tooltip pages. Buy the Excel one if your team lives in Excel; buy this one if you want to publish and share.
Does it take bookings or payments?
No. It is a reporting template. It reads booking data you already have – it is not a booking engine, a POS or a membership billing system.
Can I add my own logo and colours?
Yes. The report uses a custom theme file and a logo image in the header. Swap the image and edit the theme JSON in Power BI Desktop, and all five pages restyle together.
About the Author
Built by PK – Microsoft Certified Professional with 15+ years of Excel, Google Sheets, and Power BI experience. Founder of NextGenTemplates, reaching 300K+ subscribers across YouTube channels. Every template is hand-built and tested before release.
Explore Related Templates
- Coworking Cafes Dashboard in Excel – the same topic built as an Excel workbook, already live on the store.
- Coworking Space Dashboard in Power BI – desk-and-membership analytics without the cafe revenue streams.
- Coworkation Startups Dashboard in Power BI – for work-and-travel operators.
- Remote Work Communities Dashboard in Power BI – community and engagement side of the same market.
- Power BI Dashboard Mega Collection – 15 premium Power BI templates in one bundle.
- Browse the whole Power BI Dashboard category or the wider Power BI collection.
Buy the Coworking Cafes Dashboard in Power BI once and own it. Download the .pbix, point it at your own bookings and have the seat-utilisation, cancellation and workspace-margin answers ready before your next network review. No subscription, no seat count, no renewal.
Last updated: 26 August 2026.

































Reviews
There are no reviews yet.