

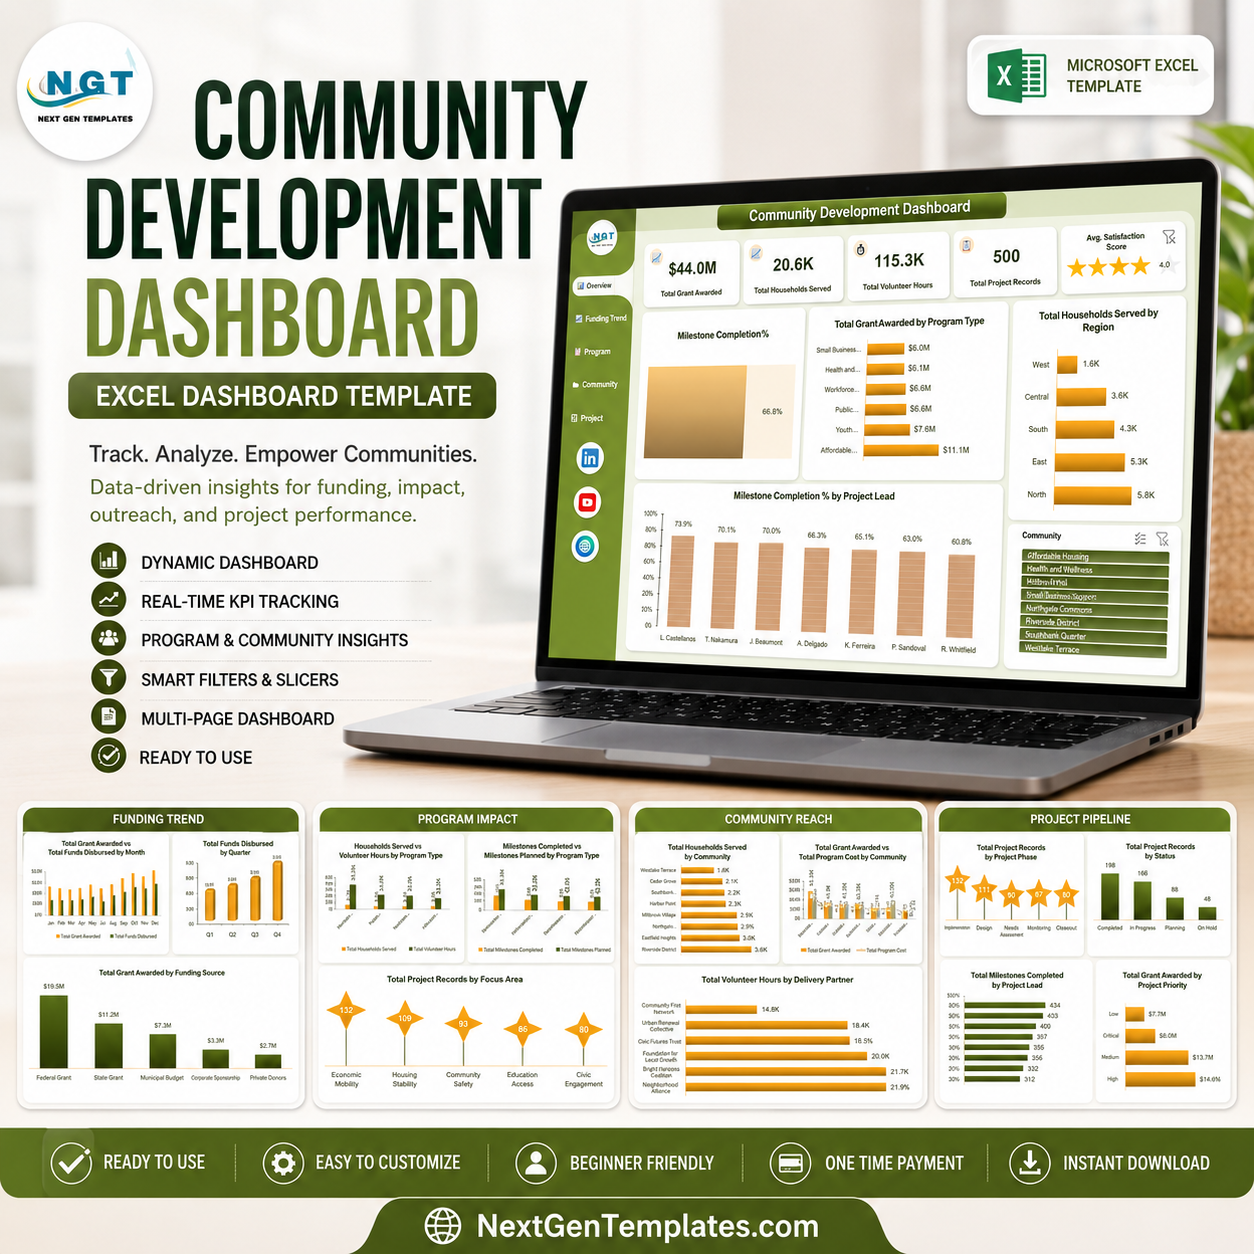
The Community Development Dashboard in Excel turns 500 sample project records into a five-page view of funding, households served, volunteer effort, program reach, and delivery progress. The overview shows $44.0M in grants awarded, 20.6K households served, 115.3K volunteer hours, a 66.8% milestone completion rate, and an average satisfaction score of 4.0. Replace the sample rows with your own structured data, refresh the workbook, and use the Month, Program Type, and Community slicers to focus each review. It is a one-time purchase with no per-user subscription. Figures shown are sample data, not sector benchmarks or promised outcomes.
Key Features of the Community Development Dashboard in Excel
- Five linked analysis pages for overview, funding, program impact, community reach, and project pipeline reporting.
- 500 sample project records so every page is populated and ready to explore before you add your own information.
- Three reusable slicers for Month, Program Type, and Community on the principal analysis pages.
- Funding visibility across grants awarded, funds disbursed, funding sources, program types, quarters, priorities, and communities.
- Outcome and effort measures for households served, volunteer hours, milestones, satisfaction, project counts, and program cost.
- Project delivery views by phase, status, priority, focus area, project lead, region, and delivery partner.
- Editable Excel workbook with the source file and a PDF user manual inside the download ZIP.
What’s Inside the Community Development Dashboard in Excel
Overview
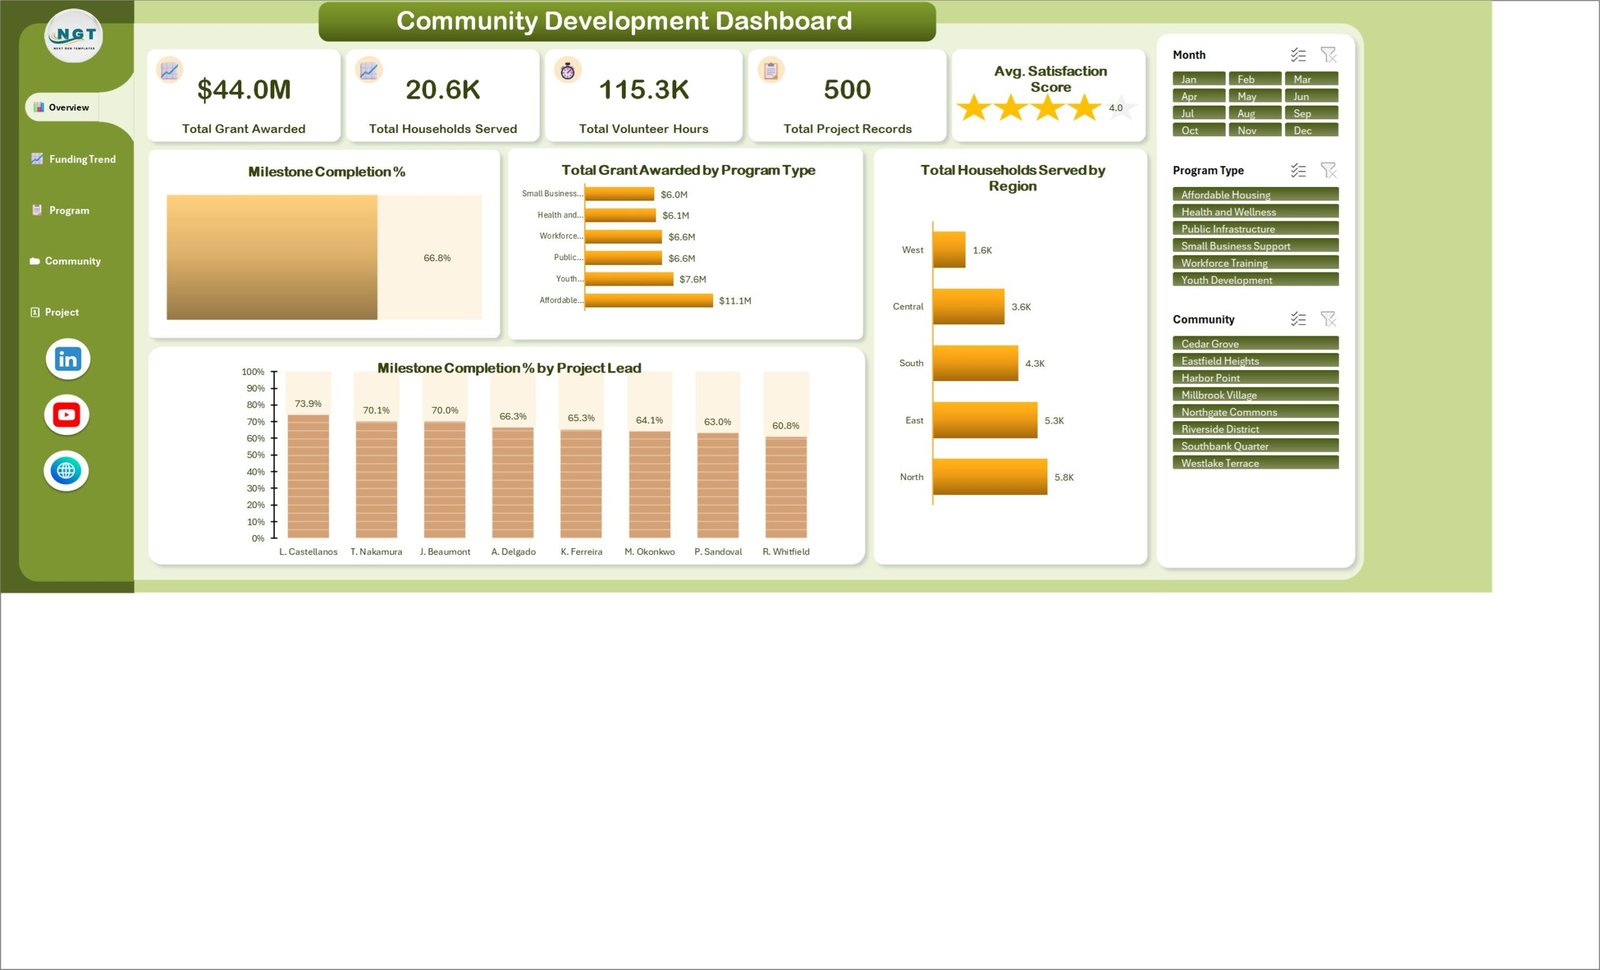
The opening page brings the headline measures into one place: $44.0M awarded, 20.6K households served, 115.3K volunteer hours, 500 records, 4.0 average satisfaction, and 66.8% milestone completion. Supporting visuals compare grant value by program type, households served by region, and milestone completion by project lead.
Funding Trend
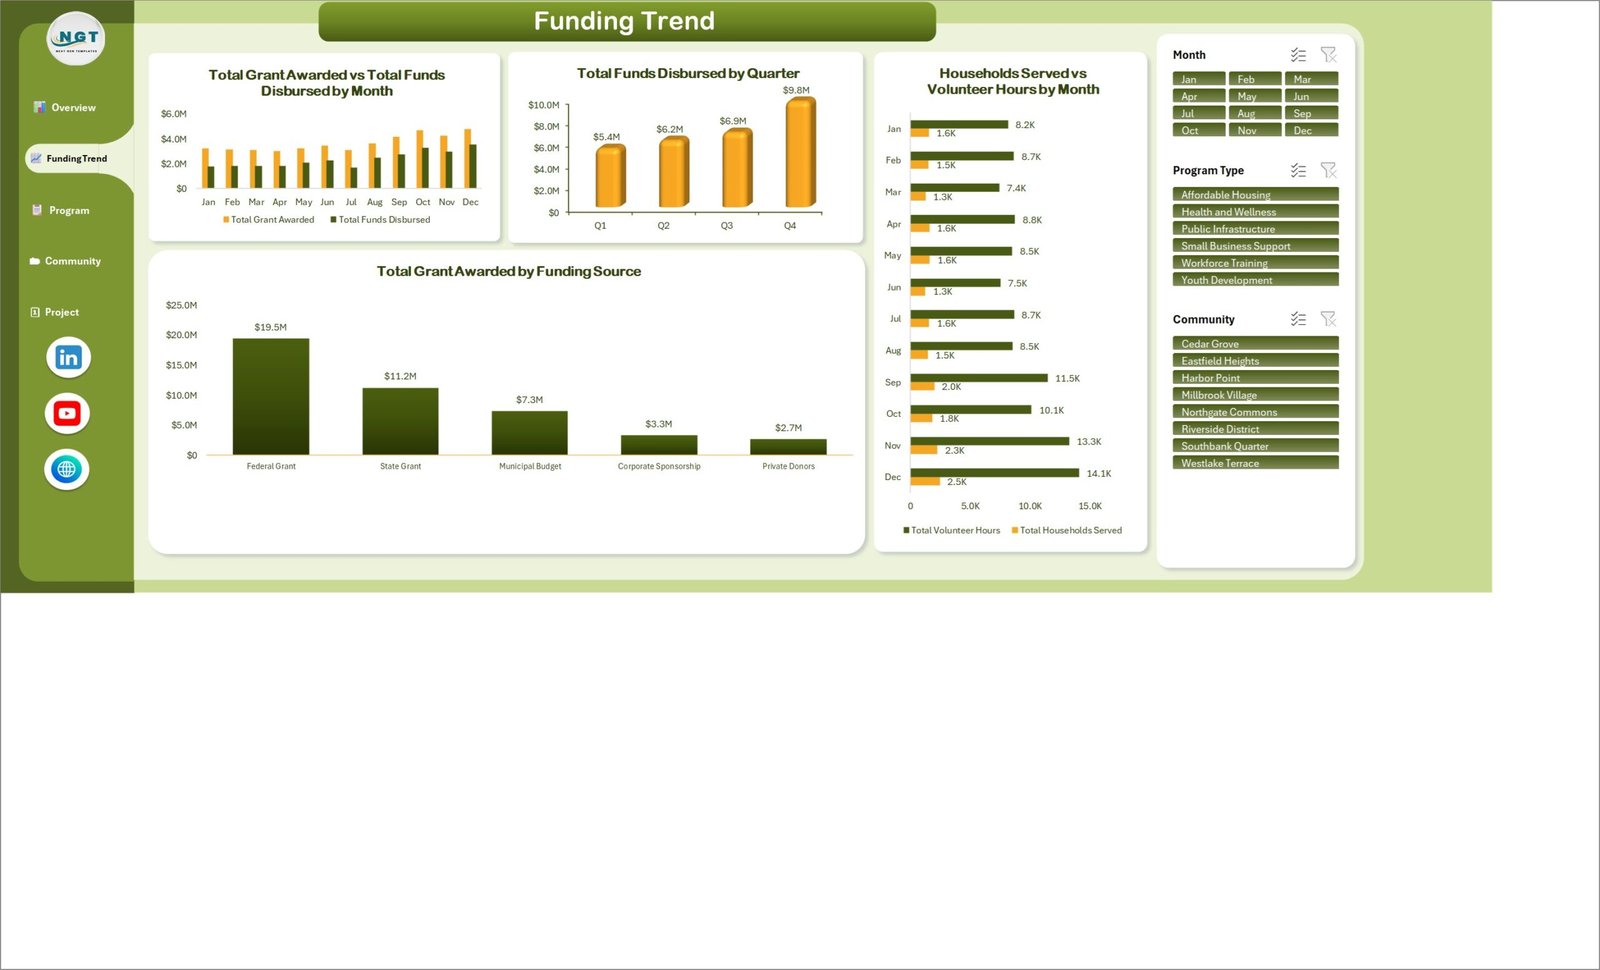
Track grants awarded against funds disbursed by month, view quarterly disbursement totals, and compare funding sources. The sample view moves from $5.4M disbursed in Q1 to $9.8M in Q4 and breaks the $44.0M award total into federal, state, municipal, corporate, and private sources.
Program Impact
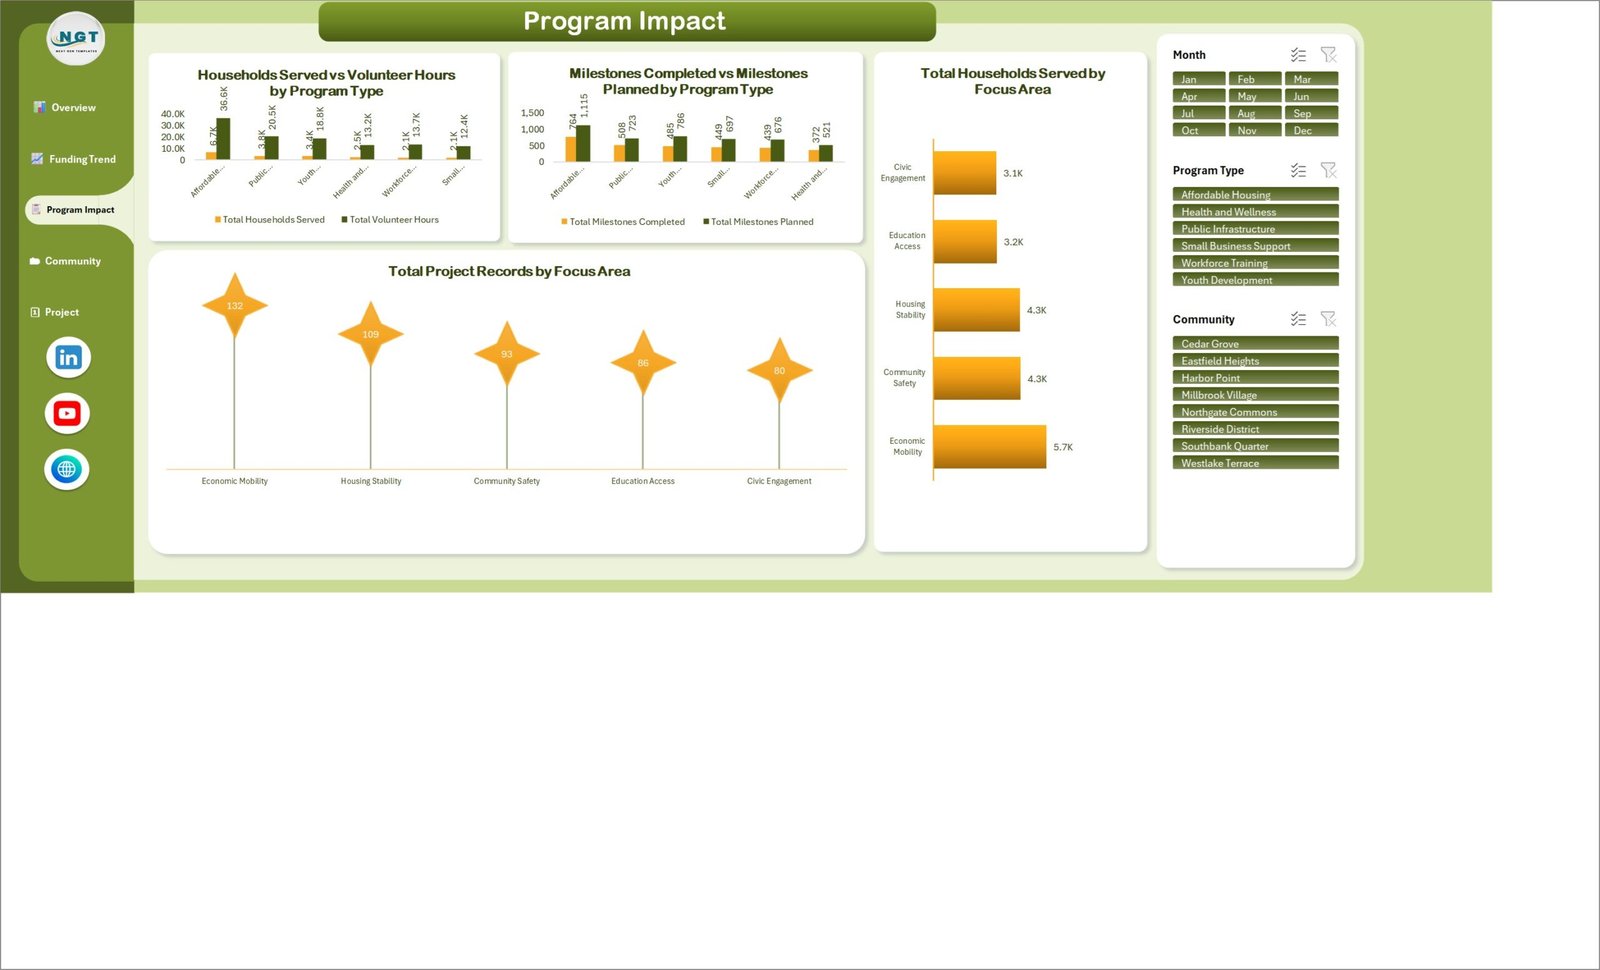
Compare households served with volunteer hours by program type, completed milestones with planned milestones, and households reached by focus area. A separate visual counts project records across Economic Mobility, Housing Stability, Community Safety, Education Access, and Civic Engagement.
Community Reach
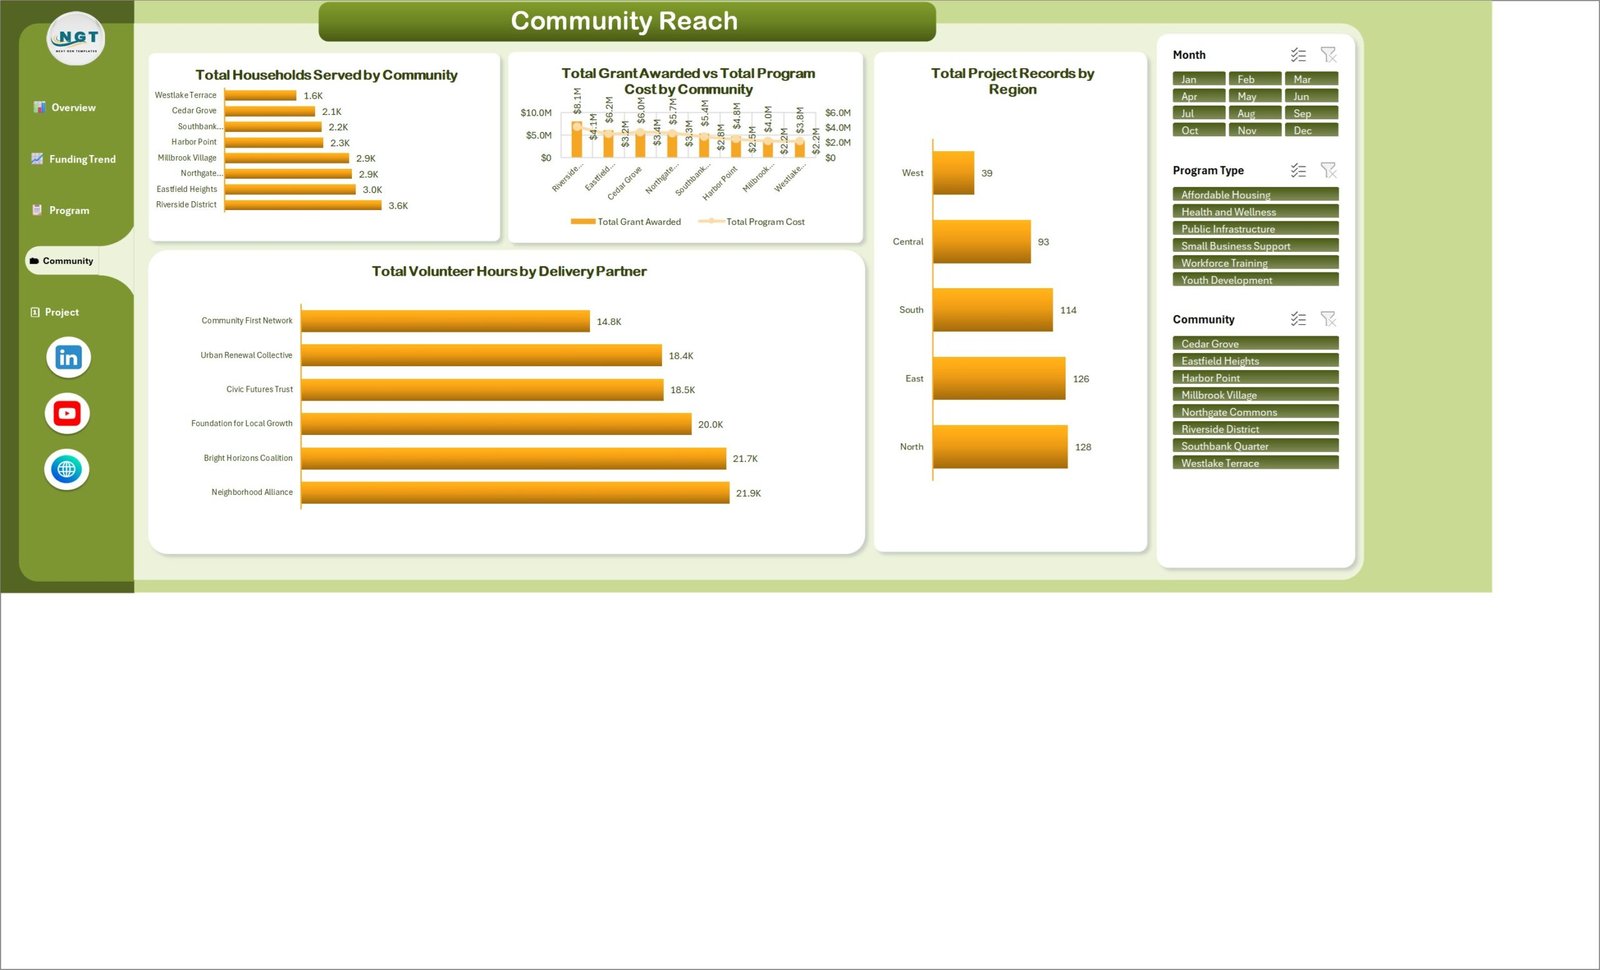
See household reach by community, grants versus program cost by community, project counts by region, and volunteer contribution by delivery partner. This page helps teams discuss where activity is concentrated without presenting the sample figures as evidence of causation or program effectiveness.
Project Pipeline
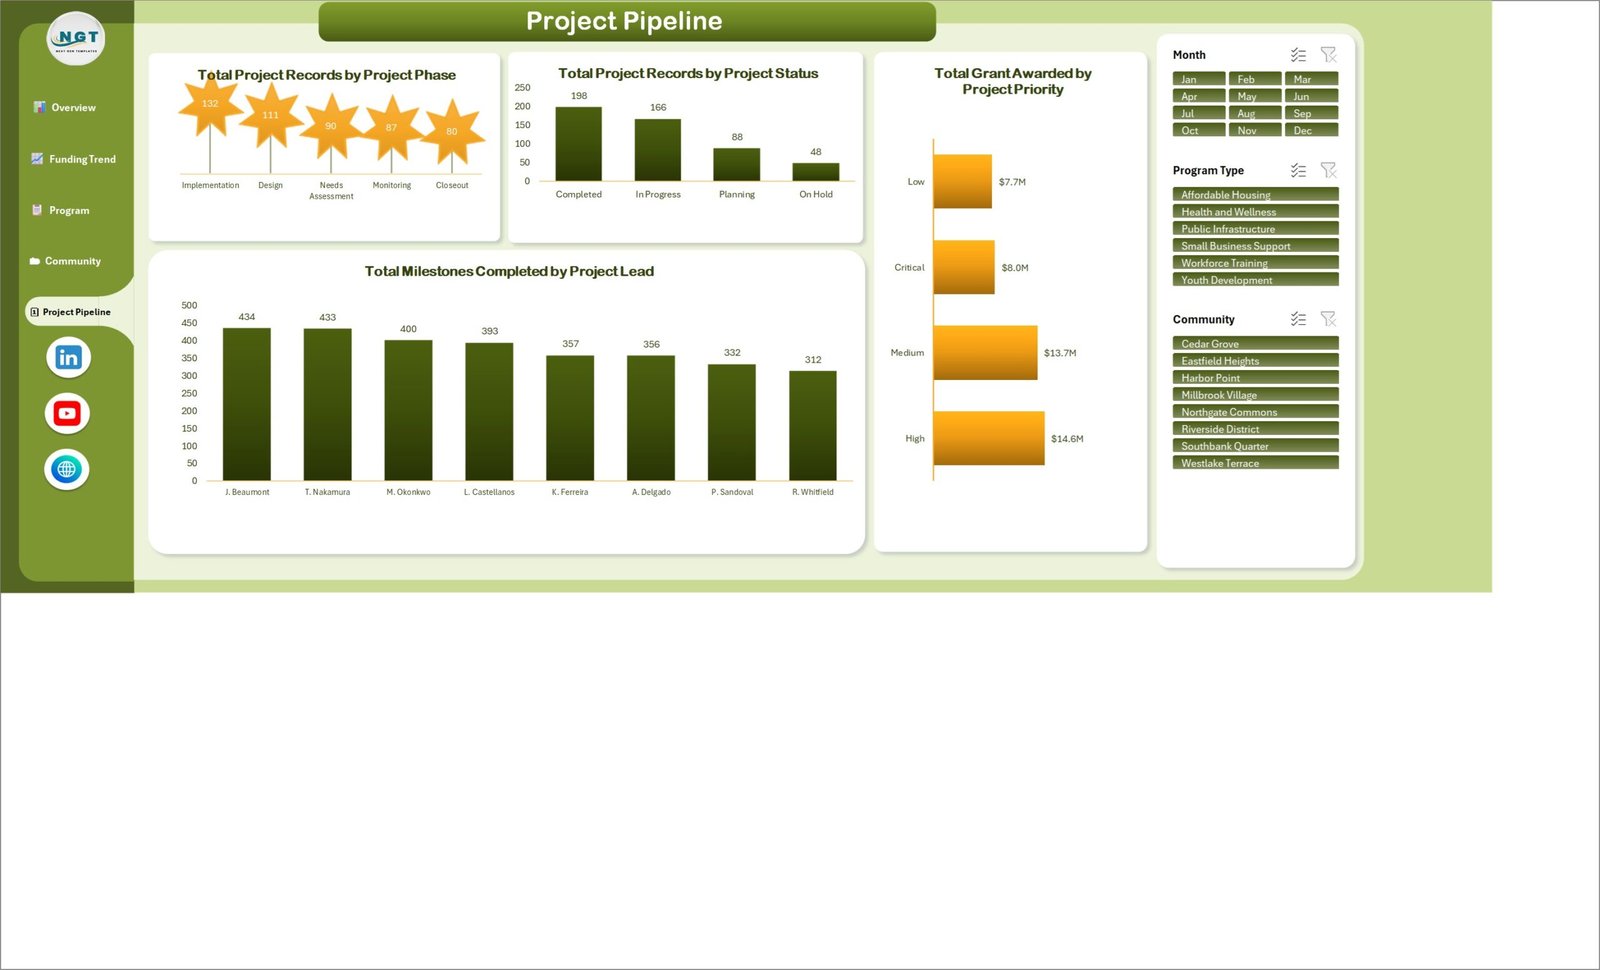
Review the portfolio by phase and status, compare awarded funding by project priority, and see milestones completed by project lead. The sample data contains 198 completed, 166 in-progress, 88 planning, and 48 on-hold records.
Community Development Dashboard in Excel vs. Google Sheets vs. Paid Nonprofit SaaS – Where This Fits
| Capability | This Excel template | Google Sheets alternative | Paid nonprofit SaaS |
|---|---|---|---|
| Cost model | $17.99 sale price, one time | Usually one-time template cost | Recurring subscription |
| Platform | Microsoft Excel desktop | Browser-based spreadsheet | Vendor cloud |
| Setup | Replace sample data and refresh | Copy a sheet and replace data | Configuration and onboarding |
| Collaboration | File sharing or Microsoft 365 co-authoring | Native link sharing | Role-based collaboration |
| Custom fields | Editable workbook structure | Editable sheet structure | Depends on plan and permissions |
| Grant and impact views | Included across five pages | Depends on template | Often configurable |
| Case management and audit trail | No | No | Commonly available |
Who This Template Is For – and Who It’s Not For
Good fit: nonprofit program managers, local development agencies, grant administrators, foundations, community partnerships, and public-sector teams that already maintain a clean project register in Excel and need a repeatable reporting layer.
Not a fit: teams needing beneficiary case management, donor receipting, grant compliance workflows, accounting integration, row-level security, automated data collection, or an auditable system of record. This is a reporting workbook, not a CRM, grant-management platform, accounting system, or impact-evaluation method.
How to Use the Community Development Dashboard in Excel
- Download and unzip the package.
- Read the included PDF user manual.
- Open the Excel workbook and review the sample data structure.
- Back up the original file, then replace sample records with your own data while preserving headers and value formats.
- Refresh the workbook and test the Month, Program Type, and Community slicers.
- Validate totals against your source system before sharing screenshots or decisions.
Real-World Use Cases
Maya, a nonprofit program director, uses the Overview and Program Impact pages for a monthly leadership review. Daniel, a grant manager, compares awards and disbursements before preparing a funder update. Aisha, a community partnership lead, filters to one community and reviews households reached, partner volunteer hours, and open projects before a coordination meeting.
Frequently Asked Questions
Does it connect automatically to grant or CRM systems?
No. You import or paste structured data into Excel and refresh the workbook.
Are the sample results industry benchmarks?
No. All displayed figures are demonstration data and should be replaced with your own verified records.
Can I customize the workbook?
Yes. It is an editable Excel file, but keep a backup and preserve source headers used by pivots, charts, and slicers.
Does it prove program impact?
No. It summarizes the measures you provide. Evaluation design, attribution, and data quality remain your responsibility.
Does it require macros?
No macro-enabled file is included; the package contains an .xlsx workbook and a PDF manual.
Can multiple people use it?
You can share it through Microsoft 365 or a shared drive, subject to your organization’s permissions and Excel licensing.
About the Author
Built by PK – Microsoft Certified Professional with 15+ years of Excel, Google Sheets, and Power BI experience. Founder of NextGenTemplates, reaching 300K+ subscribers across YouTube channels. Every template is hand-built and tested before release.
Explore Related Templates
- Community Services Dashboard in Excel
- Community Services Dashboard in Power BI
- Housing & Urban Development Dashboard in Excel
- Housing & Urban Development Dashboard in Power BI
Browse more Excel dashboards and Microsoft Excel templates.
Download the Community Development Dashboard in Excel for $17.99 and turn a structured project register into a consistent five-page review. Read the full walkthrough on the PK-AnExcelExpert blog.
Last updated: 18 August 2026.























Reviews
There are no reviews yet.